


Peanut is an important food crop grown in over 100 countries with a total production of 38 million tons in 2010. Peanut seeds are rich source of oil (48 to 50%), protein (25 to 28%), vitamins and minerals (Janila et al., 2013). Peanut oil is extensively used for cooking purpose, because it contains rich fatty acids such as oleic, linoleic, palmitic, stearic, arachidic, and behenic acids.
Recently, more emphasis has been placed on breeding for improving the peanut oil quality, so a fast efficient mass screening method to determine the content of fatty acids has required in breeding program. For measuring oil and its fatty acid contents in peanut seed, the soxhlet and gas chromatography (GC) methods are widely utilized. However, these methods and related methodologies are relatively complicate and time consuming and involved corrosive chemicals and required elaborate laboratory facilities, which has deterred use in many breeding program (Williams et al., 1984; Pazdermik et al., 1997). Then rapid and less hazardous methods such as the use of near infrared reflectance spectroscopy (NIRS) is needed to estimate fatty acid contents in peanut seeds.
The NIRS is a multi-trait technique that fulfills most of the requirements for rapid, accurate, and cost-effective mass screening for several seed quality trait in many crops (Pazdemik et al., 1997; Valasco et al., 1997; Perez-Vich et al., 1998; Oh et al., 2000; Lee and Choung, 2008; Ahn and Kim, 2012). NIRS has been used to measure moisture, protein, oil, starch, antocyanin and lignan contents in many cereals, legumes, forage, sesame and other food commodities over the past 30 years (Roy et al., 1993; Hatty et al., 1994; Halgerson et al., 1995; Kim et al., 2007b; Kim et al., 2008). Although the oil contents have been accurately estimated using NIRS in foreign countries (Oh et al., 2000), the NIRS applications and studies of fatty acids of peanut were insufficient in Korea. Therefore, the objectives of this study were to develop the accurate NIRS equation to estimate fatty acid contents in peanut and to provide the mass screening technique for high oleate peanut breeding.
MATERIALS AND METHODS
Plant material
The 329 peanut germplasms were used in this study. The peanuts were grown at the experimental field of Department of Southern Area Crop Science, NICS, Miryang, Korea. The peanut seed samples were ground with a ball mill and sieved with a 1.0 mm screen. The ground samples were well-mixed and used for scan of NIRS spectral data and analyzed the content of oil and its fatty acids by standard methods.
Fatty acid content analysis
The oil content was determined by auto-soxhlet method with Buchi B-811 (Switzerland) extracted system. Two grams of each ground sample were extracted by hexane for 2 hours, preheated for ten minutes, and then dried 2 hours at 105°C. This condition was confirmed by preconditioning experiment (data not shown). The moisture content was analyzed by oven-dry method with 105°C for 2 hours and then oil content was converted to dry matter base. Fatty acid methyl esters (FAMEs) were prepared from total oils by acid-catalyzed trans-esterification as described by Christie (2003). Oil (1 mg) was re-suspended in 1 ml toluene, and then 2 ml of methanolic H2SO4 (1% v/v) was added. The reaction mixture was heated at 100°C for 1 hour, and 3 ml of H2O with 2 ml of hexane was used to extract the FAMEs. The fatty acid content were analyzed from FAMEs by gas chromatography (Agilent 7890A, USA) with a HP-FFAP capillary column (30 m × 0.318 mm, 25 μm). The oven temperature was kept 150°C for 1min, and increased to 230°C and kept for 1min, and finally to 240°C for 2 min. The temperatures of both injector and detector were 260°C. The flow rate of N2 carrier gas was 1ml/min, the injection volume was 1μl, and the split ratio was 50:1. The percentage of fatty acid was calculated by standard values of peak areas of C16:0, C18:0, C18:1, C18:2, C20:0, C20:1, and C22:0.
Scanning and pretreatment of NIRS spectra
The spectra in the visible-near infrared region were measured on a NIR System Model 6500 (Silver Springs, MD) monochrometer near infrared reflectance spectrophotometer by using a standard cell cup. The NIRS spectral data were recorded between 400 nm and 2500 nm at 2-nm intervals and stored as the reciprocal logarithm (log 1/R) of the reflected energy. NIRS instrument control as well as all graphics and NIRS specific calculations were all performed with the software package WinISI (version 1.02a) by Infrasoft International (PortMatilda, USA). In WinsISI software package, two programs, Center and Select, were used to screen samples for spectral outliers and to choose samples that represented 329 peanut samples. The Center program defined spectral boundaries that eliminated outliers, defined as having a maximum standardized Malalanobis distance (H-distance) of 3.0 from the samples mean, and the Select program eliminated samples with similar spectra and one validation set (102 samples) were randomly selected from the log 1/R spectra of 329 peanut germplasm by method of Choung (2001).
Calibration and validation
The NIRS calibration equations for fatty acid contents were developed for ground seeds of peanut calibration sample set using the WinISI program Calibrate with the MPLS (Modified Partial Least Squares) regression of 3 different derivative math treatment (log 1/R, D1log 1/R and D2log 1/R). The MPLS regression method is used better accuracy than the PLS (Partial Least Squares) and MLR (Multiple Linear Regression). The mathematical treatments using in the 2, 8, 6, 1 (the first number is the second derivative of log 1/R, the second number is the gap in data points over which the derivative was calculated, the third and fourth denote the number of average data points that are curved to smooth spectrum) (Shenk and Westerhaus, 1991). The “SNV-D” (Standard Normal Variate and Detrend) was implemented for scatter correction (Shenk and Westehaus, 1991). And the wavelengths at every 2 nm across the entire visible (408~1092 nm) plus near infrared (1108~2492 nm) spectrum were used for calibrations. A trimmed spectrum including only the near infrared range was tested against the entire spectrum. The SEC (Standard Error of Calibration), R2 (Coefficient of determination), SECV (Standard Error Cross-Validation) and/or 1-VR (one minus the ratio of unexplained variance to total variance) statistics were used to select the best calibration equation (Windham et al., 1989).
The fatty acid NIRS equation of ground peanut seeds was monitored with the WinISI program Monitor, using the validation set of 102 samples. The SEP (Standard Error of Prediction), R2 , bias, standard deviation of residual and SEP/Mean (Standard Error of Prediction per Mean) statistics were analyzed to determine the accuracy of prediction (Windham et al., 1989). The 102 validation samples had the standardized H-distance of 3.0 or less from the mean of the calibration samples set.
RESULTS AND DISCUSSION
Oil, fatty acid contents and NIRS spectra
In the previous studies, oil contents of peanut was reported that the peanut cultivars shell in Pakistan was ranged 49.8% to 53.0% (Hassan and Ahmed, 2012) and the peanut seeds was ranged 48% to 50% (Janila et al., 2013). In this study, the mean oil contents of total peanut sample sets were 48.4%, ranged 37.7% to 56.0%, with a standard deviation of 2.32% by autosoxhlet system (Table 1). Oil contents of peanut were similar to the previous results.
Table 1.
The content of oil of peanut seeds used in this experiment.
| Sample accession | Oil content (%) | |||
|---|---|---|---|---|
| Highest | Lowest | Mean | SD | |
| 329 | 56.0 | 37.7 | 48.4 | 2.32 |
The descriptive statistics including mean, range, and standard deviation (SD) for individual fatty acid composition for ground peanut samples used in the calibration (227 accessions) and validation (102 accessions) sets are shown in Table 2. Each reference value of fatty acid composition in a calibration set was similar to those in the validation sample set. Mean value of individual fatty acid composition was 9.4% palmitic acid ranged 5.4 to 13.1%, 3.1% stearic acid ranged 1.6 to 7.3%, 51.1% oleic acid ranged 36.7 to 77.1%, 31.8% linoleic acid ranged 7.1 to 42.7%, 1.6% arachidic acid ranged 1.0 to 2.7%, 1.2% eicosenoic acid ranged 0.5 to 2.7%, and 2.7% behenic acid ranged 2.0 to 4.8% in the calibration set, showing similar values to those in the validation set. The oleic acid and linoleic acids were main fatty acids and had widely differed. Previous reporters suggested that sufficient variation exist among the samples to develop useful NIRS equation (Rinne et al., 1975; Hilliard and Daynard, 1976).
Table 2.
Laboratory reference value statistics of fatty acid composition based on ground peanut samples used in both calibration and validation.
The log (1/R) spectra of the ground peanut samples and high and low compositions of oleic acid were shown in Fig. 1. The arrows of Fig. 1 mean irrelevant content and simple absorption spectrum. The D2log (1/R) spectra and mean standard deviation spectrum of calibration samples that were obtained by using the entire wavelength range of 400~2500 nm. Several high standard deviation peaks about 1208, 1496, 1724, and 2308 nm were related to hydrocarbon (-CH) in NIR region. Those peaks act to the NIRS calibration of fatty acids (Kim et al., 2007a).
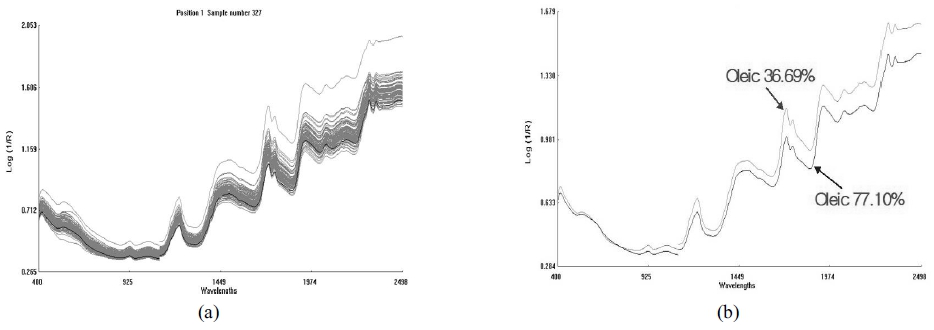
Calibration and validation analysis of fatty acid composition
The NIRS equations using MPLS method of ground peanut fatty acid concentration were shown in Table 3. The difference of scatter correction method, wavelength and math treatment effect did not highly improve the MPLS model performance, but the optimal equation condition was obtained at 2, 8, 6, 1 (2nd derivative, 8 nm gap, 6 points smoothing and 1 point second smoothing) math treatment condition with SNV-D scatter correction method and entire spectrum (Table 3). The mathematical treatments using in the 2, 8, 6, 1 refers to the first number is the second derivative of log 1/R, the second number is the gap in data points over which the derivative was calculated, the third and fourth denote the number of average data points that are curved to smooth spectrum (Shenk and Westerhaus, 1991). In the difference of regression method with same 2, 8, 6, 1 math treatment and SNV-D scatter correction, the equation of MPLS method was showed the lowest SEC and the highest R2 among other model (Table 3).
Table 3.
Comparison on the statistics of fatty acid concentration calibration and validation results with MPLS conditions.
One important criterion for evaluating NIRS equations involves the test of prediction accuracy with unknown samples. Validation samples set allows NIRS equation to be validated for prediction accuracy based on random samples not used in calibration sample set (Pazdernik et al., 1997). Based on the SEP, R2 , bias, residual of standard deviation and SEP/Mean, the optimal equation using MPLS method equation (2, 8, 6, 1; SNV-D; 400~2500 nm) was well predicting the content of oleic (R2 =0.971) and linoleic (R2 =0.976) acid of validation sample set (Table 3, Fig. 2, Fig. 3). Minor contents such as palmitic, stearic, arachidic, eicosenoic, and behenic acid showed less relationship (R2 ) owing to narrow variation in sample set.
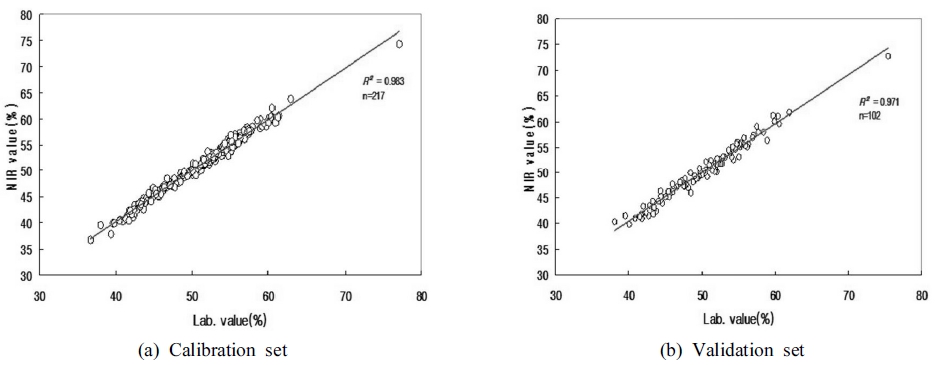
Fig. 2
Relationship between GC analysis and the prediction of oleic acid content from peanut sample used in both calibration and validation.The right panel of Fig. 2 and 3 demonstrates the accuracy for oleic and linoleic acid equation in the ground peanut seeds on the basis of the relationships of oleic and linoleic acid value between the actual calculation from GC analysis and the prediction from the NIRS. This result indicate that the NIRS analysis can be used as mass screening method to quickly evaluate a number of peanut breeding lines for high oleic acid.
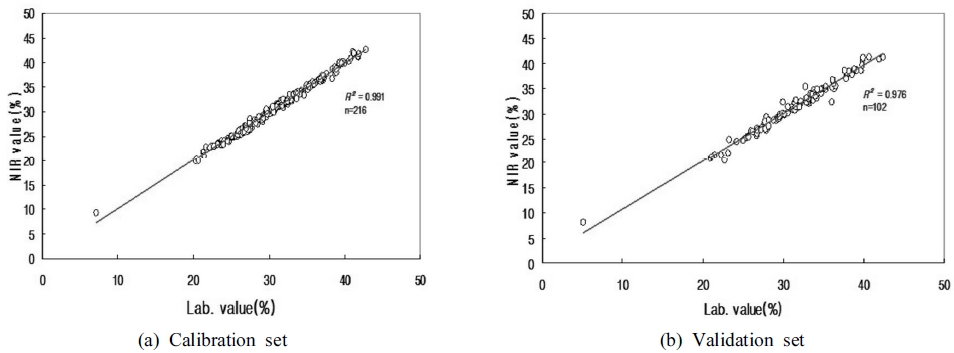
Fig. 3
Relationship between GC analysis and the prediction of linoleic acid content from peanut sample used in both calibration and validation.The NIRS method has an advantage rapid analytical time, no sample consumption and not required sample pretreatment. In this study, NIRS method to satisfy the validation can be applied to the quantification of oleic acid and linoleic acid. Further research should develop the equations for the non-destructive whole seed and one-seed, that can select one generation ahead.