

INTRODUCTION
MATERIALS AND METHODS
Estimation of cultivation characteristics and cultivation limits based on certified seed supply data
Estimation of cultivation characteristics, cultivation limits, and suitable cultivation areas based on field surveys of wheat-growing farms
RESULTS
Analysis of the spatial characteristics of wheat certified seed supply and variety distribution
Analysis of regional characteristics of wheat variety distribution, sowing period, and yield based on farm survey data
Spatial distribution analysis of crop cultivation limits and suitable areas based on farm survey data
DISCUSSION
CONCLUSIONS
INTRODUCTION
Wheat (Triticum aestivum L.) is one of the world’s most important food crops and its significance has been increasingly highlighted in Korea from the perspective of food security and self-sufficiency. More importantly, Korea’s food supply system as one of the biggest wheat importers has been repeatedly exposed to structural vulnerabilities characterized by recurrent disruptions in international grain markets, growing reliance on imports and exogenously disruptive weather events (Hochman et al., 2017; RDA, 2020). Consequently, increasing the domestic wheat production potential and creating stability in its cultivation have become important national problems. In this context, the government has made a series of policy attempts to stimulate the area in which wheat is cultivated, including enhancing certified seed supply, promoting local varieties and disseminating mechanized cultivation techniques (Kim et al., 2018). As a result, as of 2024, certified seeds are being supplied to most cities and counties nationwide, and wheat cultivation has administratively entered a nationwide phase. Notably, wheat farming is now spreading even to areas where cultivation was previously difficult, such as the central inland and northern Gangwon regions. This reflects how rising winter temperatures due to recent climate change are improving the overwintering stability of wheat and extending the northern limit of feasible cultivation (IPCC, 2021; KMA, 2022; Yanagi, 2024).
However, whether this expansion in production is translating into stable harvests or not probably depends on the region. In Korea, a north-south temperature gradient is clear with differences in soil conditions and precipitation and sunlight hours by region. Consequently, for the same variety, variation in both growth response and productivity may be observed. Especially for wheat, a winter crop, factors such as minimum winter temperatures and occurrences of cold damage have significant impacts, with low-temperature stress causing damage to the growing points, reduced tillering, and delayed heading, all of which can lead to reduced yields (Farooq et al., 2011; Hasanuzzaman et al., 2019; Limin & Fowler, 2006; Noctor et al., 2012). In warmer regions, increased growth durations and stable tillering and grain filling are generally associated with relatively high productivity (Liu & Finley, 2016). Additionally, recent expansion of wheat cultivation has increased the need to evaluate not only the extent of cultivation expansion but also the actual stability and reliability of production at the farm level. Although certified seed distribution can indicate the expansion of wheat cultivation, it does not necessarily guarantee stable production under diverse regional and farm conditions. Therefore, analyses based solely on seed supply data may not fully reflect actual cultivation performance. A more comprehensive approach is needed that integrates certified seed distribution records with on-farm cultivation information, including sowing practices, sowing dates, cultivar selection, and yield performance. Such an integrated analysis can provide a more reliable assessment of regional cultivation suitability and production stability. This spatial perspective has been emphasized based on its importance to assessment of suitability and marginal lands for crops. Space-based analysis using GIS (geographic information system) displays clear visualization of spatial distribution of cultivated areas and can provide a more reliable assessment of cultivation potential by considering environmental parameters including temperature, altitude and latitude (FAO, 1976; FAO, 2019; Radočaj & Jurišić, 2022). Specifically, the setting of cropping limits according to localized seed supply regions is important as a field based empirical response. Such spatial analysis not only enables us to evaluate whether cultivated areas are expanding, but offers critical underpinning data for future planning and policy formation.
Moreover, Korean wheat production still has a small number of varieties and management practices determined locally by environment. Regional distribution and proportions for the cultivation of varieties will give indications of varietal suitability and management, providing a context for future variety development and policies around seed distribution. Therefore, certified seed supply data in 2023 and 2024 was combined with farm survey data based on wheat cultivation in Korea from a study conducted in 2024 and 2025 to comprehensively elucidate the spatial distribution, varietal composition, sowing timings and yield characteristics of wheat. More specifically, the cultivation sectors were subdivided in G1 capacity and G2 together with an additional optional model G3 conditional on temperature conditions for comparing most distinct regional cultivation characteristics to separate marginal zones from optimal ones. This study aims to systematically separate the areas suitable and limited for wheat cultivation in Korea through field-based data gathered at farm sites with spatial analysis, thus producing essential information necessary to accompany changes in area of potential growers and stable production policy against progressive ecosystem service and climate change.
MATERIALS AND METHODS
Estimation of cultivation characteristics and cultivation limits based on certified seed supply data
This study analyzed cultivation area distribution, cultivation limit lines, cultivated area, and characteristics of cultivated varieties using certified seed supply data distributed to farms in 2023 and 2024, reflecting certified seed requests submitted by farms to the Korea Seed & Variety Service. The seed supply data included information on supply quantity, number of recipient farms, and the varieties distributed at the city and county levels. In 2023, seeds were supplied to 325 farms in 120 cities and counties nationwide, and in 2024, to 263 farms in 117 cities and counties.
The distribution of cultivation areas was visualized on a map by plotting the latitude and longitude coordinates of the regions where seeds were supplied each year, allowing spatial distribution analysis and estimation of areas suitable for wheat cultivation. The cultivation limit lines were determined by connecting the outermost points of seed supply regions, and geographic limiting factors were analyzed by considering both latitude and altitude of these areas. The cultivated area was estimated based on the amount of seeds supplied in each region (in kilograms or tons).
Analysis of distributed cultivars was conducted to evaluate varietal diversity and the regional concentration of individual cultivars in each region. In addition, the GIS-based tool QGIS was used to comprehensively visualize, by year and by variety, the supply status, cultivation area distribution, cultivation limits, and regional distribution of certified varieties.
Estimation of cultivation characteristics, cultivation limits, and suitable cultivation areas based on field surveys of wheat-growing farms
This study conducted field surveys targeting wheat farms during 2024 and 2025. The surveys targeted 62 farms in 2024 and 123 farms in 2025, with the surveyed farms grouped into three regional clusters—G1, G2, and G3—based on the climatic characteristics of the cultivation areas. The regional classification criteria were based on the average minimum temperature in January over the most recent five years, with G1, G2, and G3 corresponding to approximately -10°C, -7 to -8°C, and -3 to -4°C, respectively.
The surveys were conducted using both in-field visits and telephone interviews with standardized questionnaires for the collection of data. Important survey items were cultivated area, cultivated varieties and the types of certified seed use, sowing period and yield: explanations were provided in these cases to correctly inform the response.
Data collected were organized by year and regional group, and used to evaluate the state of certified seed use, cultivation characteristics per variety, sowing period, and yield. In addition, yield data were compared and analyzed by regional group in order to assess the cultivation limits as well as areas where wheat could be produced.
RESULTS
Analysis of the spatial characteristics of wheat certified seed supply and variety distribution
Analysis of the wheat certified seed supply status for 2023 and 2024 revealed that, in both years, certified seed was distributed nationwide, confirming that wheat cultivation actually took place in most cities and counties across the country (Fig. 1). In 2023, certified seed was supplied to 325 farms in 120 cities and counties, and in 2024, to 263 farms in 117 cities and counties. The cultivation boundary based on certified seed supply showed a similar pattern in both years; however, in 2024, cultivation further expanded to northern regions such as Cheorwon, Hwacheon, and Yangyang in Gangwon Province, indicating an even greater nationwide cultivation potential. The comparison of supply volume distribution indicates that the southern region, particularly Jeonnam and Jeonbuk, has continuously served as a key supply center. In 2023, areas with high seed distribution intensity (≥10,000 kg) were mainly concentrated along the southwestern coast of Jeonnam. In 2024, this concentration slightly decreased, while areas with moderate seed distribution intensity (2,000-10,000 kg) expanded nationwide.
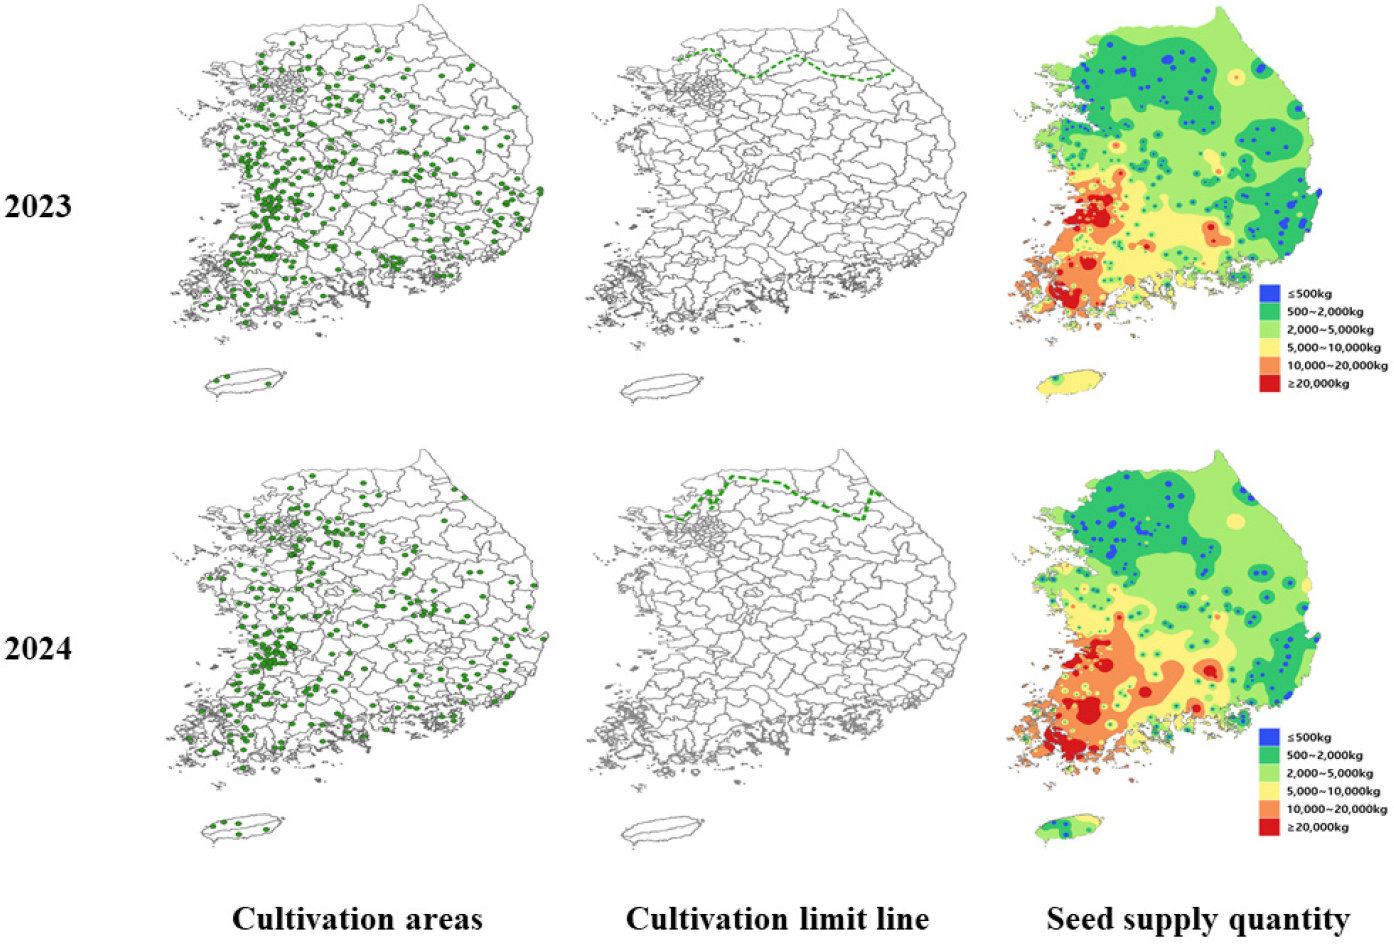
In particular, supply volumes by region were seen to be more diverse in Gyeongnam and Chungnam, thus signifying the spatial spread of the cultivation space. These findings indicate that wheat is expanding away from its centers of origin into areas near the originally cultivated regions. The southern regions around Jeonnam and Jeonbuk remained the main supply centers when comparing the distribution of supply volumes. Areas with a high volume of supply (≥10,000 kg) in 2023 were mainly distributed along the southwestern coast of Jeonnam and while those types of areas in 2024 showed somewhat wider dispersion compared to before, medium supply volume areas (2,000- 10,000 kg) were distributed nationwide. It is also achieved a spatial expansion of cultivation areas, as indicated by the notable increase in distribution of supply volumes in Gyeongnam and Chungnam. This evidence indicates a gradual expansion of wheat cultivation from the long-established areas of production to surrounding areas.
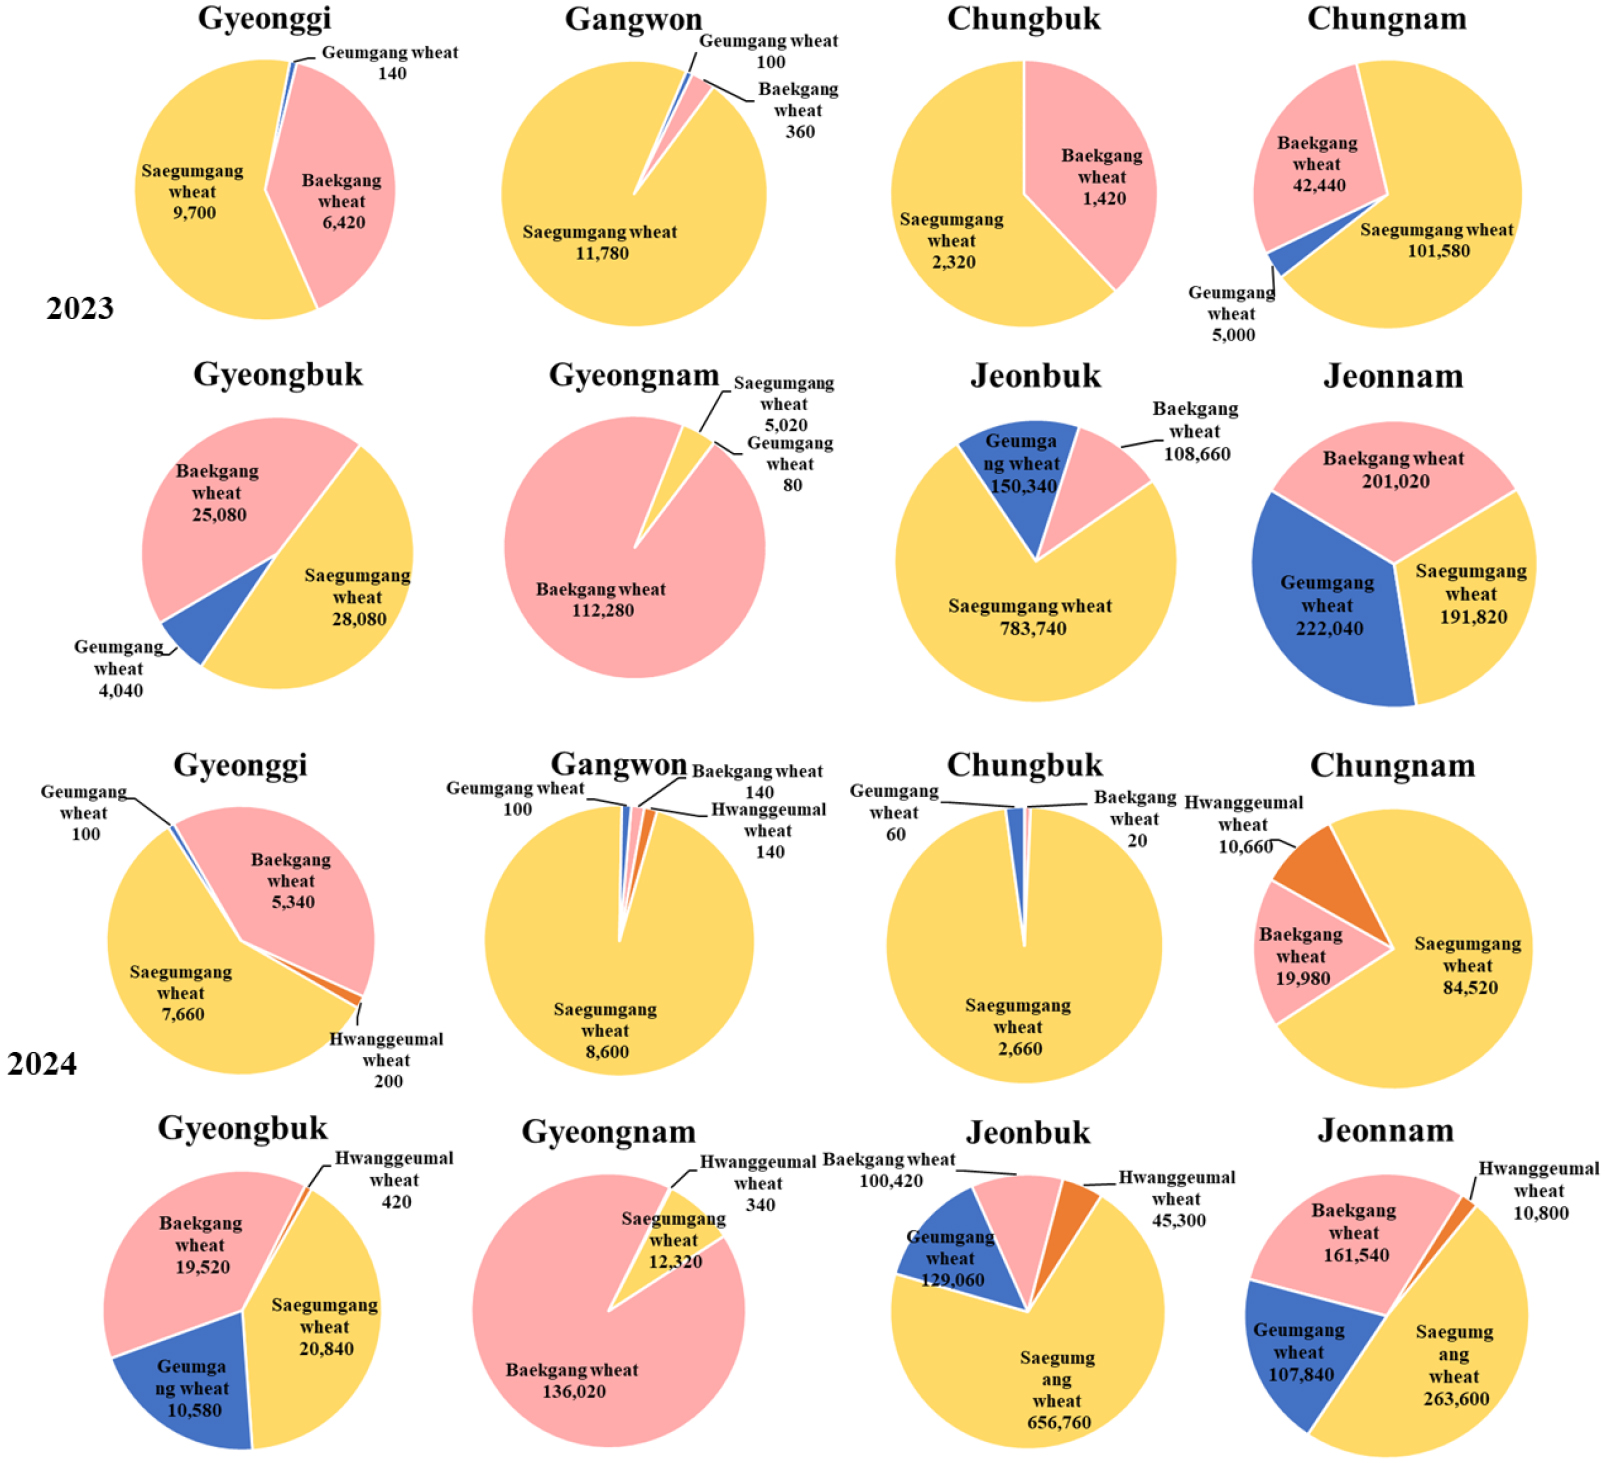
Comparisons of the distribution of certified seed varieties for wheat available in 2023 and 2024 indicated that the variety ‘Saegumgang’ had the largest share on a national scale in both years (Fig. 2). Specifically, the total of cultivation area for Saegumgang variety is found to be almost entirely located in Jeonbuk and Chungnam indicating that this variety is distributed mainly as expected. It was revealed that the regional cultivation characteristics, such as high share of ‘Baekgang’ variety in parts of Gyeongnam, Gyeongbuk and Jeonnam regions. In the Baekgang variety, excessive identification with regional variety concentration was observed in Gyeongnam. The ‘Geumgang’ variety was planted small but less overall, but a relatively high share in southern regions (Jeonnam and Jeonbuk) indicating its use as a supplementary variety. Although the total percentage of each variety was consistent between years, varietal diversity increased in 2024 with certain areas displaying a larger share of Geumgang and Baekgang. Geumgang share had a high growth rate in Jeonnam, which could facilitate varietal dispersion. The results indicated that, Saegumgang was still the forerunner of domestic wheat cultivation, and other varieties among these might be applying a selective expansion strategy depending on their growing environment and regional cultivar strategies.
Analysis of regional characteristics of wheat variety distribution, sowing period, and yield based on farm survey data
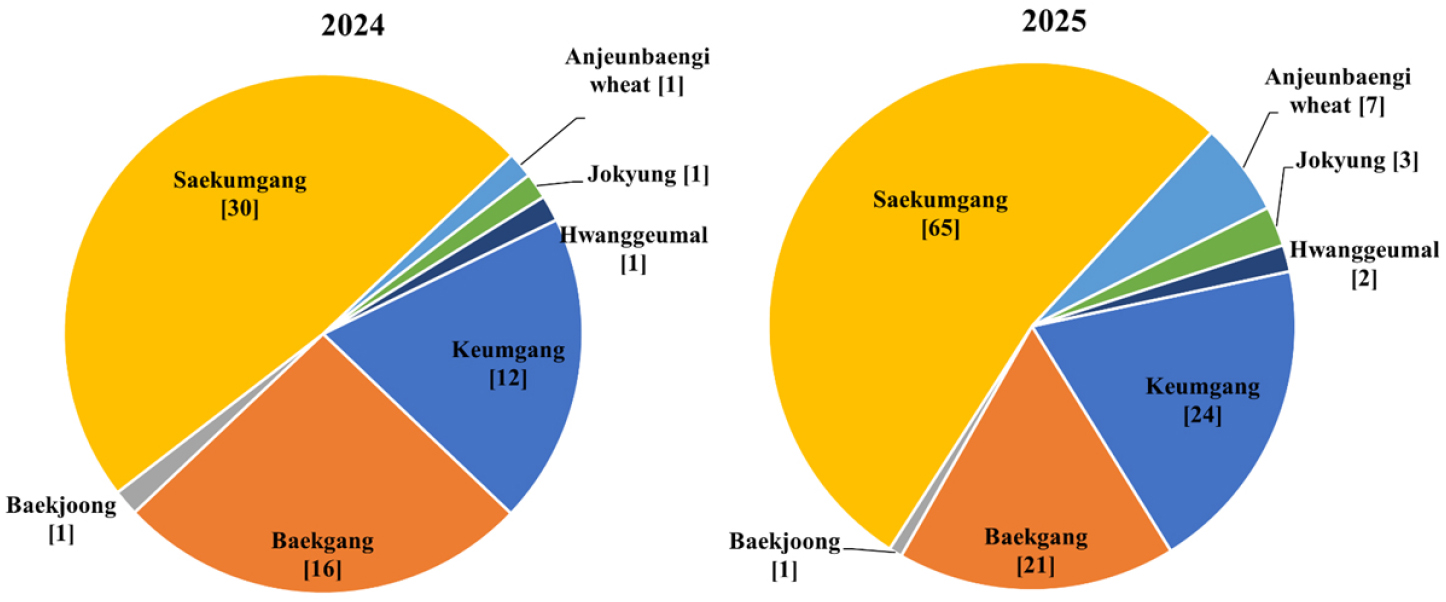
In 2024, wheat cultivation survey examining the diversity of varieties, the ‘Saekumgang’ had the largest share of over 50% of all cultivated areas (Fig. 3). Subsequently, the Baekgang’ and ‘Keumgang’ cultivars were identified as representative continental distribute species keeping comparatively low but added stabilization cultivation rates. In contrast, other cultivars such as ‘Jeongpyeong’, ‘Jokyung’ and ‘Hwanggeumal’ had very low shares representing limited cropping. In general, 2024 was characterized by a pronounced monoculture dominated by the Saekumgang cultivar. In 2025, ‘Saekumgang’ yield remained highest among cultivation share although there is a small reduction compared to previous year. On the other hand, shares of ‘Keumgang’ and ‘Baekgang’re increased, indicating a trend for less concentrated distribution among the varieties. Additionally, cultivation of ‘Anjeunbaengi’ and ‘Jokyung’ increased slightly, inferring that varietal diversification may have progressed. However, the general cultivation structure still remained focused on Saekumgang. Meanwhile, the shares of ‘Keumgang’ and ‘Baekgang’, which are fairly evenly distributed among the varieties, were increased. Moreover, the yield of the other varieties ‘Anjeunbaengi’ and ‘Jokyung’ was slightly increased that would mean making diversity in varietal were expanded. However, Saekumgang continued to be the focus of the entire production system. From 2024 to 2025, Saekumgang continued to dominate but the modest rise in numbers for some other varieties suggested a gradual increase in varietal diversity. The use rate of certified distributed seeds remained high at over 80% in both years, indicating a strong dependence of farms on certified seeds (data not shown). The average cultivation area per farm was 2.6 ha in 2024 and 2.8 ha in 2025.
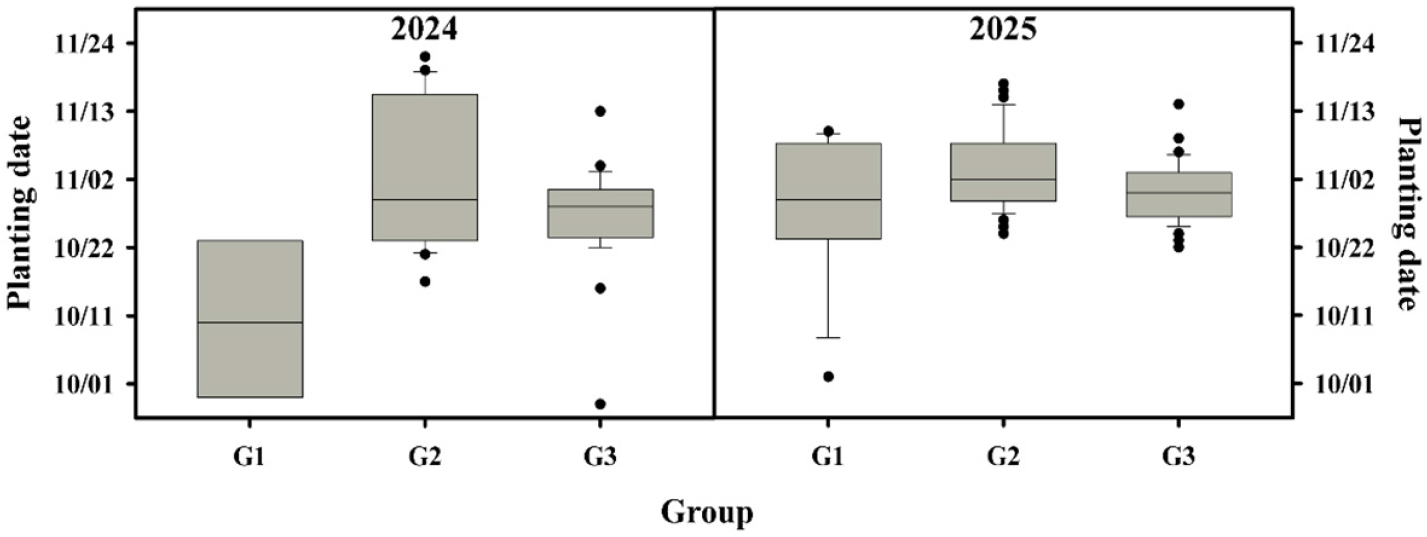
A comparison of sowing periods by group for 2024 and 2025 was conducted separating the seeds into regional clusters (G1, G2, G3) in both years. In general, sowing was earliest in the G1 region and later in the G2 and G3 regions (Fig. 4). Sowing periods in G1 were divided between early and mid-October, while for G2 they were the latest from the end of October to mid-November in 2024. G3 sowing occurred across the end of October and early November, being a little earlier than G2. Particularly in G2, sowing times varied widely as differences in sowing timing were more pronounced within this region. In 2025, sowing was generally later than in 2024 with G1 sowings occurring in mid to late October; and G2 and G3 receiving mainly between the end of October into early November. Moreover, for 2025 inter-group differences in sowing period declined, indicating a convergence of sowing timing across regions. These findings imply that the regional differences in optimal sowing periods are dependent on temperature conditions and cultivation environment, which is also changed every year.
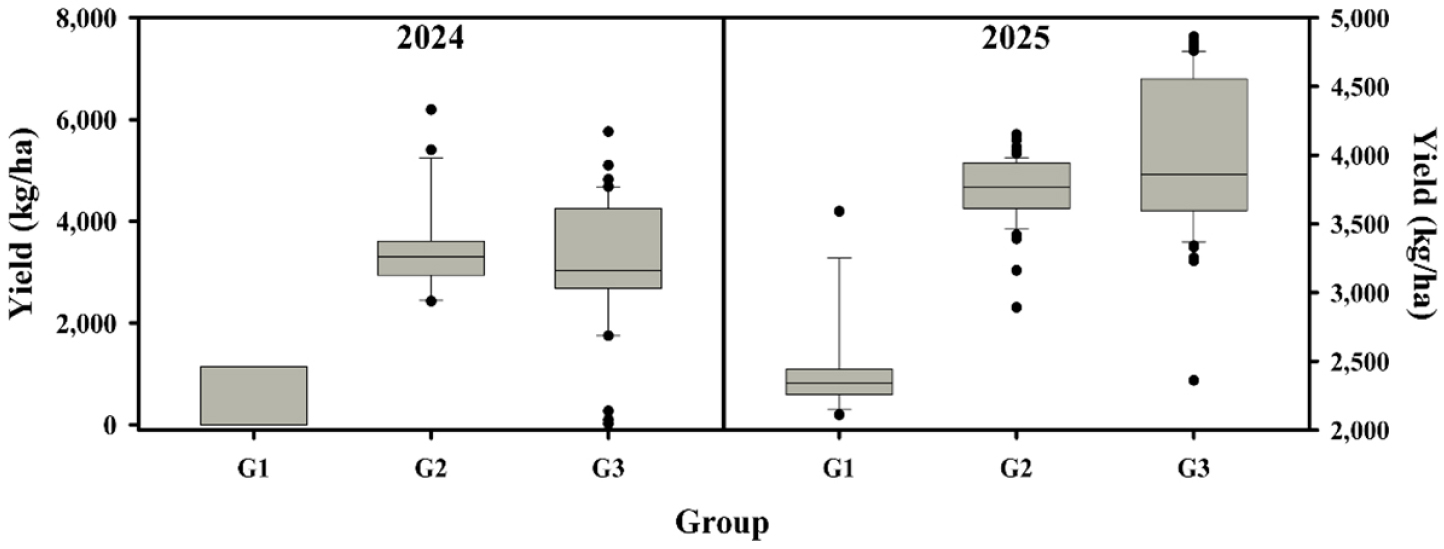
A comparison of yields grouped by region group (G1, G2, G3) for 2024 and 2025 showed that there were marked regional differences in both years (Fig. 5). The overall high yields reflected G2 and G3 regions on average, with rather low average yields from the G1 region. As yields for G2 were consistent across years, ranging from about 3,000-3,500 kg/ha in 2024 however average yields for G3 was equivalent or slightly greater yet had substantial variability. In contrast, G1 was predominantly lower and had some very low production farms. The general trend was for 2025 yields to be higher, with G3 being the highest (∼4,000-4,500 kg/ha). G2 also increased yields year over year while maintaining productivity relatively well. G1 remained at the bottom of the pile when it came to yields, although a few farms achieved marginal gains. These results indicate that growing environment temperature can greatly impact yield and a relatively warm regions (G2, G3) suitable for wheat production.
Spatial distribution analysis of crop cultivation limits and suitable areas based on farm survey data
This study spatially analyzed the cultivable range of specific crops based on the 2024 and 2025 farm survey data and categorized these areas into cultivation limits (G1) and suitable cultivation zones (G2, G3) (Fig. 6). First, the cultivation limit (G1) was found to form in the central and northern parts of the Korean Peninsula, centering on northern Gyeonggi Province and border areas. In these regions, crop growth and overwintering are restricted due to low winter temperatures and frequent cold damage, making it difficult to ensure continuous cultivation. Therefore, this area functions as the practical northern boundary of the cultivable range.
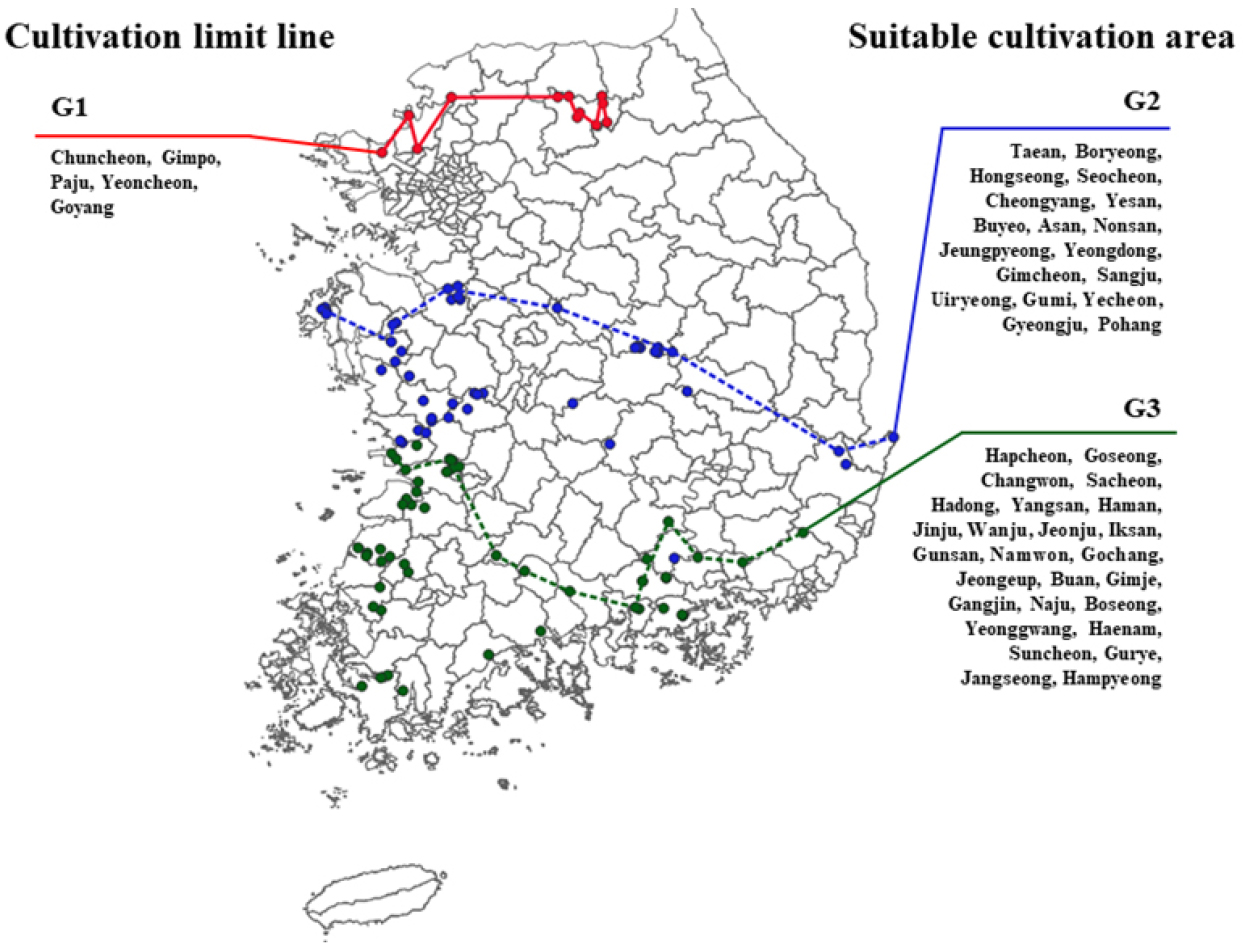
Next, the conditionally cultivable area (G2) was identified as being widely distributed, mainly across the inland areas of Chungcheong and North Gyeongsang Provinces. In these regions, cultivation itself is possible, but production stability is greatly affected by climate variability. In particular, fluctuations in yield occur depending on annual changes in temperature and precipitation, and stable production requires supplementary management, such as greenhouse cultivation or selecting adaptive varieties.
Finally, the most suitable cultivation area (G3) was found to be concentrated in the southern coastal and southern inland regions. These areas offer favorable environments for crop cultivation, thanks to their warm climate and relatively long growing season, and also exhibit high actual cultivation density. This indicates that these regions function as the core cultivation zones where stable production is possible.
In summary, cultivation potential shows a gradual spatial increase from north to south, which is interpreted to be closely related to temperature conditions. Furthermore, the G2 zones are considered transitional areas with the potential to become suitable cultivation zones (G3) in the future due to climate change.
DISCUSSION
This study comprehensively analyzed the supply of certified wheat seeds, variety distribution, sowing periods and yields, and suitable cultivation areas for 2023-2025 to clarify the spatial structure and patterns of change in domestic wheat cultivation. First, the analysis of the supply of certified seeds revealed a nationwide spread of wheat cultivation, showing that wheat farming in Korea is gradually expanding from its previous regional focus to a nationwide scale. In particular, in 2024, the cultivation area expanded to the northern regions of Gangwon Province, confirming a northward shift in the cultivable range. This is interpreted as an effect of recent climate change, specifically the rise in winter temperatures and the extension of the growing period, and similar northward shifts of the cultivation limit have been reported in previous studies (Choi et al. 2013; Fei et al., 2017; KMA, 2022; Park et al., 2022). Distribution pattern of certified seed provisions also indicated that while the sector was still concentrated in southern areas, it was encroaching into central and some northern regions as well. This is likely the result of the expansion of policy-induced certified seed supplies and an increase in farmer participation, implying that wheat cultivation has now entered its nationwide phase in Korea.
A variety distribution analysis revealed that the ‘Saegumgang’ variety was still the most common. In particular, its high cultivation shares in Jeonbuk and Chungnam regions established it as a top certified wheat variety. On the other hand, both the ‘Geumgang’ and ‘Baekgang’ cultivars were cultivated on a smaller scale and mainly in specific regions. According to the 2023-2024 certified seed supply status, the certified for wheat cultivation is expanding in most cities and counties except for certain mountainous areas in Gangwon Province. In particular, rising winter temperatures associated with climate change have been identified as a major factor driving the northern expansion of wheat cultivation limits (KMA, 2022; Fei et al., 2017). This expansion is not just a simple climate-related effect, but when coupled with enhanced certified seed provision and enabling policy frameworks point to wheat as an emerging national crop from both institutional-administrative perspectives.
However, more than 80% of supplies were constituted of ‘Saegumgang’ cultivar in a monoculture establishment around cultivars. Although this structure may provide short-term benefits for the stability of yield and efficiency, it also entails long-term risk factors like vulnerability to large-scale crop loss from pests and diseases, reduced genetic diversity, or decreased adaptability to climate variability (Lee et al., 2019; Park et al., 2021). Moreover, as this study observed, increasing share of the ‘Baekgang’ and ‘Geumgang’ variety in certain areas suggests that farmers have diversified by variety for climate resilience and risk management purposes. Interpreted as a transitory phase prior to cultivation becoming established, it illustrates an opportunity for greater varietal diversity going forward. Thus, the development of region-specific wheat strain breeding which adapted to local climatic and growing environments and a cultivar diversification strategy based on diverse genetic resources are key to establish sustainable wheat production system. This finding is consistent with Hochman et al. (2017), who highlight the necessity for changes in cropping systems structure to address climate change. The analysis of sowing periods showed marked differences by region group (G1, G2, G3), which appear closely linked to temperature conditions. Especially in the G1 area, early sowing was interpreted as an adaptive strategy to secure a sufficient growing period under low temperature conditions. In contrast, later sowing was feasible in the G2 and G3 regions, related to their milder climates (Lee et al., 2015).
In terms of yield, G2 and G3 areas performed significantly better than G1 which confirms the importance of temperature and environment on yield formation. In particular, 2025 showed an overall increase in yield, which may reflect the influence of favorable weather conditions or improvements in cultivation techniques. Previously, increases in wheat yield have also been observed over milder climates (Asseng et al., 2015; Park et al., 2020). These trends were confirmed by analysis of cultivation limits and suitability. Low temperature and winter damage risks resulted in less stable cultivations of G1 types, whereas G3 cultivation benefited from a warmer climate and a long growing period which made it a core area of stability for wheat production. G2 was identified as a transition area that could become an appropriate growing region with climate change in the future.
In summary, Korea’s wheat cultivation has remained in a stable production structure centered in the south, but climate change and policy factors have gradually promoted northward expansion and diffusion. The varietal structure is also in a transitional phase, shifting from monoculture toward diversification.
CONCLUSIONS
This study conducts a systematic analysis of the structure and distribution of domestic certified wheat seed supply in terms of varietal composition, sowing area from 2023 to 2025 as well as their suitable cultivation areas classification with an aim to explore spatial characteristics and changing trends of domestic wheat. The results show that most counties and cities across the country are supplied with certified wheat seeds, the main cultivation areas remain at a focus in southern region but moving to a break of central and northern regions. In particular, the possible cultivation area has expanded northward and the cultivation can be done as north as northern Gangwon Province by 2024. As far as varietal distribution, for regions with ‘Saegumgang’ mainly distributed remain the hero cultivar but now a little more incidence of varieties including ‘Baekgang’ and ‘Geumgang’, thus ultimately it is on a right direction to be novel cultivars. This show varietal selection is applied to response changes in cultivation environments on a stable production base. Statistical analysis showed significant differences for sowing periods and yield between regional groups (G1, G2, G3), which were identified as warmer regions with latter sowing periods and higher yields. Region G1 is characterized by low yields and their high variability as expected in marginal cultivation regions, while production potential was stable for regions G2 and G3. The assessment on proper cultivation areas supported that the southern area (G3) is a core cultivation area where stable cultivation can still take place, as well as the central area (G2) which is assessed to be transitional with sufficient potential for future depending on climate change. On the other hand, northern region (G1) is still profitable and stable nursery area. In conclusion, domestic wheat cultivation is evaluated as transitional with maintained old-variety populous structure but also growth in area and varietal diversity. Overall, domestic wheat cultivation is evaluated as transitional with maintained old-variety populous structure but also growth in area and varietal diversity. In the long term, the identification of new suitable cultivation areas in climate-changed environments, increased varietal diversity and development of appropriate regional adaptation for cultivation approaches will all be necessary components to ensure a sustainable wheat production system.
