

INTRODUCTION
MATERIALS AND METHODS
Experimental field
Data acquisition by UAV
Image processing and data analysis
RESULTS
DISCUSSION
INTRODUCTION
Rice (Oryza sativa L.) is cultivated across a wide range of environmental conditions (Shrestha et al., 2020) and serves as one of the most important crops supporting the world’s growing population. However, lodging, characterized by the breaking or bending of stems, often limits grain yield and quality in rice production (Shrestha et al., 2008). Lodging, as seen in other crops, can be influenced by various abiotic factors such as soil temperature, CO2 levels, precipitation, deep water, and resource complementarities (Ishimaru et al., 2008; Zhang et al., 2014), as well as biotic factors like sheath blight and brown planthoppers (Wu et al., 2012; Elanchezhyan et al., 2020). Abiotic lodging typically occurs during the panicle initiation stage, and since the plant is not in a dead state, it continues its physiological activities such as photosynthesis. (Wu et al., 2022). In contrast, biotic lodging results in the destruction of the chlorophyll and a loss of photosynthetic capability, leading to reduced vigour and the occurrence of lodging (Ramli et al., 2018). Severe lodging typically leads to significant losses in both grain yield and quality, while also complicating harvest operations (Chauhan et al., 2019; Dahiya et al., 2018).
In recent years, remote sensing technology has emerged as a valuable tool for assessing crop lodging (Li et al., 2021). While satellite imagery and radar systems provide useful data, they have limitations in terms of resolution and sensitivity to confounding factors like soil conditions and crop stress (Khanal et al., 2020). Unmanned aerial vehicles (UAVs), on the other hand, offer a more flexible and cost-effective solution for smaller areas, capturing high-resolution imagery that provides insights into crop color and 3D structure (Jang et al., 2020). The detection of lodging regions using UAVs was conducted based on morphological traits resulting from relative height differences among the plants (Yang et al., 2020; Tan et al., 2021). However, a key challenge in current research is the inability to differentiate between abiotic and biotic causes of lodging, such as pest or disease-related factors. Overcoming this limitation would greatly improve the practical applications of remote sensing for crop management.
Smart agronomic practices, such as the use of lodging-resistant cultivars, appropriate fertilization, application of plant growth regulators, and chemical treatments, can reduce the risk of crop lodging (Liao et al., 2023). However, the combined effects of these strategies on both grain yield and lodging risk in rice paddies remain poorly understood. Identifying the specific causes of lodging could enhance the efficiency of these management approaches. Therefore, the present study aims to establish parameters for detecting lodging caused by both abiotic and biotic factors, specifically focusing on brown hopper-induced lodging, using UAV-acquired images.
MATERIALS AND METHODS
Experimental field
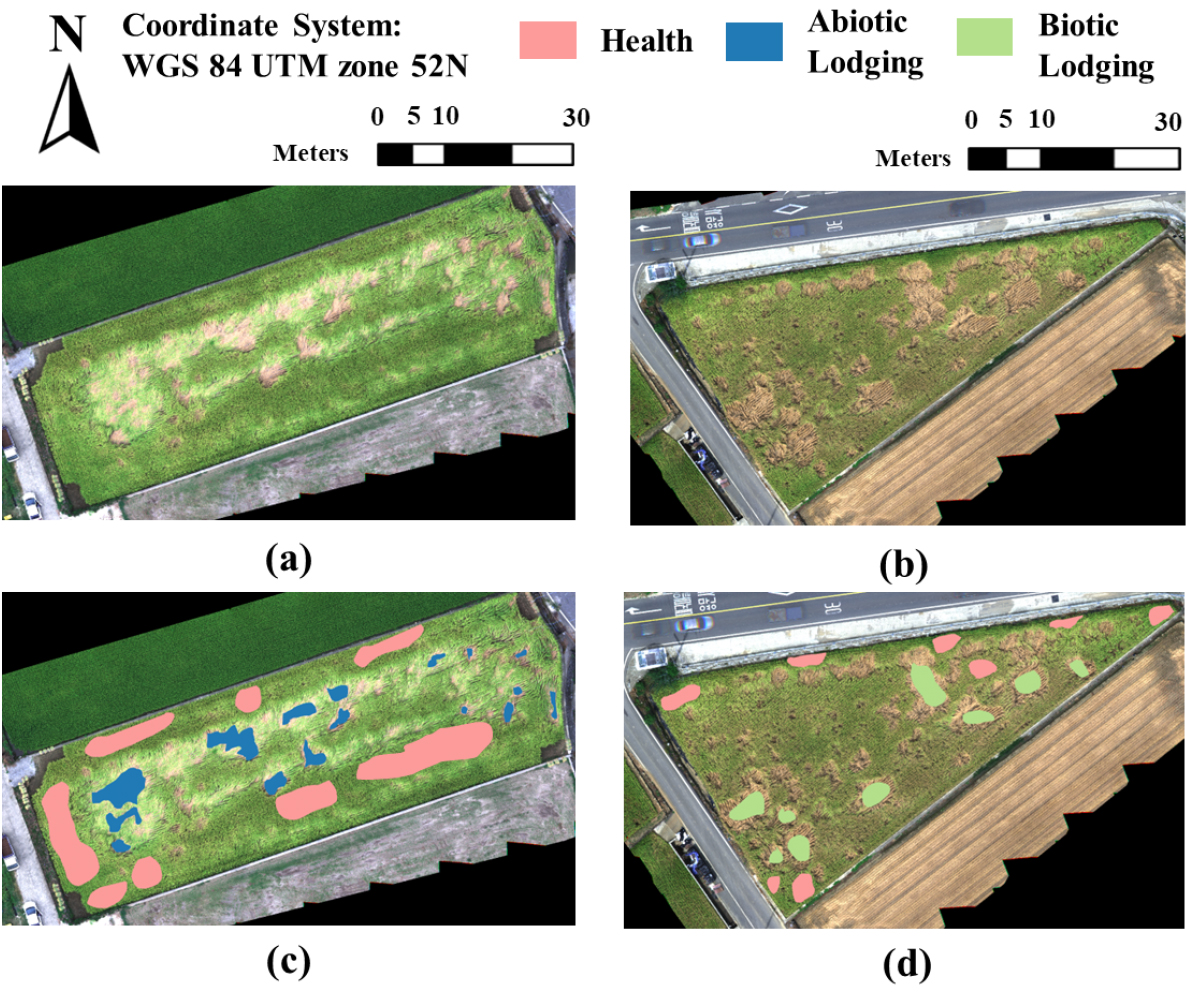
This experiment was conducted in two commercial rice fields in Gyeongsangnam-do, South Korea. One field is located in Pyeong-ri, Namhae-eup, and the other in Yongso-ri, Idong-myeon, about 10 km apart (Fig. 1). The rice field in Pyeong-ri has abiotic lodging partially distributed due to rainfall and wind during the monsoon season, while the rice field in Yongso-ri has biotic lodging partially distributed due to the infestation by brown grasshopper (Nilaparvata lugens). The areas of Pyeong-ri and Yongso-ri are 1,784 m2 and 1,253 m2, respectively, and the soil types are loamy sand and loam (Heuktoram, https://soil.rda.go.kr). The experimental region, Namhae experiences an average annual temperature of 16°C, and an annual precipitation of 1,600 mm.
Data acquisition by UAV
The experiment in the rice field utilized the DJI P4 multispectral UAV (Fig. 2). This UAV weighs 1,487 g at take-off and has an average flight duration of 30 minutes. Its imaging system consists of six 1/2.9-inch CMOS sensors, enabling simultaneous capture of RGB images via the visible camera and spectral data using a multispectral system. The multispectral system covers five spectral bands with the following ranges: Blue (B): 450 nm ± 16 nm, Green (G): 560 nm ± 16 nm, Red (R): 650 nm ± 16 nm, Red Edge (RE): 730 nm ± 16 nm, and Near-Infrared (NIR): 840 nm ± 26 nm.
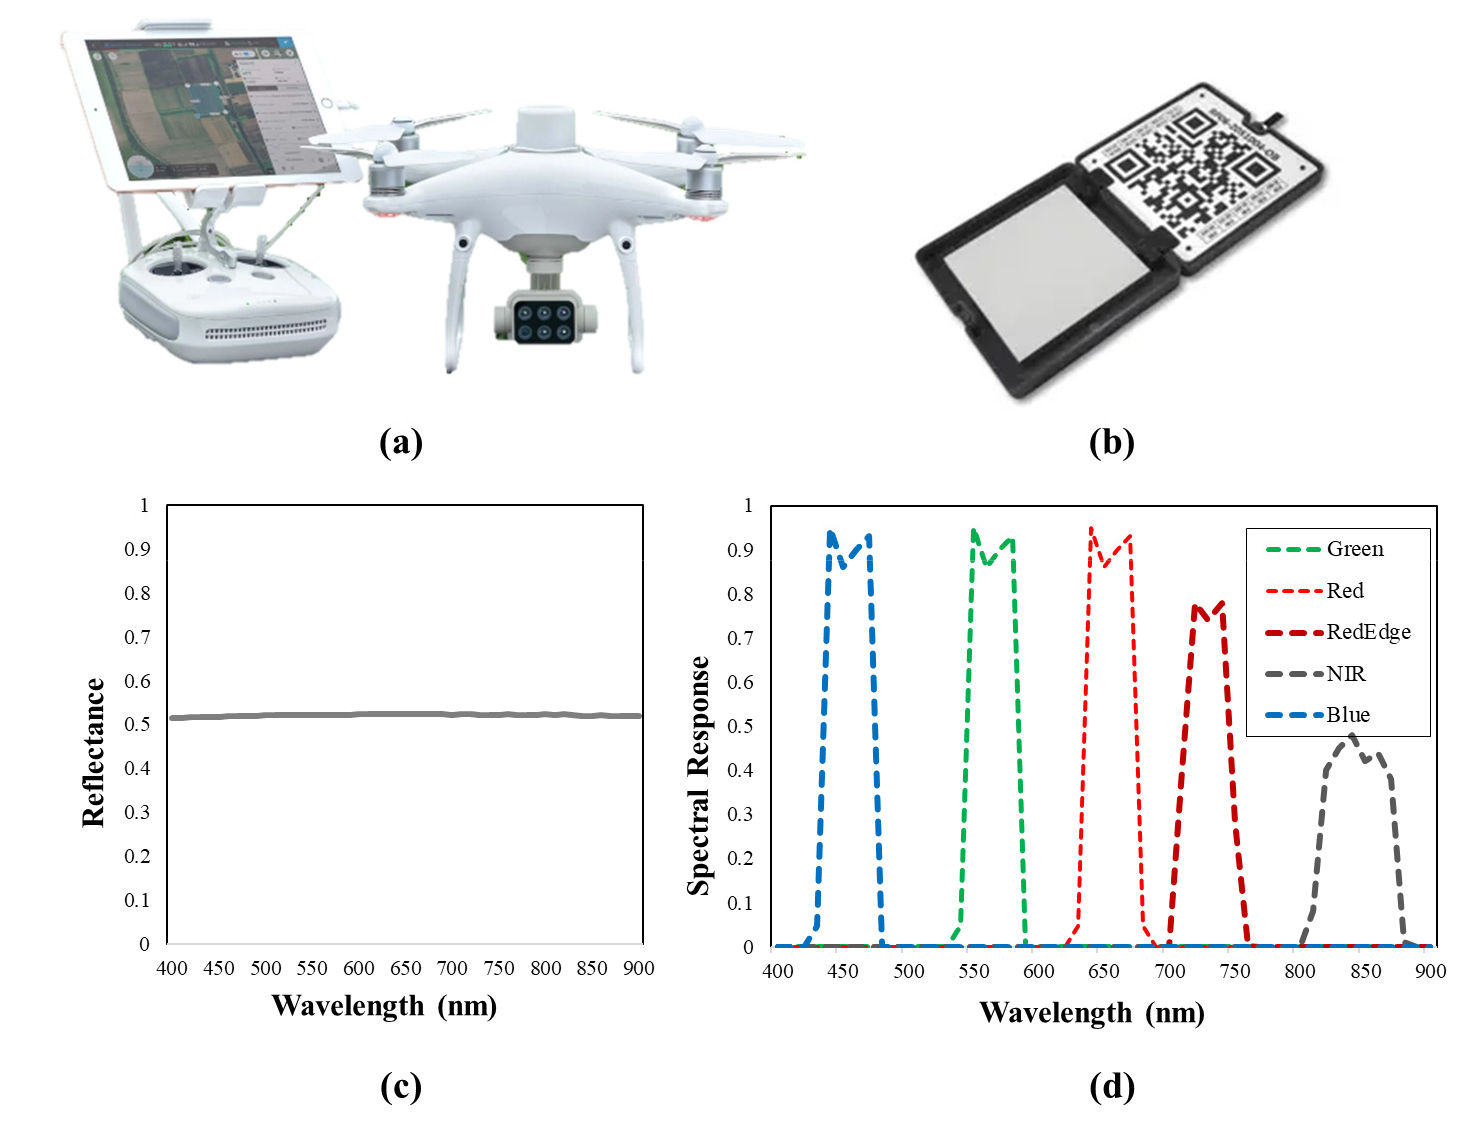
The UAV mission was executed using the GS Pro app (DJI, China) at an altitude of 20 m, with 80% overlap and side lap to ensure thorough coverage of the target field. Waypoints for the mission were established, and location data was recorded at each waypoint through camera triggers. The DJI P4 multispectral system, featuring real-time kinematic-global positioning system (RTK-GPS), provided positional accuracy within 5 cm, allowing for precise navigation along the predetermined waypoints. The flights were conducted at each rice field between 11:00 am and 1:00 pm. on September 2, 2024. Immediately after the each flight, a Calibrated Radiometric Panel (CRP, Micasense, USA) was captured in the ground for radiometric calibration to convert the sensor’s digital numbers into reflectance values (Fig. 3).
Image processing and data analysis
The mean reflectance values for each band of the multispectral sensor were calculated using the spectral response data from the UAV’s multispectral sensor and the reflectance data from the CRP supplied by the manufacturer, following the Equation 1 (Table 1). Pix4Dmapper Pro 3.0.17 (Pix4D SA, Lausanne, Switzerland) was employed to process the UAV’s overlapping images into reflectance maps for each spectral band. The “Radiometric Processing and Calibration” setting was configured to “Camera and Sun Irradiance” to ensure accurate correction using CRP images captured in ground. This radiometric calibration accounted for irradiance variations during the UAV flight, converting the multispectral digital numbers into accurate reflectance values (Wang, 2021).
Where denotes the calculated mean reflectance values of the CRP, refers to the standard reflectance spectrum of the CRP provided by the manufacturer, represents the spectral response of the image sensor, and 𝑘 indicates to one of the bands: Blue (B), Green (G), Red (R), Red Edge (RE), or Near-Infrared (NIR).
Table 1.
Average reflectance value of each spectral band on the calibrated radiometric panel used in this study.
| Spectral band | Mean reflectance value |
|
Blue (450 nm ± 16 nm) | 0.518 |
|
Green (560 nm ± 16 nm) | 0.522 |
|
Red (650 nm ± 16 nm) | 0.523 |
|
Red edge (730 nm ± 16 nm) | 0.523 |
|
Near-infrared (840 nm ± 26 nm) | 0.521 |
From the reflectance maps generated for the two fields, polygons were manually created for no lodging areas (H), areas affected by abiotic lodging due to natural disasters (AL), and areas affected by biotic lodging from brown grasshoppers (BL), as shown in Fig. 1. These polygons were then used as sample regions for H, AL, and BL.
Vegetation indices related to crop vigor and growth status, as shown in Table 2, were generated using the reflectance maps. Data was extracted from each generated vegetation index map using the sample polygons, and statistical comparisons were made among H, AL, and BL. The means and skewness of each dataset (H, AL, BL) was calculated and one way analysis of variance (ANOVA) was performed with Tukey HSD (P < 0.05) post hoc test for significant mean comparisons. All of statistical analysis was performed using scipy.stats module in Python.
Table 2.
Vegetation indices used in this study.
| Vegetation index | Formulation | Features | Reference |
|
Enhanced vegetation index (EVI) |
Crop growth status (Leaf area index, biomass) | (Qiao et al., 2019) | |
|
Excess green (EXG) |
Crop growth status (Leaf area index, biomass) | (Rossi, 2019) | |
|
Green normalized difference vegetation index (GNDVI) | Chlorophyll content (SPAD) | (Gitelson et al., 1996) | |
|
Green ratio vegetation index (GRVI) |
Crop growth status (biomass) | (Mandal et al., 2021) | |
|
Normalized difference red-edge index (NDRE) | Crop vigour | (Gitelson et al., 1994) | |
|
Normalized difference vegetation index (NDVI) |
Crop growth status and crop vigour | (Rouse et al., 1974) | |
|
Normalized green minus red difference index (NGRDI) | Nitrogen contents | (Choudhary et al., 2021) | |
|
Optic soil-adjusted vegetation index (OSAVI) |
Chlorophyll content, water status prediction, and plant stress identification | (Rondeaux et al., 1996) | |
|
Red-edge re-normalized difference vegetation index (RDVI) |
Crop grwoth status (Leaf area index, biomass) | (Roujean et al., 1995) | |
|
Visual atmospheric resistance index (VARI) |
Crop growth status (Leaf area index, plant height) | (Feng et al., 2022) |
RESULTS
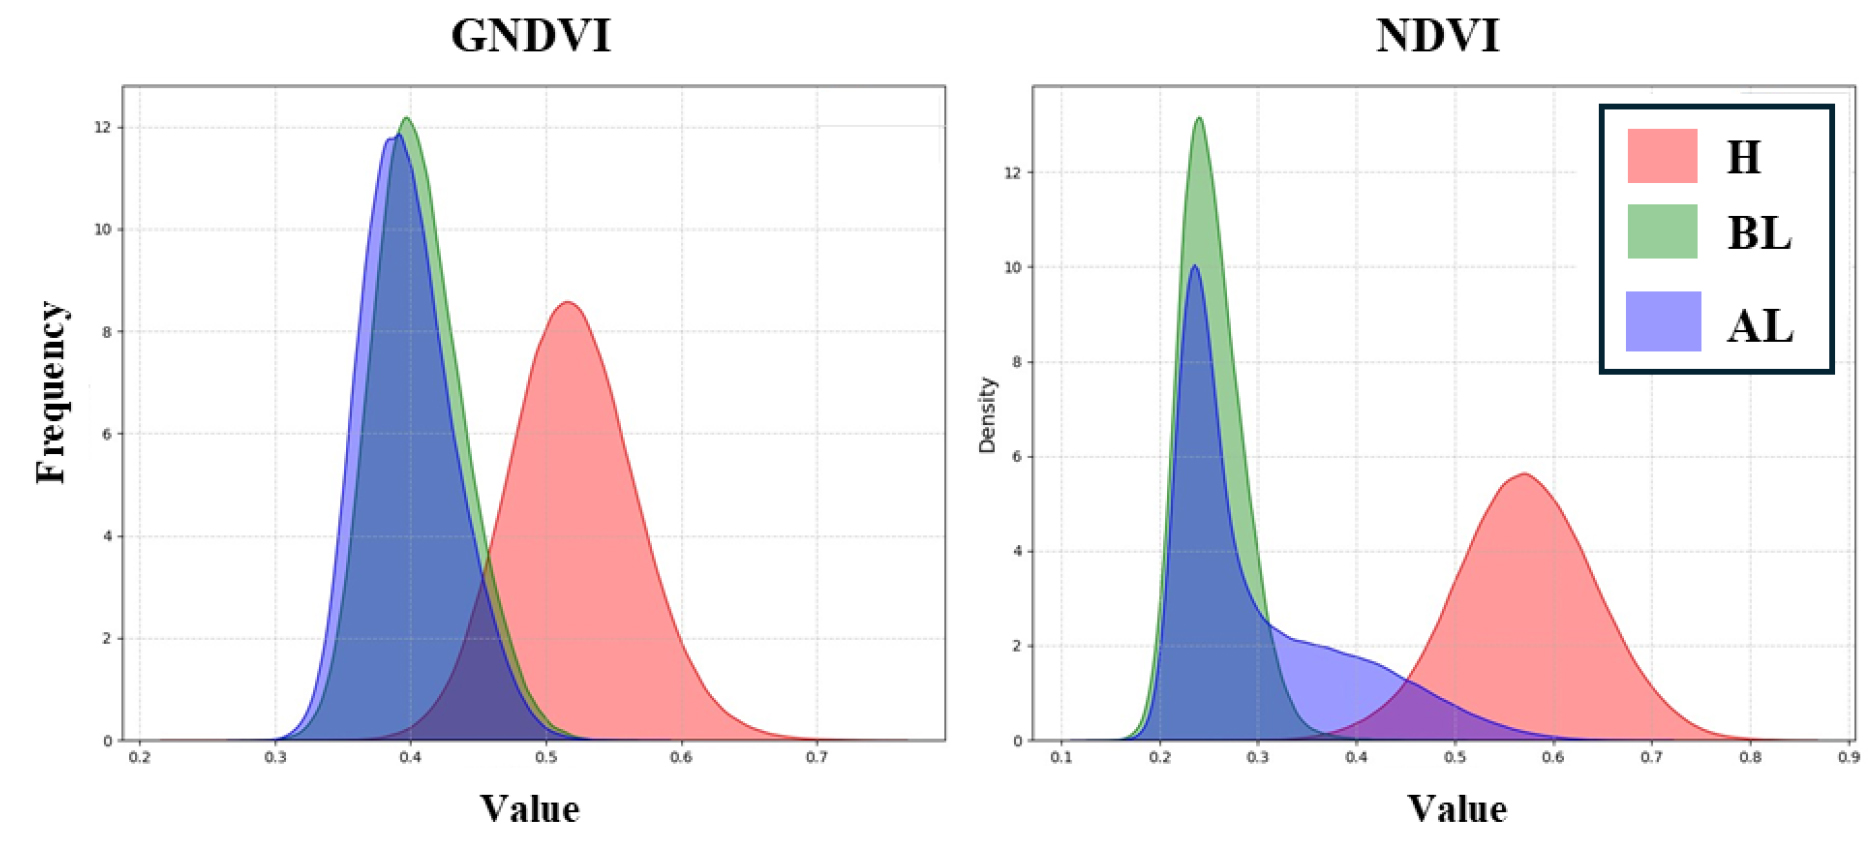
The comparative analysis of vegetation indices is detailed in Table 3. A clear distinction was observed between lodged areas (AL, BL) and non-lodged areas for all vegetation indices. Although significant differences between AL and BL were found in most indices, except for EXG, GNDVI, and NDRE, the average values showed that the distinction between AL and BL was not as pronounced as that between H.
Interestingly, in terms of skewness, the vegetation indices in AL were found to be greater than 1, except for GNDVI and NDRE, indicating that the distribution is skewed to one side. All skewness values were positive, suggesting that the data overlaps with values from the H region (Fig. 3). This implies that the abiotic lodging areas include regions of rice where chlorophyll is not severely damaged, which could serve as a distinguishing feature from biotic lodging areas.
Table 3.
Results of statistical analyses.
|
Vegetation Index | Mean | Skewness | p-value | ||||
| H | BL | AL | H | BL | AL | ||
| EVI | 0.527ay | 0.163b | 0.21c | -0.253a | 0.689b | 1.76c | *** |
| EXG | 0.172a | 0.05b | 0.06b | 0.137a | 1.210b | 1.284b | *** |
| GNDVI | 0.586a | 0.406b | 0.40b | -0.544a | 0.341b | 0.408b | *** |
| GRVI | 0.185a | -0.171b | -0.11c | -0.22a | 0.531b | 1.300c | *** |
| NDRE | 0.224a | 0.12b | 0.11b | -0.164a | 0.376b | 0.377b | *** |
| NDVI | 0.636a | 0.253b | 0.30c | -0.729a | 0.700b | 1.123c | *** |
| NGRDI | 0.088a | -0.171b | -0.106c | 0.215a | 0.531b | 1.295c | *** |
| OSAVI | 0.50a | 0.188b | 0.250c | -0.677a | 0.832b | 1.13c | *** |
| RDVI | 0.400a | 0.176b | 0.270c | -0.455a | 0.707b | 1.090c | *** |
| VARI | 0.214a | -0.222b | -0.15c | -0.424a | 0.742b | 1.273c | *** |
DISCUSSION
Vegetative indices (VIs), which are mathematical combinations of spectral bands from remote sensing data, offer a valuable tool for estimating chlorophyll levels in plants (Xue & Su, 2017). These indices, such as the Normalized Difference Vegetation Index (NDVI), Green Normalized Difference Vegetation Index (GNDVI), and Chlorophyll Index (CI), utilize red, green, and near-infrared bands to assess plant health. While these indices provide valuable insights, factors like soil background, atmospheric conditions, and other plant pigments can influence their accuracy. To ensure reliable chlorophyll estimation, it is essential to use vegetative indices in conjunction with other information and methods.
Chlorophyll, the pigment responsible for the green color of plants, is crucial for photosynthesis (Pareek et al., 2017). When a plant is diseased, its metabolic processes can be disrupted, leading to decreased chlorophyll production or breakdown (Christ et al., 2014). This can result from reduced photosynthesis, nutrient deficiencies, tissue damage, or hormonal imbalances. While not all diseases directly affect chlorophyll levels, many cause symptoms like yellowing or browning of leaves due to chlorophyll degradation (Hörtensteiner et al., 2006). The extent of chlorophyll reduction can vary depending on the severity of the disease and the plant species involved.
Abiotic factors such as wind and excessive nitrogen can also contribute to a gradual decline in chlorophyll levels (Sharma et al., 2020). Wind lodging causes physical damage to plant tissues, including leaves, leading to chlorophyll breakdown and reduced photosynthesis. Additionally, damage to the root system can impair nutrient uptake, including nitrogen, which is essential for chlorophyll production (Karthika et al., 2018). Excessive nitrogen can accelerate plant senescence and disrupt nutrient balance, leading to chlorophyll degradation. The rate of chlorophyll decline varies depending on the severity of these factors, plant species, and other environmental conditions.
Biotic factors such as diseases and pests can cause a more rapid and severe depletion of chlorophyll compared to abiotic factors like wind lodging or excess nitrogen (Ogle, 1997). These biotic stressors often directly damage plant tissues, leading to chlorophyll breakdown and necrosis. Additionally, they can deplete essential nutrients and inhibit photosynthesis, further accelerating chlorophyll decline. Addressing these issues promptly is crucial to minimize damage and preserve the plant’s photosynthetic capacity.
The differences in chlorophyll reduction observed in the current study led to distinct shapes in the peaks of VIs, despite similar average peak values between abiotic and biotic-induced lodging. Using these finding, it is possible to determine whether the lodging is biotic or abiotic by analyzing the skewness of the VI value distribution in lodging areas identified morphologically. This suggests the importance of selecting appropriate parameters to distinguish target traits. The results of this study are expected to aid in parameter decision-making for future research.
