

INTRODUCTION
MATERIALS AND METHODS
Plant material
Inoculation with Aspergillus flavus strains
Percent seed infection index estimation
Quantitative analysis of aflatoxin B1
Resistance variety clustering method
RESULTS AND DISCUSSION
INTRODUCTION
Peanut, also known as groundnut (Arachis hypogaea L.), is one of the world’s most important edible oil crops (Syed et al., 2021). Peanuts are consumed worldwide and are rich in proteins (e.g., arginine), oils (e.g., oleic acid and linoleic acid), fiber, vitamins (e.g., niacin and tocopherol), and carbohydrates (Andersen et al., 1998; Settaluri et al., 2012).
Mycotoxins are secondary metabolites produced by a variety of fungi such as Aspergillus, Alternaria, Fusarium, and Penicillium. The Food and Agriculture Organization (FAO) reported that 25% of food worldwide is contaminated with mycotoxins (Nazhand et al., 2020). Aflatoxin (AF) is the most toxic mycotoxin produced by the Aspergillus genus, which includes Aspergillus flavus (A. flavus) and produces aflatoxin B1 (AFB1) and B2, and Aspergillus parasiticus (A. parasiticus), which produces aflatoxins B1, B2, G1, and G2 (Klich, 2007). Aflatoxin B1 produced by A. flavus is the most widespread and toxic of the approximately eighteen types of aflatoxin (Yunus et al., 2011). A. flavus, which is more common in subtropical and tropical climates can grow at a wide range of temperatures (19–35°C), with incremental growth and aflatoxin production occurring at 28–30°C (Magan et al., 2011). A. flavus can survive for up to three years as sclerotia or conidia in soil and as mycelia in infected plant tissue (Wicklow et al., 1993). The sclerotium germinates into mycelium under favorable environmental conditions, producing conidiophores that are dispersed through the air and infect various crops (Horn, 2003; Klich, 2007).
Aflatoxin is destroyed between 237 and 306°C is difficult to totally degrade even with chemical treatment, making it difficult to decrease aflatoxin levels in general practice (Pandey et al., 2019). Many crops, including cereals (e.g., maize, sorghum, wheat, and rice), oilseeds (e.g., soybeans, peanuts, and cottonseed), spices (e.g., chilies, peppers, and ginger), and nuts (e.g., pistachios and almonds), have been damaged by aflatoxins produced by A. flavus (Blount, 1961; Stössel, 1986; Jaime-Garcia et al., 2003; Giray et al., 2007; Neme & Mohammed, 2017). The toxin is taken into the human body directly or indirectly by ingesting contaminated foods or the by-products of animals that have consumed toxin-contaminated feed (Ostry et al., 2017). The excessive intake of aflatoxin can induce acute poisoning (aflatoxicosis), which is frequently fatal due to liver damage (Pitt, 2000). Aflatoxins are also genotoxic (Verma, 2004) and can induce DNA damage, which causes cancer in animals including humans (Wu, 2015). The International Agency for Research on Cancer (IARC) classified aflatoxin B1 as carcinogenic (Group 1) for hepatocellular carcinoma (WHO and IARC, 1993). The production of aflatoxin M1 in milk by animals fed aflatoxin B1-contaminated feed is an example of a secondary impact (Guan et al., 2011).
Aflatoxin (AF) resistance in peanuts has been studied since its discovery in 1960, and researchers have reported three mechanisms of host-pathogen resistance, including in vitro seed colonization (IVSC), pre-harvest aflatoxin contamination (PAC), and aflatoxin production (AP) in diverse genetic backgrounds (Pandey et al., 2019; Pickova et al., 2021). Among these mechanisms, resistant varieties 55-437, J11, PI337394F, and AR-1 were chosen for the IVSC mechanism (Commey et al., 2021; Nayak et al., 2017; Wilson et al., 1977; Rao et al., 1989). F1334 and F1344 were chosen as resistant cultivars for the PAC mechanism (Holbrook et al., 2000), and U 4-7-5 and VRR 245 were chosen for the AP mechanism (Mehan et al., 1986).
Detection techniques for aflatoxin can be categorized as chromatographic, immunochemical, and spectroscopic. High-performance liquid chromatography (HPLC) has been reported as the best technique for quantifying aflatoxins in foods because of its high sensitivity (Wacoo et al., 2014). The present study was conducted to evaluate the aflatoxin B1 resistance of 102 peanut accessions using ultra-performance liquid chromatography (UPLC) and select putative aflatoxin B1-resistant peanut accessions.
MATERIALS AND METHODS
Plant material
A total of 102 peanut accessions were used in this experiment (Supplementary Table S1). Among them, 101 peanut germplasms were obtained from the Korean National Agrobiodiversity Center, Rural Development Administration (RDA) Genebank Information Center (Wanju-gun, South Korea), including landraces, breeding lines, and cultivars. In addition, one aflatoxin-resistant peanut germplasm ‘55-437’ was employed as a check plant (Nigam et al., 2009). The peanut accessions were planted and harvested in the experimental field of Pusan National University (Miryang, South Korea) in 2020. Each accession was planted in a two-row plot 1 m long with 0.2 m row spacing. Each plot was spaced 0.4 m apart in the planting route, with 0.9 m inter-row spacing to decrease cross-contamination. The seeds were planted at a density of two seeds/hole at a depth of 2 cm.
Inoculation with Aspergillus flavus strains
A. flavus strain KACC 45068, producing aflatoxin B1 was obtained from the Korea Agricultural Culture Collection (Jeonju, South Korea). A. flavus conidia were cultured on potato dextrose agar (PDA) medium in a 90 mm petri dish at 29 ±1°C for 14 days. Conidia were collected and suspended in sterile water containing 0.05% Tween-20 (v/v), and the concentration of conidia in the suspension was calculated using a hemocytometer (DHC-N01, NanoEnTek, Seoul, Korea). An A. flavus conidial suspension of 2 × 10⁶ CFU/mL was made in 0.05% Tween-20 solution. Ten healthy peanut seeds were selected for each accession harvested in 2020, sterilized with 75% ethanol for 1 min, and washed three times with sterile water for 13 min (Yu et al., 2019). Each seed was inoculated with 100 μL of conidia suspension. Peanuts inoculated with A. flavus were grown for seven days at 29 ± 1°C and 85% humidity in the dark.
Percent seed infection index estimation
The percent seed infection index (PSII) of each peanut seed inoculated for seven days was estimated (Fig. 1). The external infection of each seed was determined by visual inspection at four levels by the slight modification of a previously reported method (Yu et al., 2019). The fungal infection rating for the individual kernels of each germplasm and scale value was determined, and the percentage of severe external infections was calculated using the following equation:
(where N is the total number of seeds and the level of spore coverage on the seed surface is represented by N0 for seed surface infection: N1 for 0 to 1/4 coverage, N2 for 1/4 to 1/2 coverage, and N3 for 1/2 to complete coverage.)
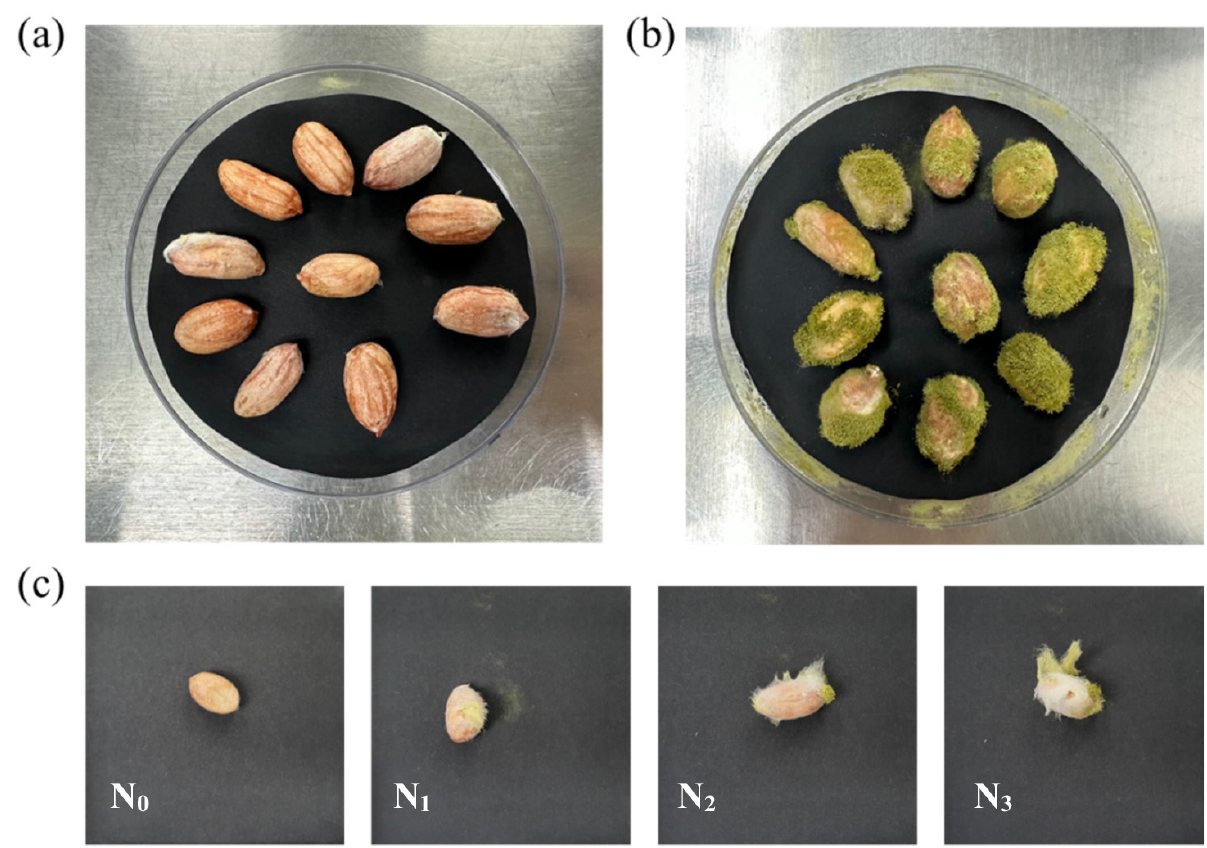
Fig. 1.
Visual appearance of peanuts seven days after inoculation with A. flavus. (a) GWP 1, representing the resistant group with a 0% PSII value, (b) K-Ol, representing the susceptible group with a 100% PSII value, and (c) GWP 51, with a 73.3% PSII value. The grades from left to right are N0 when the conidia surface was 0, N1 from 0 to 1/4, N2 from 1/4 to 1/2, and N3 from 1/2 until the surface was fully formed.
Quantitative analysis of aflatoxin B1
Aflatoxin B1 content in peanuts was quantified by referring to the Korean Food Code (2022) and the Association of Official Analytical Chemists (AOAC) Method 991.31 (AOAC, 1994). After co-culturing with A. flavus for seven days, all peanut seeds were rinsed with 75 % ethanol, dried at 110°C for two hours, and ground at full speed for 2 min using a Waring blender (Vicam, Watertown. MA, USA). Extract solution (40 mL of 70% MeOH with 1% NaCl (v/v)) was added to the ground sample and homogenized for 1 min with the blender and then filtered through Whatman No. 4 filter paper (Whatman, Buckinghamshire, UK). The purified extract of (10 mL) was added to 30 mL of 1% Tween-20 (v/v), filtered through glass fiber filter paper (GF/A, Whatman), and injected into an immunoaffinity column (AflaTest WB, Vicam, MA, USA). Then 20 mL of extract was injected into the immunoaffinity column and passed through at a rate of about one drop per second. Water (15 mL; Burdick & Jackson, Muskegon, MI, USA) was injected into the immunoaffinity column and passed it through at a rate of about one or two drops per second for washing. Elution was performed with 3 mL acetonitrile (Burdick & Jackson, Muskegon, MI, USA). The eluate was dried with nitrogen at 50°C. For derivatization, 0.2 mL of trifluoroacetic acid (TFA; Sigma-Aldrich, St. Louis, MO, USA) was added and left in the dark for 15 min, and 0.8 mL of 20% acetonitrile (v/v) was added and filtered with a 0.2 μm syringe filter. TFA derivatization, which is A chemical derivatization procedure, was conducted for UPLC analysis after pretreatment of the outer surface.
The concentration of aflatoxin B1 was determined by UPLC (Shimadzu UPLC, Nexera System, Shimadzu, Kyoto, Japan) with a 250 mm × 4.6 mm, 5 μm C18 column (Agilent, Santa Clara, CA, USA). The system column heater maintained a column temperature of 40°C. A photodiode array detector (PDA; Shimadzu) was utilized as the UPLC detector. The aflatoxin standard used in the analysis was acquired from Sigma-Aldrich Chemical Co. (St. Louis, Missouri, United States). Aflatoxin standard was also dried at 50°C with nitrogen, 0.2 mL of TFA was added and left in the dark for 15 min, and 0.8 mL of 20% acetonitrile (v/v) was added and filtered through a 0.2 μm syringe filter for derivatization. The mobile phase consisted of a mixture of water and acetonitrile (77:23, v/v), with a flow rate of 1 mL/min. The injection volume was 40 μL, and the injection time was 20 min. Aflatoxin concentration was measured as the peak area using a regression equation. The aflatoxin B1 content was determined using the formula specified in the Korean Food Code (2022).
(where y is the concentration of aflatoxin B1, and x is the peak area of aflatoxin B1)
Resistance variety clustering method
The K-means clustering algorithm in R software was used to select accessions resistant to aflatoxin B1 (Bock, 2008). Since the aflatoxin B1 and PSII units diverged, standardization was performed to bring them into alignment (Mohamad & Usman, 2013). A within sum of squares (WSS) plot was used to explain the homogeneity within a cluster by determining the K value (number of clusters) (Makles, 2012). Visualization of the cluster results was performed using the Factoextra package in R software (Kassambara & Mundt, 2017).
RESULTS AND DISCUSSION
A total of 102 accessions including 101 Korean germplasms and 55-437, were inoculated with A. flavus. Seven days after inoculation, PSII was performed using 102 accessions, and all accessions were divided into four classes according to the degree of infection (Fig. 1).
After inoculation, UPLC-PDA analysis of aflatoxin B1 was performed. The standard contained aflatoxin B1, B2, G1, and G2, and the TFA derivative detected aflatoxin G1, B1, G2, and B2 in that order. A. flavus, a fungus that produces aflatoxin B1 and B2, was also utilized in this experiment, and aflatoxin B1 was primarily detected in sample analysis (Fig. 2).

LC (liquid chromatography) is one of the most common chromatographic methods used to measure aflatoxin concentrations (Wacoo et al., 2014). However, unlike Enzyme-linked immunosorbent assay (ELISA) or Thin-layer chromatography (TLC), aflatoxin B1, B2, G1, and G2 fluorescence cannot be distinguished without a derivatization process. Existing techniques include pre-column derivatization with TFA and post-column derivatization with a photochemical reactor for enhanced detection (PHRED) and a KOBRA electrochemical cell system (Kok, 1994). In the case of aflatoxin B1, the double bond in the dihydrofuran group is rapidly rehydrated, resulting in the formation of the fluorescent species B2a via TFA derivatization, which is an analyzable form. In contrast to post-column derivatization, pre-column derivatization modifies the detection order from aflatoxin G2-G1-B2-B1 to aflatoxin G1-B1-G2-B2 (Woo et al., 2022).
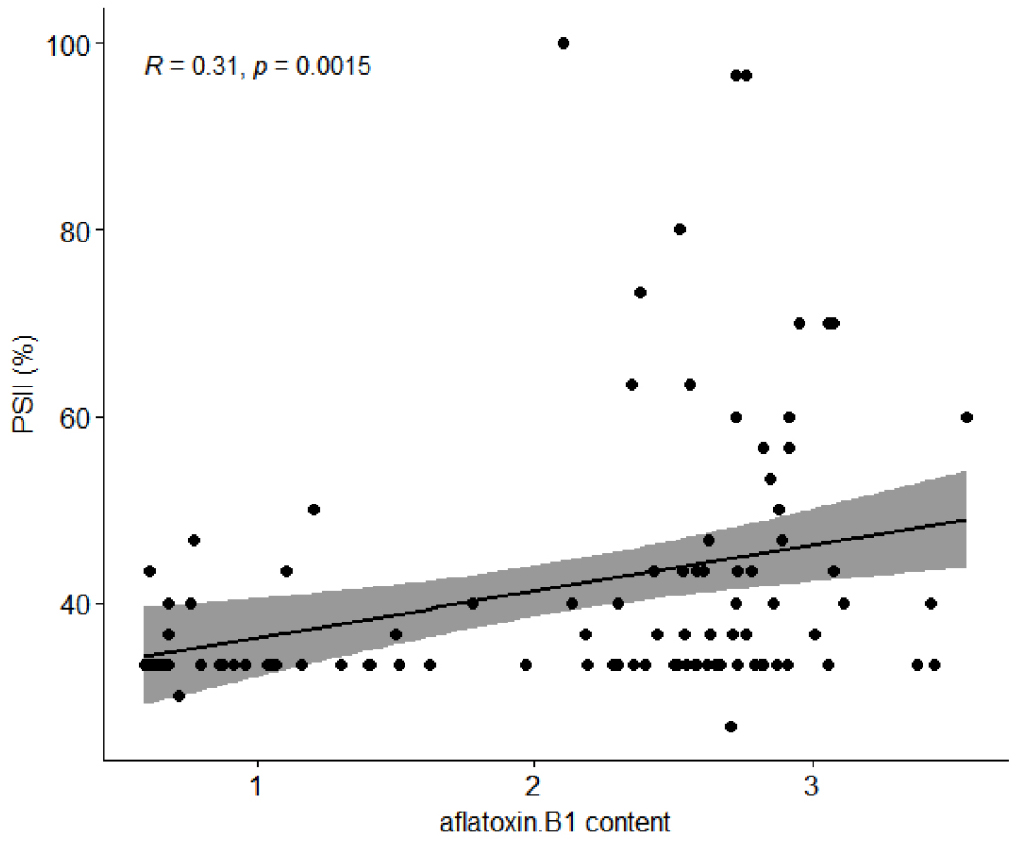
Following culture, PSII values by visual inspection ranged from 26.6 to 100% (Fig. 3a). In this experiment, the fungus A. flavus, which produces aflatoxins B1 and B2, was used, and only aflatoxin B1 content was evaluated. Aflatoxin B1 content in peanut accessions harvested in 2020 ranged from 0.599 to 3.554 μg/g (Fig. 3b). The reported resistant accession 55-437 had a PSII value of 33.3% and aflatoxin B1 levels of 1.623 μg/g. Pearson’s correlation analysis revealed a correlation coefficient of 0.31 between the two values (Fig. 4).
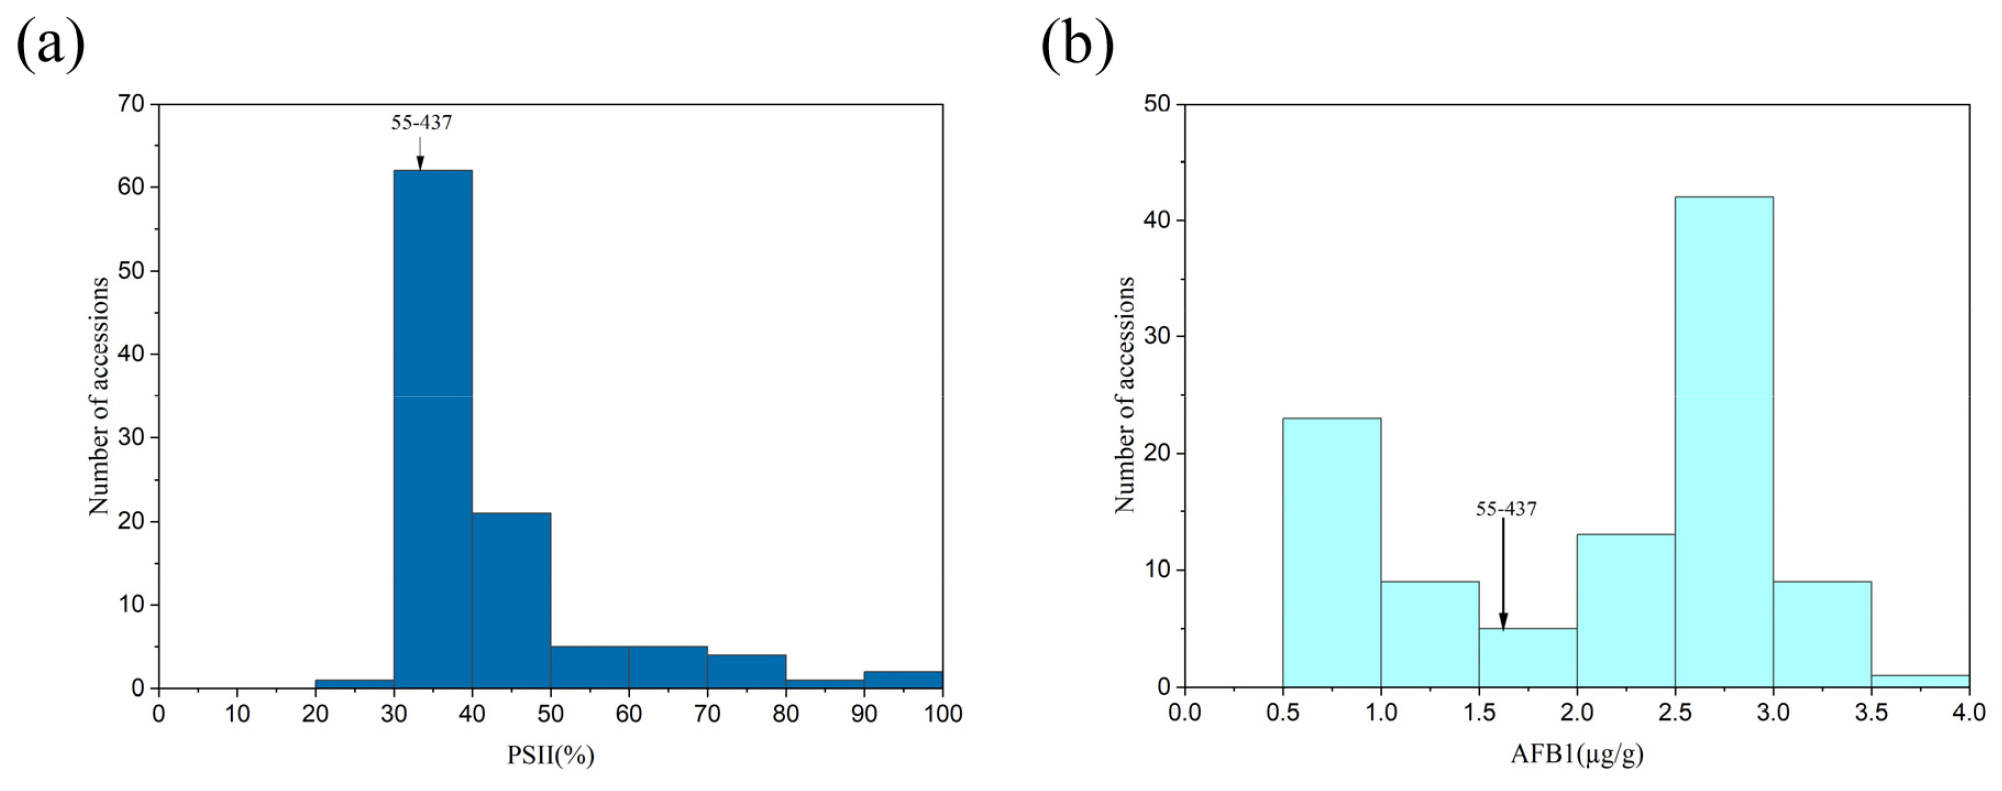
Fig. 3.
Assessment of aflatoxin B1 contamination in 101 peanut accessions from Korea. (a) Percent seed infection index (PSII) values for Korean peanut accessions, and (b) Aflatoxin B1 levels in peanut accessions harvested in the 2020 season. Cultivar 55-437 serves as an aflatoxin-resistant cultivar that was used as the check plant.
Aflatoxin B1 content and PSII values were compared to select peanut accession varieties resistant to aflatoxin B1 in Korean varieties (Fig. 3). The K-means clustering algorithm in R software was utilized, and a value 4 was selected for K as a Within Sum of Squares (WSS) plot, resulting in four clusters (Fig. 5). The resistant cultivar 55-437 was assigned to cluster 2, which was chosen as the resistant group. The results showed that 26 accessions with both values less than those of 55-437 could be used to develop peanut varieties resistant to aflatoxin B1 (Table 1).
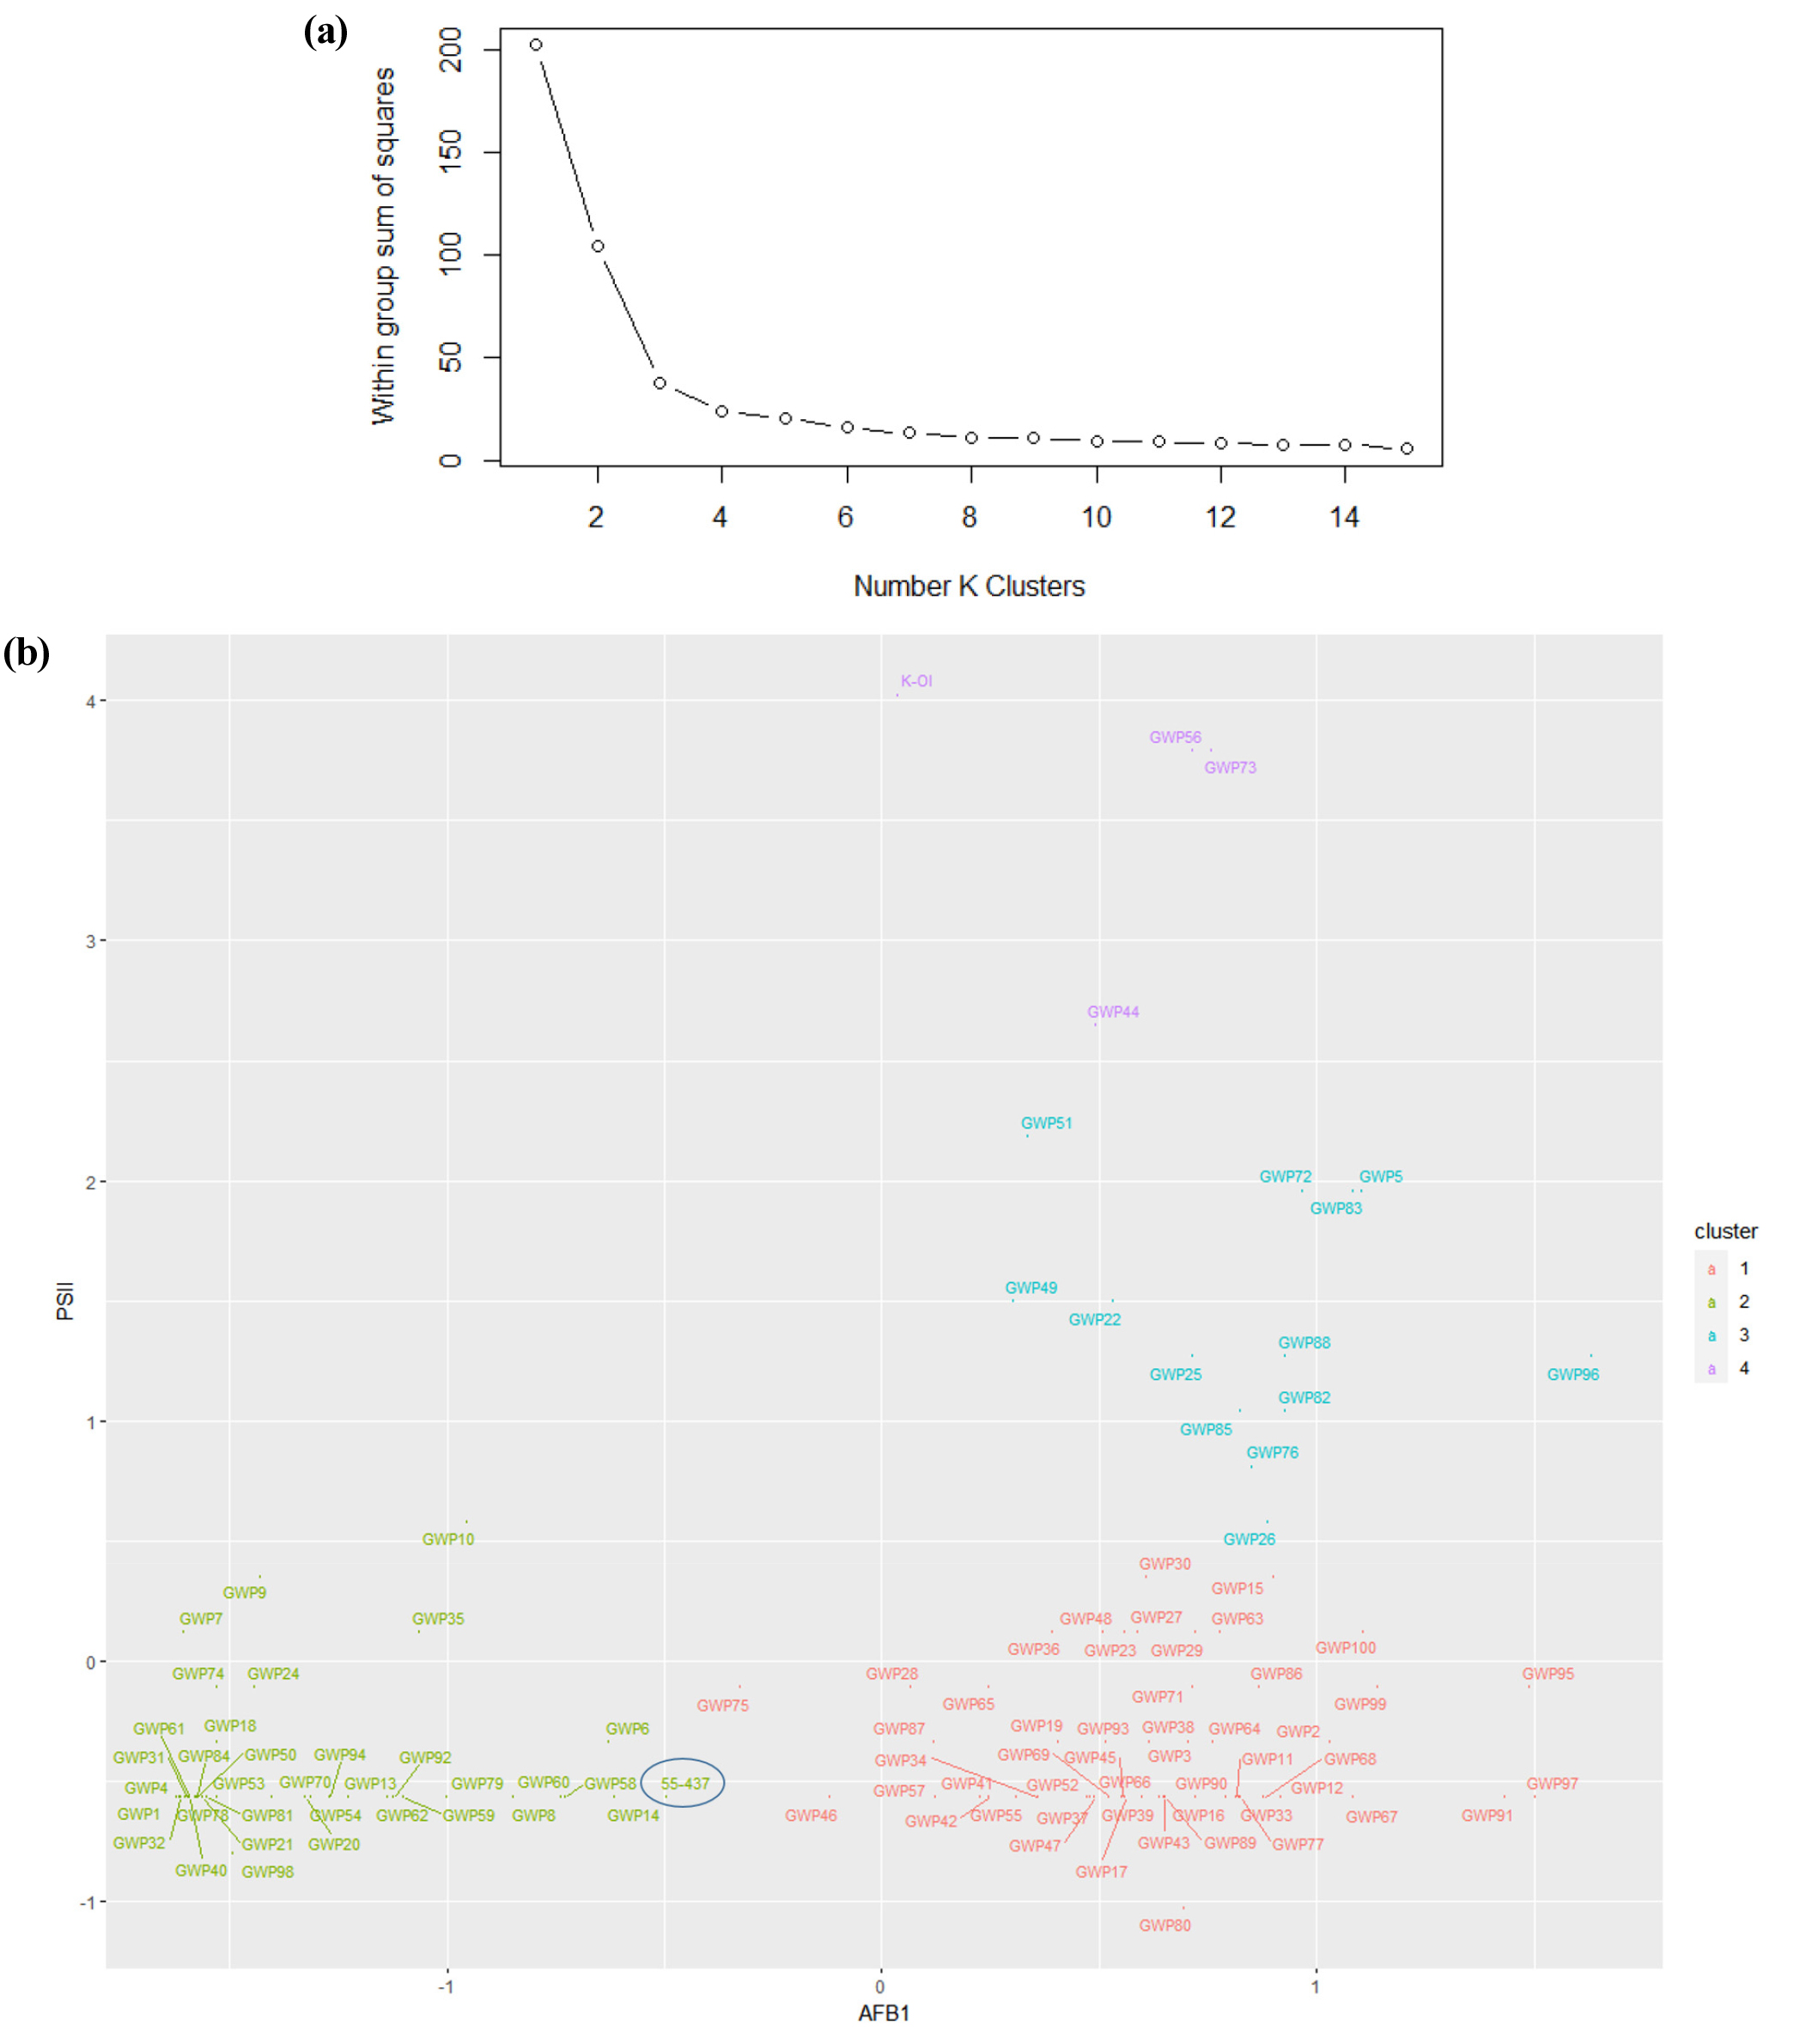
Fig. 5.
Selection of aflatoxin B1-resistant cultivars utilizing the K-means algorithm implemented in R to select resistant cultivars. (a) The Within-Cluster Sum of Squares (WSS) plot resulted in the formation of four distinct clusters. (b) The clustering plot illustrates the distribution of 101 Korean peanut accessions alongside cultivar 55-437 (check plant), based on their aflatoxin B1 and PSII values, into four groups. Among these, Cluster 2 (light green) contains the check plant 55-437 (circled) and has been identified as the resistant group. The subsequent selection of 26 genetic resources from cluster 2 will be used to propagate cultivars resistant to aflatoxin B1 in Korea.
Table 1.
List of aflatoxin B1-resistant peanut germplasms chosen from 101 Korean peanut accessions.
The objective of the study was to assess aflatoxin B1 resistance and select resistant varieties from 101 Korean genetic resources. Clustering was used as the evaluation method, and a visual inspection was used to determine the PSII value. Aflatoxin B1 content was quantitatively analyzed by UPLC-PDA, with reference to previously published papers, and based on that of 55-437 (check plant) (Waliyar et al., 2016; Yu et al., 2020). The correlation coefficient between the two values was as low as 0.31, indicating that their relationship was unreliable based on previous studies (Yu et al., 2019). Nonetheless, resistance to fungi should be considered to be due to two host-pathogen resistance types because they play an essential role in aflatoxin production in peanuts. Twenty-six genetic resources with lower values than the check plant were chosen as aflatoxin B1-resistant cultivars. Since varieties resistant to aflatoxin B1 have not yet been developed in Korea, the accessions will be used in the future to develop aflatoxin B1-resistant cultivars.
