

INTRODUCTION
MATERIALS AND METHODS
Seed collection, field cultivation, and classification
Phenotype trait recording and classification
Data analysis
RESULTS AND DISCUSSION
Diversity of qualitative traits
Diversity of quantitative traits
Multivariate analysis
INTRODUCTION
Soybean, which originated in East Asia, is a widely grown crop that offers numerous benefits in agriculture, national economy, and human diet (Nair et al., 2023; Toomer et al., 2023). According to the most recent data from the Food and Agriculture Organization (FAO), soybean was among the top ten global commodities in terms of production in 2022, with a worldwide production of approximately 349 million tonnes. Brazil, the United States of America, Argentina, and China are currently the major producers, in that order (FAO, 2022).
Soybean has a rich nutritional profile, containing healthy fats, vitamins, and minerals like iron, calcium, and vitamin K. Additionally, it is a good source of high-quality protein and essential amino acids, making it a crucial and sustainable source of plant-based protein (Friedman & Brandon, 2001; Qin et al., 2022). Furthermore, soybeans contain bioactive compounds including phenolic acids, anthocyanins, and isoflavones, which are known for their antioxidant properties and their ability to prevent cardiovascular disorders, inflammation, and even cancer (Lee et al., 2020; Qiao et al., 2022; Wu et al., 2017). Overall, soybean has become increasingly popular in daily meals because of its pronounced health benefits. Moreover, such exceptional qualities have led to its extensive use in different sectors such as the food, pharmaceutical, and cosmetics industries, highlighting the growing demand (Modgil et al., 2021).
It is known that the global production of various crops, including soybeans, faces challenges due to climate change and related factors. To address this, extensive research has been conducted on soybean breeding to improve productivity and meet the increasing need (Rahman et al., 2023; Yoon et al., 2021a). Molecular breeding techniques, such as marker-assisted selection and genetic engineering, have played a crucial role in accelerating the development of high-performing soybean cultivars. Specifically, breeders have focused on developing soybean varieties with enhanced characteristics including higher yield potential, resistance to pests and diseases, adaptability to different environmental conditions, and rich in nutrients and health-promoting metabolites (Kumawat et al., 2021). The goal of developing improved varieties and achieving maximum production efficiency in soybean breeding research is also aimed at promoting sustainable agricultural practices to sustain the global food supply (Nair et al., 2023; Toomer et al., 2023).
To facilitate the improvement of soybean breeding and promote the development of superior varieties, it is essential to evaluate the agronomic characteristics and explore the genetic diversity available among soybean genetic resources (Fang et al., 2023; Rahman et al., 2023). The abundant genetic diversity found in a collection of soybean genetic resources provides numerous advantageous traits that can be incorporated into breeding programs, resulting in cultivars with enhanced performance (Jean et al., 2021; Zatybekov et al., 2017). Conversely, the agronomic traits of soybean genetic resources are affected by various environmental and genetic factors that collectively influence the performance and adaptability of soybean varieties (Rani et al., 2023). A comprehensive understanding and contentious examination of these factors is crucial as they facilitate the selection of varieties with desirable traits. Accordingly, several studies have explored the diversity of soybean genetic materials originating from Korea and elsewhere, and the influences of different environmental and genetic factors (Park et al., 2016; Ullah et al., 2021; Valliyodan et al., 2021; Wang et al., 2006). In Korea, such studies have led to the development of improved soybean varieties signifying the benefits of exploring soybean genetic materials (Jang et al., 2009; Kim et al., 2016, 2021). The gene bank at the National Agrobiodiversity Center, Rural Development Administration (RDA, Jeonju, Republic of Korea), holds a large collection of plant genetic resources including soybeans which still need systematic investigation before being explored for breeding, conservation, and discrimination to stakeholders (Kim et al., 2023a). In this study, a total of 575 soybean landraces collected from eight different provinces were recently cultivated and their diversity was analyzed using a total of eighteen agro-morphological traits. The findings of this study could provide an in-depth insight into the phenotypic diversity of Korean soybean landraces cultivated in a recent climatic condition paving the way for future genomics and metabolomics studies.
MATERIALS AND METHODS
Seed collection, field cultivation, and classification
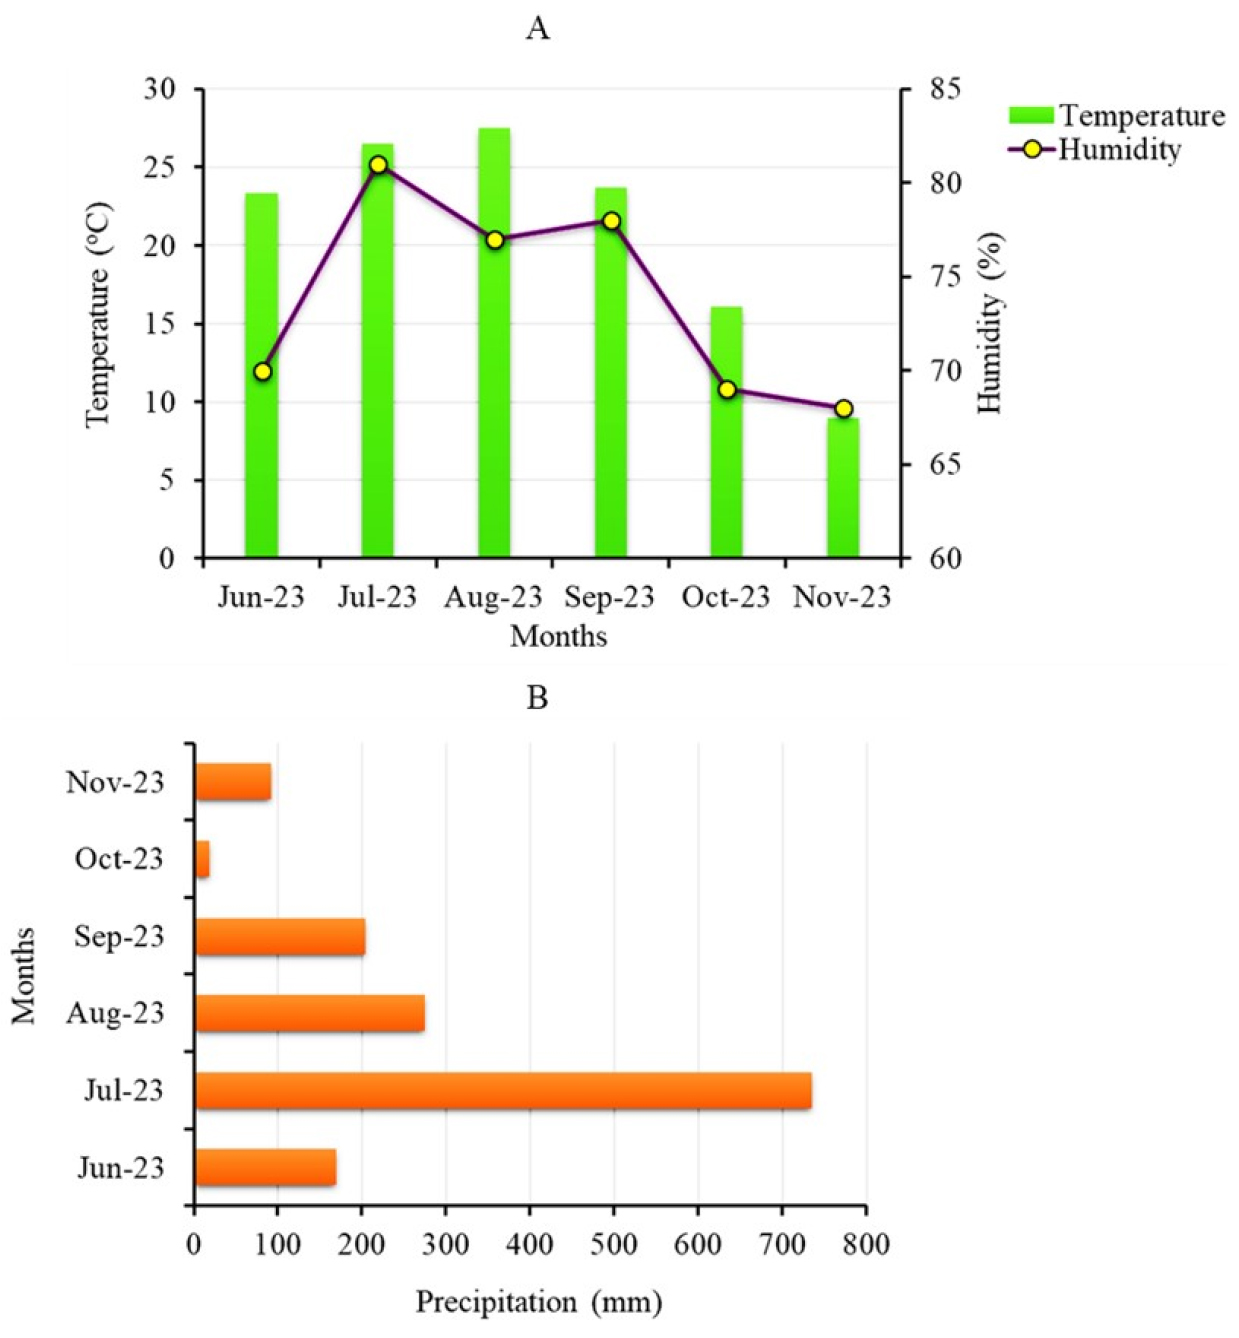
The seeds of 575 Korean soybean landraces collected from different provinces were obtained from the gene bank at the National Agrobiodiversity Center, Rural Development Administration (RDA, Jeonju, Korea). Cultivation of the seeds was conducted between June and November of 2023 in an experimental field located at the center (latitude/longitude: 35°49´38.37´´N/127° 09´07.78´´E) according to our recently reported protocol (Choi et al., 2021). Briefly, seven seeds were sown for each accession on June 06, 2023, with a spacing of 15 cm in a row and keeping the rows 90 cm apart. Uniform cultivation conditions were maintained for all accessions. The average monthly weather conditions, such as temperature, precipitation, and humidity, throughout the cultivation period can be seen in Fig. 1.
Phenotype trait recording and classification
A total of seventeen agro-morphological traits, including ten qualitative traits (hypocotyl color, cotyledon color, growth habit, flower color, leaflet number, trichome color, pod color, seed coat (testa) color, seed glossiness, and hilum color), and seven quantitative traits (days to flowering (DF), days from flowering to maturity (DFM), days to maturity (DM), number of pods per plant (PPP), number of seeds per pod (SPP), one-hundred seeds weight (HSW), and total seed weight per plant (SWPP), were recorded through field observation and laboratory examination after harvesting (Choi et al., 2021). PPP, HSW, and SWPP were measured as average values of three replicates, while SPP was determined as an average value from ten randomly selected pods. The soybeans were categorized based on their collection province as Chungcheongbuk-do (n = 31), Chungcheongnam-do (n = 64), Gangwon-do (n = 53), Gyeonggi-do (n = 47), Gyeongsangbuk-do (n = 125), Gyeongsangnam-do (n = 72), Jeollabuk-do (n = 100), and Jeollanam-do (n = 83) (Table 1).
Data analysis
To assess the diversity in qualitative traits, the standardized Shannon-Weaver Diversity index (H') was employed and calculated using the following formula.
where pi is the relative frequency of ith descriptor state, and N is the total number of states observed within a trait (Rabara et al., 2014; Shannon, 1948). The extent of variation in quantitative traits among the soybean accessions was assessed using the coefficient of variation (CV). To determine the differences between the mean values, analysis of variance (ANOVA) and Duncan’s multiple range test were carried out at a significance level of p < 0.05. The statistical and principal component analyses (PCA) were performed using xlstat software (Lumivero, CO, USA), while Hierarchical cluster analysis (HCA) was computed using JMP Pro-17 software (SAS, Inc. Cary, North Carolina, USA). Pearson’s correlation matrix analysis and boxplots, on the other hand, were conducted using R-software version 4.2 (www.r-project.org).
RESULTS AND DISCUSSION
Diversity of qualitative traits
Table 1 summarizes the distributions of the qualitative agronomical characteristics across the soybean accessions. The H' values ranged from 0.3 to 1.0 in the entire population. Traits like seed glossiness, seed color, and hilum color displayed higher H' values (≥ 0.7), indicating the presence of multiple dominant states. For instance, 58.6% of the accessions had dull seeds, while the remaining 41.4% had shiny seeds. Similarly, black, yellow, and green were the dominant seed colors, accounting for 44.7%, 23.8%, and 16.2%, respectively. Black was the dominant hilum color at 55.8%, followed by yellow (14.1%) and dark brown (13.4%) colors. On the contrary, there were also other traits that had lower H' values (< 0.50), indicating the dominance of a single state. These traits included hypocotyl color with violet color being dominant (84.7%), cotyledon color with yellow being dominant (88.0%), leaflet number with accessions with three leaflets being dominant (93.4%), and trichome color with brown being dominant (89.0%). Previously, Cho et al. (2008) studied 260 core collections of Korean landraces and found purple as the dominant flower color (83.5%) and black as the dominant hilum color (84.6%). The same study found yellow (37.7%), black (32.7%), and green (21.2%) as the dominant seed coat color. In another study, the dominance of green hypocotyl color, as well as the dominance of two or more hilum and seed coat colors were noted across 47 soybean accessions collected from East Asian countries (Chowdhury et al., 2001). Other studies also reported such wide-ranging morphological traits across different soybean accessions grown in different countries (Shilpashree et al., 2021; Shrestha et al., 2023; Ullah et al., 2021). In general, the findings of this study were comparable with many of these previous studies despite the distributional variations in the states of some traits, which could have arisen due the difference in genetic variance, growth condition, and other environmental factors (Fang et al., 2023; Park et al., 2014, 2016; Rani et al., 2023; Wang et al., 2006).
Table 1.
Distribution and relative frequency of qualitative traits across provinces and the total population.
| Trait | State | Relative frequency per province (%) | Total | H’p | ||||||||
| CCBz | CCNy | GWx | GGw | GSBv | GSNu | JBt | JNs | fr | frelq (%) | |||
|
Hypocotyl color | Green | 6.5 | 20.3 | 24.5 | 8.5 | 11.2 | 25.0 | 16.0 | 9.6 | 88.0 | 15.3 | 0.6 |
| Violet | 93.6 | 79.7 | 75.5 | 91.5 | 88.8 | 75.0 | 84.0 | 90.4 | 487.0 | 84.7 | ||
|
Cotyledon Color | Green | 12.9 | 10.9 | 18.9 | 27.7 | 12.0 | 12.5 | 5.0 | 7.2 | 69.0 | 12.0 | 0.5 |
| Yellow | 87.1 | 89.1 | 81.1 | 72.3 | 88.0 | 87.5 | 95.0 | 92.8 | 506.0 | 88.0 | ||
|
Growth Habit | Determinate | 96.8 | 93.8 | 94.3 | 93.6 | 90.4 | 91.7 | 86.0 | 86.8 | 521.0 | 90.6 | 0.5 |
| Semi-determinate | 3.2 | 6.3 | 5.7 | 6.4 | 9.6 | 8.3 | 14.0 | 13.3 | 54.0 | 9.4 | ||
|
Flower Color | Dark purple | 3.2 | 3.1 | 1.9 | 2.1 | 4.0 | 1.4 | 2.0 | 2.4 | 15.0 | 2.6 | 0.5 |
| Light purple | 87.1 | 75.0 | 71.7 | 91.5 | 85.6 | 75.0 | 82.0 | 88.0 | 472.0 | 82.1 | ||
| White | 9.7 | 21.9 | 26.4 | 6.4 | 10.4 | 23.6 | 16.0 | 9.6 | 88.0 | 15.3 | ||
|
Leaflet number | Three | 93.6 | 95.3 | 96.2 | 95.7 | 92.8 | 91.7 | 92.0 | 92.8 | 537.0 | 93.4 | 0.3 |
| Four | 0.0 | 1.6 | 3.8 | 4.3 | 5.6 | 6.9 | 6.0 | 4.8 | 27.0 | 4.7 | ||
| Five | 6.5 | 3.1 | 0.0 | 0.0 | 1.6 | 1.4 | 2.0 | 2.4 | 11.0 | 1.9 | ||
|
Trichome color | Brown | 87.1 | 92.2 | 92.5 | 95.7 | 84.8 | 86.1 | 90.0 | 89.2 | 512.0 | 89.0 | 0.5 |
| Gray | 12.9 | 7.8 | 7.6 | 4.3 | 15.2 | 13.9 | 10.0 | 10.8 | 63.0 | 11.0 | ||
|
Pod color | Black | 6.5 | 4.7 | 9.4 | 2.1 | 10.4 | 9.7 | 10.0 | 3.6 | 44.0 | 7.7 | 0.6 |
| Brown | 87.1 | 85.9 | 81.1 | 89.4 | 77.6 | 73.6 | 81.0 | 86.8 | 470.0 | 81.7 | ||
| Light brown | 6.5 | 9.4 | 9.4 | 8.5 | 12.0 | 16.7 | 9.0 | 9.6 | 61.0 | 10.6 | ||
|
Testa Color (seed coat) | Black | 48.4 | 51.6 | 50.9 | 72.3 | 21.6 | 20.8 | 49.0 | 68.7 | 257.0 | 44.7 | 0.8 |
| Brown | 12.9 | 14.1 | 9.4 | 2.1 | 17.6 | 15.3 | 7.0 | 4.8 | 63.0 | 11.0 | ||
| Green | 3.2 | 10.9 | 15.1 | 10.6 | 23.2 | 26.4 | 16.0 | 9.6 | 93.0 | 16.2 | ||
| Yellow | 32.3 | 15.6 | 18.9 | 14.9 | 33.6 | 33.3 | 21.0 | 15.7 | 137.0 | 23.8 | ||
| Yellowish green | 3.2 | 3.1 | 1.9 | 0.0 | 4.0 | 2.8 | 7.0 | 1.2 | 19.0 | 3.3 | ||
| Yellowish white | 0.0 | 4.7 | 3.8 | 0.0 | 0.0 | 1.4 | 0.0 | 0.0 | 6.0 | 1.0 | ||
|
Seed Glossiness | Absent | 38.7 | 50.0 | 62.3 | 51.1 | 64.8 | 61.1 | 61.0 | 60.2 | 337.0 | 58.6 | 1.0 |
| Gloss | 61.3 | 50.0 | 37.7 | 48.9 | 35.2 | 38.9 | 39.0 | 39.8 | 238.0 | 41.4 | ||
|
Hilum Color | Black | 51.6 | 62.5 | 66.0 | 78.7 | 36.0 | 33.3 | 62.0 | 74.7 | 321.0 | 55.8 | 0.7 |
| Brown | 19.4 | 6.3 | 5.7 | 4.3 | 13.6 | 16.7 | 6.0 | 7.2 | 56.0 | 9.7 | ||
| Dark brown | 12.9 | 14.1 | 9.4 | 4.3 | 20.0 | 20.8 | 12.0 | 6.0 | 77.0 | 13.4 | ||
| Green | 3.2 | 0.0 | 0.0 | 2.1 | 1.6 | 1.4 | 3.0 | 1.2 | 9.0 | 1.6 | ||
| Imperfect black | 0.0 | 0.0 | 0.0 | 0.0 | 3.2 | 0.0 | 0.0 | 0.0 | 4.0 | 0.7 | ||
| Light brown | 0.0 | 3.1 | 3.8 | 2.1 | 5.6 | 5.6 | 7.0 | 4.8 | 27.0 | 4.7 | ||
| Yellow | 12.9 | 14.1 | 15.1 | 8.5 | 20.0 | 22.2 | 10.0 | 6.0 | 81.0 | 14.1 | ||
The influence of collection area on both phenotypic and genotypic traits has been widely investigated in several legumes including soybeans (La et al., 2019; Li & Nelson, 2001; Wu et al., 2017). Previously, some studies also investigated the impact of collection area on several agronomical traits among Korean soybeans and showed variable results (Hwang et al., 2020; Lee et al., 2014; Yoon et al., 2000). This study also examined how the qualitative and quantitative traits varied depending on the collection area. Regardless of where they were collected, accessions from different provinces were mainly characterized by violet hypocotyl color, yellow cotyledon color, and light purple flower color (Table 1). Similarly, leaflet number, trichome color, and pod color showed no variation among accessions from different provinces. However, there were differences in the proportions of seed glossiness, hilum color, and seed color among the provinces. For example, accessions from Gyeongsangnam-do and Gyeongsangbuk-do were mainly characterized by yellow (33.6 and 33.3%, respectively) and green (23.2 and 26.4%, respectively) seed coat colors, while black seed coat color was dominant in accessions from the other provinces (48.4-72.3%). Once again, accessions from Gyeongsangnam-do and Gyeongsangbuk-do had a higher proportion of dark brown hilum color (20.0 and 20.8%, respectively) compared to accessions from the remaining provinces (4.3-12.9%). Seed glossiness also showed wide variations among accessions from different provinces. In particular, the majority of accessions (61.3%) from Chungcheongbuk-do had shiny seeds, while those from Chungcheongnam-do had an equal proportion of dull and shiny seeds. These were unlike other provinces where dull seeds dominated over shiny seeds (51.1 - 64.8%). Overall, our observation signified that the difference in collection area highly affected the distribution of seed-related qualitative traits compared to others. Morphological traits are of significant value in the development of improved soybean varieties as described before (Aper et al., 2016; Chen et al., 2020). Therefore, those traits that showed diverse variations in this study could be valuable for future genomic research. Additionally, characteristics such as seed color, cotyledon color, and hilum color are closely linked to the distribution of health-promoting metabolites such as anthocyanins, phenolic acids, and flavonoids (Desta et al., 2022; Kim et al., 2023b; Lee et al., 2023). Hence, observing different colors in these traits can be advantageous in examining the variation of these metabolites through metabolomics studies which we intend to do so in the near future.
Diversity of quantitative traits
The variations of all quantitative traits along with statistical data is provided in Table 2. The CV was highest for PPP at 62.3% in the total population, followed by SWPP at 45.5% and HSW at 38.3%. On the other hand, the CV was lowest for DM at 7.2%, followed by DF at 9.3% and DFM at 10.6%. When considering the distribution of accessions, all quantitative traits were skewed positively, except for DM and DFM, which were close to 0.0. In contrast, PPP had the highest kurtosis at 9.2, while hundred seed weight had the lowest negative kurtosis at -0.4. Overall, traits related to yield showed greater variation compared to traits related to growth. In the total population, the DF and DM were in the ranges of 34-64 and 80-139 days with means of 46.9 and 119.5 days, respectively. Previously, comparable DF (34-71 days) and DM (82-146 days) ranges were reported across Korean landraces (Cho et al., 2008). In contrast, Truong et al. (2006) reported much wider DF (42-104 days) and DM (116-171 days) ranges while Chowdhury et al. (2001) found much lower DF (23-32) and DM (62-74) ranges across different soybean accessions of varied origins. It is well documented that differences in genotypes, number of accessions studied, growth location, and year of cultivation could cause such discrepancies in growth-related traits (Fang et al., 2023; Park et al., 2014; Rani et al., 2023; Wang et al., 2006). Regarding yield-related characteristics, the PPP and SPP exhibited ranges of 47.3 to 1226.7 and 1.7 to 3.1, respectively, with average values of 227.5 and 2.4. Likewise, the HSW varied from 5.2 to 50.5 g, while the SWPP ranged from 3.4 to 278.7 g, averaging at 24.5 and 71.2 g, respectively. Similar to the growth-related traits, these values were comparable to the findings of previous studies. There were also studies where higher or lower ranges were recorded, which might be attributed to genetic differences and environmental factors as mentioned before (Cho et al., 2008; Chowdhury et al., 2001; Truong et al., 2006).
Table 2.
Variations in quantitative agronomic traits across provinces and the total population.
| Trait | Values | Province | Total |
CVk (%) | Skew. | Kurt. | |||||||
| CCBs | CCNr | GWq | GGp | GSBo | GSNn | JBm | JNl | ||||||
|
DFt (Days) | Min. | 36.0 | 38.0 | 41.0 | 43.0 | 34.0 | 34.0 | 34.0 | 36.0 | 34.0 | 9.3 | 0.8 | 1.6 |
| Max. | 58.0 | 64.0 | 55.0 | 55.0 | 58.0 | 55.0 | 64.0 | 58.0 | 64.0 | ||||
| Meanj | 46.6ab | 47.1a | 46.3ab | 47.9a | 46.6ab | 45.4b | 47.4a | 48.0a | 46.9 | ||||
|
DMu (Days) | Min. | 108.0 | 107.0 | 106.0 | 108.0 | 104.0 | 106.0 | 90.0 | 80.0 | 80.0 | 7.2 | -0.0 | -0.4 |
| Max. | 133.0 | 136.0 | 133.0 | 134.0 | 133.0 | 133.0 | 139.0 | 139.0 | 139.0 | ||||
| Mean | 120.2ab | 118.1b | 118.6ab | 121.2ab | 119.4ab | 117.8b | 119.3ab | 121.6a | 119.5 | ||||
|
DFMv (Days) | Min. | 57.0 | 56.0 | 60.0 | 60.0 | 54.0 | 60.0 | 47.0 | 44.0 | 44.0 | 10.6 | 0.0 | -0.5 |
| Max. | 85.0 | 87.0 | 84.0 | 86.0 | 88.0 | 88.0 | 91.0 | 90.0 | 91.0 | ||||
| Mean | 73.6a | 71.0a | 72.3a | 73.3a | 72.8a | 72.4a | 72.0a | 73.6a | 72.6 | ||||
|
PPPw (n) | Min. | 91.7 | 62.7 | 88.0 | 64.7 | 75.7 | 71.0 | 47.3 | 55.0 | 47.3 | 62.3 | 2.4 | 9.2 |
| Max. | 790.0 | 1156.5 | 401.0 | 758.0 | 765.0 | 464.0 | 768.0 | 1226.7 | 1226.7 | ||||
| Mean | 229.1a | 219.6a | 195.8a | 206.4a | 246.6a | 232.5a | 232.5a | 226.0a | 227.5 | ||||
|
SPPx (n) | Min. | 2.0 | 1.9 | 2.0 | 2.0 | 2.0 | 1.7 | 2.0 | 2.0 | 1.7 | 11.9 | 0.7 | 0.1 |
| Max. | 3.0 | 3.1 | 3.0 | 3.0 | 3.0 | 3.0 | 3.1 | 3.0 | 3.1 | ||||
| Mean | 2.3a | 2.4a | 2.4a | 2.3a | 2.4a | 2.3a | 2.4a | 2.4a | 2.4 | ||||
|
HSWy (g) | Min. | 13.9 | 5.2 | 10.7 | 10.5 | 9.2 | 9.3 | 7.0 | 9.0 | 5.2 | 38.3 | 0.4 | -0.4 |
| Max. | 38.4 | 50.5 | 42.3 | 44.90 | 43.5 | 43.3 | 49.2 | 48.3 | 50.5 | ||||
| Mean | 26.6ab | 27.2a | 24.7ab | 28.0a | 24.1b | 20.6c | 22.8bc | 25.4ab | 24.5 | ||||
|
SWPPz (g) | Min. | 38.5 | 28.1 | 29.1 | 23.8 | 23.8 | 6.9 | 3.4 | 17.9 | 3.4 | 45.5 | 1.5 | 5.0 |
| Max. | 158.7 | 234.6 | 135.2 | 138.0 | 219.6 | 137.9 | 278.7 | 155.1 | 278.7 | ||||
| Mean | 78.9a | 74.6ab | 65.9ab | 70.6ab | 77.0ab | 69.6ab | 69.2ab | 64.7b | 71.2 | ||||
The influence of the collection area was also statistically analyzed (Table 2). Although there were no significant variations in DFM, PPP, and SPP, the other traits including DF, DM, HSW, and SWPP displayed significant variations (p < 0.05). Accessions from Gyeongsangnam-do emerged as the earliest to flower and mature, with an average DF of 45.4 days and an average DM of 117.8 days. On the other hand, accessions from Jeollanam-do exhibited the latest flowering and maturation times, with DF and DM values of 48.0 and 121.6 days, respectively. The highest average HSW was recorded in Gyeonggi-do, reaching 28.0 g, while the lowest was found in Gyeongsangnam-do at 20.6 g (p < 0.05). Similarly, accessions from Chungcheongbuk-do showed the highest average SWPP at 78.9 g, whereas those from Jeollanam-do had the lowest average SWPP at 64.7 g. Overall, the collection area could be a decimating parameter to categorize a large collection of soybean accessions based on their maturity period, HSW, and SWPP. Growth-related and yield-related traits are among the top traits that obtained great attention in soybean breeding (Aper et al., 2016; Ravelombola et al., 2021; Truong et al., 2006). In this study, a thorough selection process was carried out to identify well-performing accessions in terms of both maturity and yield by comparing their performance with the average values of the entire population. It was discovered that 52.4% of the accessions had lower DF compared to the average, while 59.7% had lower DM. Interestingly, 12 accessions demonstrated both low DF and DM simultaneously, making them ideal resources in terms of maturity (Table 3). Additionally, 36.9% of the accessions surpassed the average value for PPP, while 46.8% displayed higher SPP indicating their exceptional high-yielding potential. Remarkably, 15 accessions simultaneously achieved higher values for PPP and SPP, making them leading candidates. On the other hand, a substantial portion (48.7%) of the accessions exhibited higher HSW than the average, while 45.9% showcased higher SWPP. Notably, 12 accessions were identified as favorable resources due to their significantly higher values in both HSW and SWPP (Table 3). Overall, these accessions could be utilized for the development of early maturing and high-yielding soybean varieties (Aper et al., 2016; Ravelombola et al., 2021).
Table 3.
Characteristic features of selected soybean accessions with desirable performance.
| Accessions with simultaneous early flowering and maturity | ||||
| IT number | Province |
DFu (Days) |
DMv (Days) | Cluster position |
| 102340 | Jeollanam-do | 36 | 80 | I |
| 105874 | Jeollabuk-do | 43 | 90 | I |
| 155155 | Gyeongsangbuk-do | 41 | 106 | I |
| 141983 | Gyeongsangnam-do | 43 | 106 | II |
| 115393 | Gangwon-do | 43 | 106 | V |
| 167939 | Jeollabuk-do | 34 | 107 | I |
| 177561 | Chungcheongnam-do | 38 | 107 | I |
| 167676 | Gyeongsangnam-do | 38 | 107 | I |
| 167895 | Jeollanam-do | 38 | 107 | I |
| 167943 | Jeollabuk-do | 41 | 107 | I |
| 154759 | Gyeongsangbuk-do | 43 | 107 | II |
| 177688 | Jeollanam-do | 45 | 107 | II |
| Accessions with simultaneous high PPP and SPP | ||||
| IT number | Province |
PPPw (n) |
SPPx (n) | Cluster position |
| 115512 | Chungcheongnam-do | 1156.5 | 2.5 | VII |
| 113114 | Chungcheongbuk-do | 790.0 | 2.5 | VII |
| 105331 | Jeollabuk-do | 768.0 | 2.4 | VII |
| 115784 | Gyeongsangbuk-do | 740.0 | 2.4 | VII |
| 115731 | Jeollanam-do | 732.0 | 2.9 | VII |
| 105498 | Gyeongsangbuk-do | 730.5 | 3.0 | VII |
| 115669 | Jeollabuk-do | 698.5 | 2.5 | VII |
| 154312 | Jeollanam-do | 661.3 | 2.5 | VII |
| 115661 | Jeollabuk-do | 632.0 | 3.0 | VII |
| 115595 | Jeollanam-do | 588.0 | 3.0 | VII |
| 113203 | Gyeongsangbuk-do | 571.0 | 2.7 | V |
| 155150 | Gyeongsangbuk-do | 545.0 | 2.8 | V |
| 115787 | Gyeongsangbuk-do | 544.3 | 2.9 | V |
| 177720 | Jeollanam-do | 541.3 | 2.4 | VIII |
| 102668 | Gyeonggi-do | 520.0 | 2.7 | VIII |
| Accessions with simultaneous high SWPP and HSW | ||||
| IT number | Province |
HSWy (g) |
SWPPz (g) | Cluster position |
| 160622 | Jeollabuk-do | 40.9 | 278.7 | VII |
| 115582 | Chungcheongnam-do | 32.9 | 234.6 | VII |
| 175844 | Gyeongsangbuk-do | 31.7 | 211.2 | VII |
| 141641 | Chungcheongbuk-do | 30.2 | 158.7 | VIII |
| 115696 | Jeollanam-do | 26.0 | 144.1 | III |
| 154745 | Gyeongsangbuk-do | 30.6 | 141.6 | VIII |
| 115733 | Jeollanam-do | 26.6 | 137.6 | III |
| 115699 | Jeollabuk-do | 25.8 | 135.8 | III |
| 115428 | Gangwon-do | 29.7 | 135.2 | VIII |
| 154441 | Gyeongsangnam-do | 34.9 | 131.0 | VIII |
| 134967 | Gyeongsangbuk-do | 26.7 | 125.3 | VIII |
| 141952 | Gyeongsangnam-do | 29.6 | 125.3 | VIII |
Multivariate analysis
The use of multivariate statistical techniques has become a powerful method in the analysis of plant genetic diversity as testified in several previous studies (Maxted et al., 2020). Using such statistical tools helps not only to categorize plant genetic resources according to their characteristic features but also to see their association with target traits (Maxted et al., 2020; Yeater et al., 2018). This study also computed HCA, PCA, and Pearson’s correlation analysis using the entire quantitative dataset to further view the distribution of the soybean accessions and their association with the quantitative traits.
The HCA categorized the soybean accessions into twelve major clusters (Fig. 2A). The distributions and proportions of accessions in each of these clusters are summarized in Table 4. Cluster II had the highest number of accessions (n = 117), followed by clusters III (n = 95) and V (n = 64). In each of these clusters, accessions from Gyeongsangbuk-do accounted for the highest proportion (≥20.0%). On the other hand, cluster VI had the lowest number of accessions (n = 13), followed by clusters I (n = 20) and VII (n = 26). Clusters IX and XII both had 31 accessions, with the highest proportion (>25.0%) being from Jeollanam-do. Clusters VIII and XI each had 50 accessions, while the remaining clusters, including IV and X, had 30 and 48 accessions, respectively. The statistical analysis indicated that there was significant variation in all of the quantitative traits among the clusters (Fig. 2B). Accessions in cluster I were distinguished by their early flowering and maturity properties, with average DF and DM of 38.6 and 106.6 days, respectively, both of which were significantly different from the other clusters (p < 0.05). However, accessions in cluster I had the lowest average SWPP (24.2 g) and PPP (102.5), indicating their lower-yielding properties. Late maturing accessions were predominantly found in clusters XII (130.0 days), X (129.3 days), IX (128.9 days), and XI (128.7 days). On the other hand, accessions in cluster VII were characterized by having the highest average PPP (668.4) and SWPP (148.3 g), which were significantly different from accessions in the other clusters (p < 0.05). The average SPP was highest in cluster VI (2.8) and lowest in cluster X (2.2), while the average HSW was highest in cluster XII (40.3 g) and lowest in cluster IV (12.2 g) (p < 0.05). In general, the soybean accessions were categorized according to their performance in terms of growth and yield-related traits in the HCA.
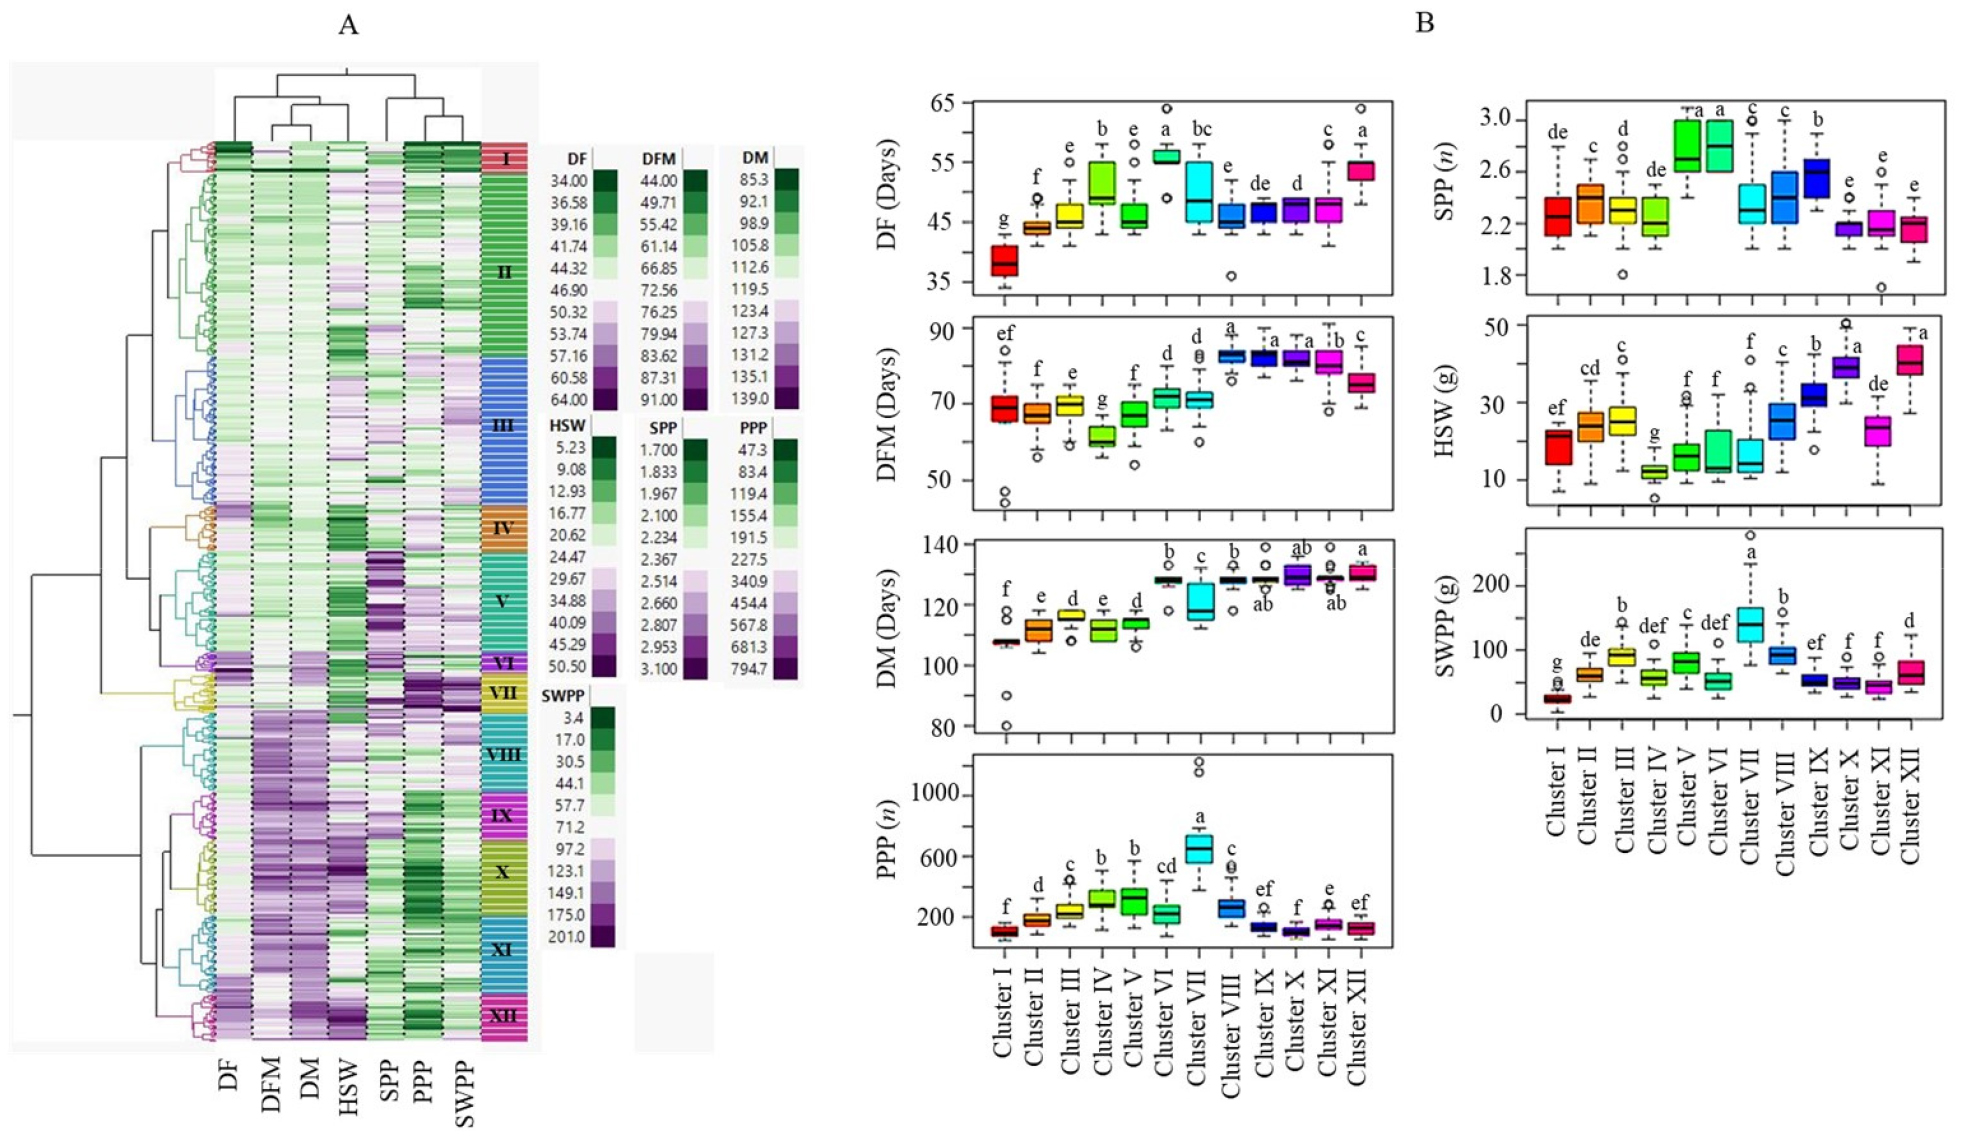
Fig. 2.
Two-way hierarchical cluster analysis of 575 soybean accessions (A) and boxplots showing the variation in quantitative traits among clusters (B). DF: Days to flowering, DM: Days to maturity, DFM: Days from flowering to maturity, HSW: One-hundred seed weight, PPP: Number of pods per plant, SPP: Number of seeds per pod, SWPP: Seed weight per plant. Different letters in the boxplots in a category indicate significantly different means (p < 0.05).
Table 4.
Frequency distribution of 575 soybean accessions across twelve clusters according to their provinces.
| Cluster | Categories | fz | fRel. (%)y | Cluster | Categories | f | fRel. (%) |
| I | Gyeongsangnam-do | 4 | 20.0 | VI | Gyeongsangnam-do | 1 | 7.7 |
| Jeollabuk-do | 7 | 35.0 | Jeollabuk-do | 3 | 23.1 | ||
| Jeollanam-do | 2 | 10.0 | Jeollanam-do | 1 | 7.7 | ||
| Gyeonggi-do | 0 | 0.0 | Gyeonggi-do | 0 | 0.0 | ||
| Gangwon-do | 1 | 5.0 | Gangwon-do | 1 | 7.7 | ||
| Gyeongsangbuk-do | 3 | 15.0 | Gyeongsangbuk-do | 5 | 38.5 | ||
| Chungcheongnam-do | 3 | 15.0 | Chungcheongnam-do | 2 | 15.4 | ||
| Chungcheongbuk-do | 0 | 0.0 | Chungcheongbuk-do | 0 | 0.0 | ||
| II | Gyeongsangnam-do | 16 | 13.7 | VII | Gyeongsangnam-do | 0 | 0.0 |
| Jeollabuk-do | 19 | 16.2 | Jeollabuk-do | 7 | 26.9 | ||
| Jeollanam-do | 13 | 11.1 | Jeollanam-do | 4 | 15.4 | ||
| Gyeonggi-do | 8 | 6.8 | Gyeonggi-do | 2 | 7.7 | ||
| Gangwon-do | 17 | 14.5 | Gangwon-do | 0 | 0.0 | ||
| Gyeongsangbuk-do | 25 | 21.4 | Gyeongsangbuk-do | 8 | 30.8 | ||
| Chungcheongnam-do | 13 | 11.1 | Chungcheongnam-do | 3 | 11.5 | ||
| Chungcheongbuk-do | 6 | 5.1 | Chungcheongbuk-do | 2 | 7.7 | ||
| III | Gyeongsangnam-do | 13 | 13.7 | VIII | Gyeongsangnam-do | 10 | 20.0 |
| Jeollabuk-do | 13 | 13.7 | Jeollabuk-do | 8 | 16.0 | ||
| Jeollanam-do | 7 | 7.4 | Jeollanam-do | 8 | 16.0 | ||
| Gyeonggi-do | 9 | 9.5 | Gyeonggi-do | 4 | 8.0 | ||
| Gangwon-do | 10 | 10.5 | Gangwon-do | 2 | 4.0 | ||
| Gyeongsangbuk-do | 23 | 24.2 | Gyeongsangbuk-do | 10 | 20.0 | ||
| Chungcheongnam-do | 13 | 13.7 | Chungcheongnam-do | 3 | 6.0 | ||
| Chungcheongbuk-do | 7 | 7.4 | Chungcheongbuk-do | 5 | 10.0 | ||
| IV | Gyeongsangnam-do | 8 | 26.7 | IX | Gyeongsangnam-do | 1 | 3.2 |
| Jeollabuk-do | 4 | 13.3 | Jeollabuk-do | 6 | 19.4 | ||
| Jeollanam-do | 5 | 16.7 | Jeollanam-do | 8 | 25.8 | ||
| Gyeonggi-do | 1 | 3.3 | Gyeonggi-do | 4 | 12.9 | ||
| Gangwon-do | 2 | 6.7 | Gangwon-do | 5 | 16.1 | ||
| Gyeongsangbuk-do | 5 | 16.7 | Gyeongsangbuk-do | 3 | 9.7 | ||
| Chungcheongnam-do | 4 | 13.3 | Chungcheongnam-do | 2 | 6.5 | ||
| Chungcheongbuk-do | 1 | 3.3 | Chungcheongbuk-do | 2 | 6.5 | ||
| V | Gyeongsangnam-do | 7 | 10.9 | X | Gyeongsangnam-do | 3 | 6.3 |
| Jeollabuk-do | 13 | 20.3 | Jeollabuk-do | 4 | 8.3 | ||
| Jeollanam-do | 9 | 14.1 | Jeollanam-do | 10 | 20.8 | ||
| Gyeonggi-do | 3 | 4.7 | Gyeonggi-do | 7 | 14.6 | ||
| Gangwon-do | 5 | 7.8 | Gangwon-do | 4 | 8.3 | ||
| Gyeongsangbuk-do | 20 | 31.3 | Gyeongsangbuk-do | 11 | 22.9 | ||
| Chungcheongnam-do | 6 | 9.4 | Chungcheongnam-do | 6 | 12.5 | ||
| Chungcheongbuk-do | 1 | 1.6 | Chungcheongbuk-do | 3 | 6.3 | ||
| XI | Gyeongsangnam-do | 9 | 18.0 | XII | Gyeongsangnam-do | 0 | 0.0 |
| Jeollabuk-do | 10 | 20.0 | Jeollabuk-do | 6 | 19.4 | ||
| Jeollanam-do | 7 | 14.0 | Jeollanam-do | 9 | 29.0 | ||
| Gyeonggi-do | 3 | 6.0 | Gyeonggi-do | 6 | 19.4 | ||
| Gangwon-do | 5 | 10.0 | Gangwon-do | 1 | 3.2 | ||
| Gyeongsangbuk-do | 10 | 20.0 | Gyeongsangbuk-do | 2 | 6.5 | ||
| Chungcheongnam-do | 3 | 6.0 | Chungcheongnam-do | 6 | 19.4 | ||
| Chungcheongbuk-do | 3 | 6.0 | Chungcheongbuk-do | 1 | 3.2 |
The PCA resulted in a total of six components, with the first three components having eigenvalues greater than one. The first two components accounted for 37.2% (PC1) and 23.2% (PC2) of the variance, making a total contribution of 60.4%. The score plot (Fig. 3A) showed that the accessions were well categorized according to their clusters along PC1 and PC2. In particular, clusters I and VII were clearly separated from the rest clusters. The loading plot (Fig. 3B) showed a similar grouping of variables as observed in the HCA. Along PC1, DF, DM, DFM, and HSW had positive loadings, while the remaining variables had negative loadings. Except for DF, SPP, and SWPP, the remaining traits had loadings above 0.5 suggesting their major contribution to the observed variance in the PCA (Table 5). Along PC2, all variables had positive loadings except for HSW, with DM, PPP, and SWPP having loadings above 0.5 (Table 5). Overall, the PCA results corroborated the observations from the HCA.
Additionally, a correlation analysis was performed to examine the associations between the variables. The correlation matrix in Fig. 3C shows the correlation coefficient (r) values and the levels of association between the quantitative traits. DM exhibited strong and positive correlations with DF (r = 0.5, p < 0.01) and DFM (r = 0.9, p < 0.001) at different levels of significance. Comparable associations between growth-related traits have been reported in several previous studies which support our findings (Aper et al., 2016; Lee et al., 2021; Yoon et al., 2021b; Xavier et al., 2018). Similarly, the yield-related traits showed some note-worthy associations. For example, PPP showed a strong and positive correlation with SWPP (r = 0.7, p < 0.01). Likewise, SPP had a relatively weak correlation with PPP (r = 0.2), although it was still statistically significant (p < 0.05). On the other hand, HSW exhibited negative correlations with SPP (r = -0.3), PPP (r = -0.5), and SWPP (r = -0.1), with the former two being significant. Previous studies have also reported similar associations. For instance, Rani et al. (2023) reported a negative correlation between HSW and PPP, and a positive correlation between PPP and SWPP which supports our observation. A positive and significant correlation was also observed between SWPP and PPP (Chen et al., 2020), and a negative correlation between HSW and PPP (Rani et al., 2023; Ullah et al., 2021).
In summary, this study examined the diversity of a wide range of soybean landraces using agro-morphological characteristics and evaluated the influence of the collection area on each trait. Significant variations were observed in both qualitative and quantitative traits. Among the qualitative traits, the soybean accessions showed the greatest diversity in seed-related traits such as seed glossiness, seed coat color, and hilum color. Similarly, quantitative traits related to yield, such as the number of pods per plant, one-hundred seeds weight, and seed weight per plant, displayed wide variations. The collection area had no impact on the distribution of most qualitative traits, but there were differences in seed glossiness, seed coat color, and hilum color among accessions from different origins. In terms of quantitative traits, maturity-related traits, and certain yield-related traits varied significantly among accessions from different provinces. These variations in traits could serve as distinguishing factors for a large collection of genetic materials. Based on their relative performances, 39 promising accessions were identified (Table 3) which could be useful for future breeding and dissemination to various stakeholders. In light of the observed phenotypic variations, it is highly recommended to conduct genomic investigations specifically targeting maturity and yield-related traits. As part of an ongoing investigation, we also plan to conduct metabolomics research to explore seed components and assess the impact of seed-related characteristics on them in the next phase.
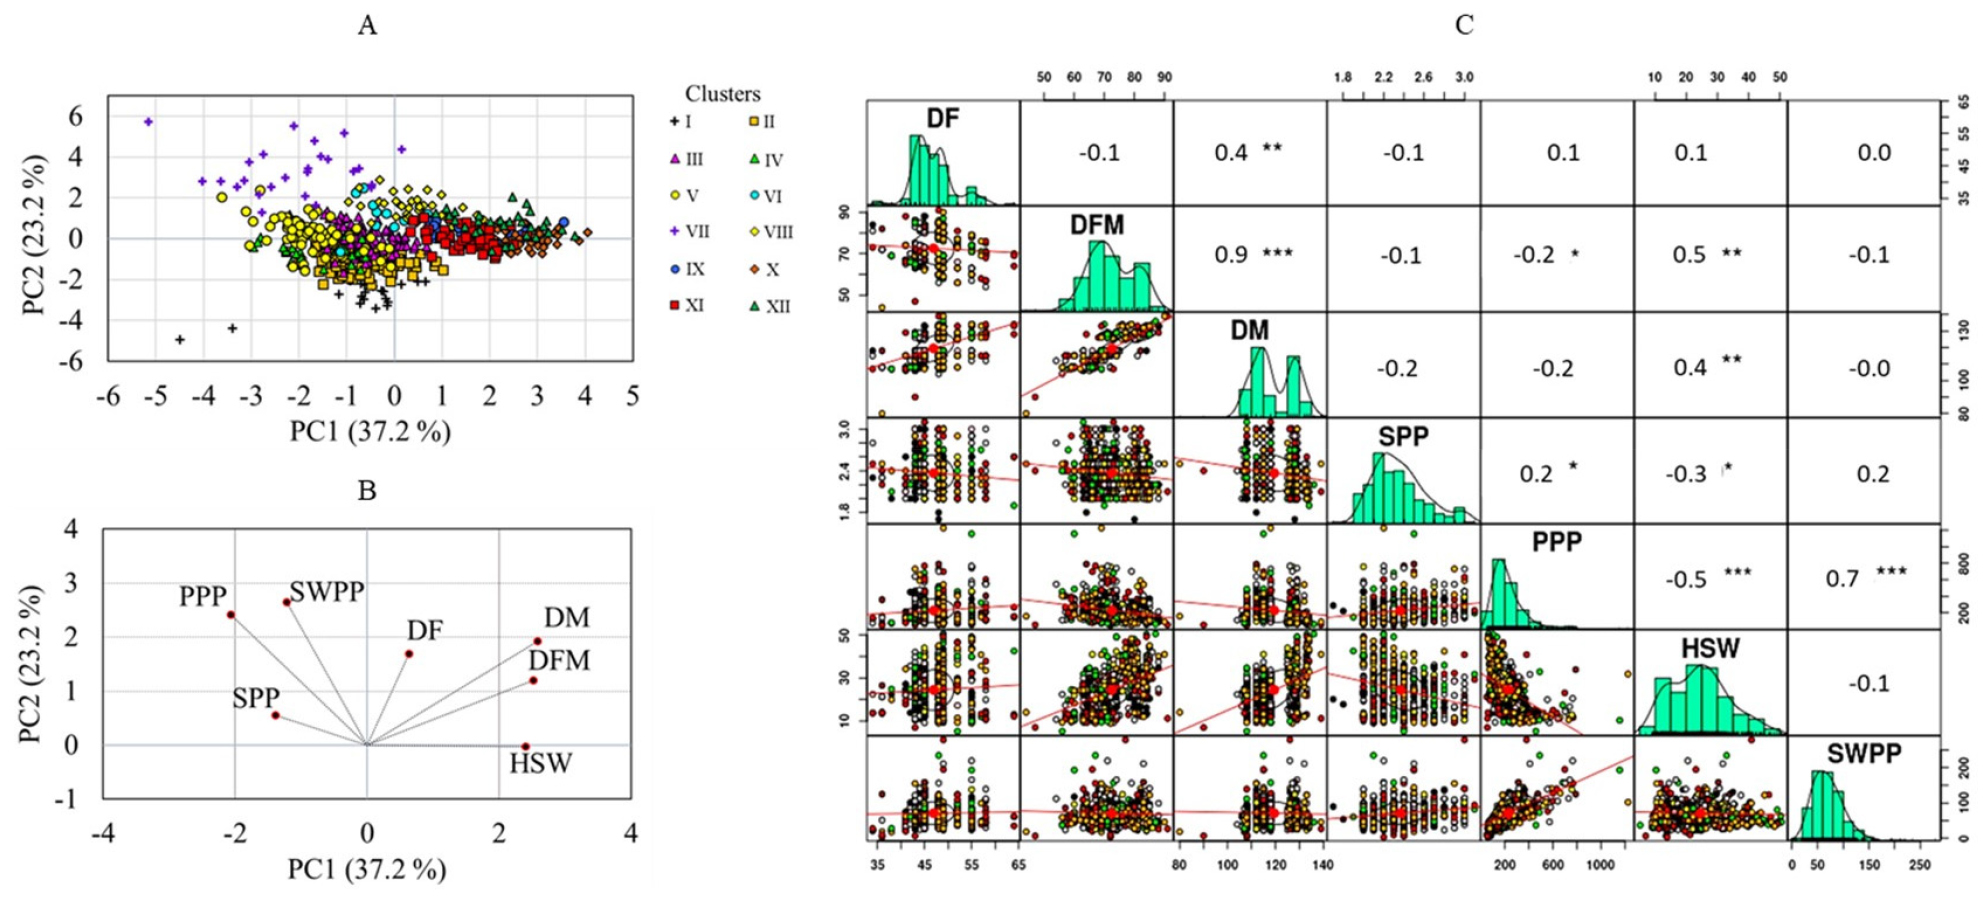
Fig. 3.
Score plot of soybean accessions (A), loading plot of variables from the principal component analysis (B), and correlation matrix of quantitative traits (C). DF: Days to flowering, DM: Days to maturity, DFM: Days from flowering to maturity, HSW: One-hundred seed weight, PPP: Number of pods per plant, SPP: Number of seeds per pod, SWPP: Seed weight per plant. Brown: Chungcheongbuk-do, Green: Chungcheongnam-do, Pink: Gangwon-do, Yellow: Gyeonggi-do, Gray: Gyeongsangbuk-do, Black: Gyeongsangnam-do, Red: Jeollabuk-do, Orange: Jeollanam-do. *p < 0.05, **p < 0.01, ***p < 0.001.
Table 5.
Factor loadings and contributions of quantitative traits in the first three principal components.
| Components | Contributions | Traits | Eigenvalue |
Variability (%) |
Cumulative (%) | ||||||
| DFx | DFMw | DMv | SPPu | PPPt | HSWs | SWPPr | |||||
| PC1 | FL | 0.2 | 0.8 | 0.8 | -0.4 | -0.6 | 0.8 | -0.4 | 2.6 | 37.2 | 37.2 |
| % | 1.5 | 23.7 | 24.8 | 7.2 | 15.8 | 21.5 | 5.6 | ||||
| PC2 | FL | 0.5 | 0.3 | 0.5 | 0.2 | 0.7 | -0.0 | 0.7 | 1.6 | 23.2 | 60.4 |
| % | 13.5 | 6.8 | 17.6 | 1.5 | 27.5 | 0.0 | 33.3 | ||||
| PC3 | FLy | -0.8 | 0.4 | -0.0 | 0.4 | 0.0 | 0.2 | 0.3 | 1.1 | 15.4 | 75.7 |
| %z | 61.6 | 16.9 | 0.1 | 12.5 | 0.0 | 2.1 | 6.8 | ||||
