


INTRODUCTION
MATERIAL AND METHOD
Sample preparation and experimental design
Milled rice quality and boiled rice palatability test
Starch isolation
Granule size distribution analysis
Gelatinization properties
Physicochemical properties of starch
Statistical analysis
RESULT AND DISCUSSION
Growth and yield
Milled rice quality and boiled rice palatability
Granule size distribution
Gelatinization properties
Physicochemical properties of starch
Correlation between ripening temperature and rice quality, starch characteristics
INTRODUCTION
Rice grows under different climatic conditions depending on their maturity type. In addition, there are cases in which transplantation is delayed due to the succession of other crops, and recently, due to lack of irrigation water during transplantation period, the transplanting is delayed. In each case, different weather conditions are given during the rice growing and ripening. Air temperature conditions during the ripening period affect the yield and quality of rice. Due to the high and low temperatures during the ripening period, the quantity and quality deteriorate (Tetlow et al., 2004; Lee et al., 2012; Kim et al., 2016; Baeket al., 2018; Kwak et al., 2018). The characteristics of rice starch also change depending on the ripening conditions, and there are not many reports on this.
Starch is the main source of energy stored in cereal grains. The amount of starch in grains varies, but typically accounts for 60-75% of grain weight and provides 70-80% of calories consumed by humans worldwide. (Thomas & Atwell, 1999). Starch is the most abundant component in rice grains, making up approximately 90% of the dry weight of milled rice grains (Fitzeraldet al., 2004). Starch determines the eating and cooking properties of rice grains, at least contributes to them through interactions with other components in the rice endosperm (proteins, lipids, water) or through interactions with other ingredients used to process the rice (Fitzerald et al., 2004).
Starch is composed primarily of amylose and amylopectin, which are made up of the same basic glucan polymers (D-glucopyranose) but have different lengths and degrees of branching. The ratio of amylose to amylopectin within a given type of starch is a very important point to consider with respect to starch functionality in foods. The content and structure of amylose and amylopectin affect the architecture of the starch granule, gelatinization and pasting profiles, and textural attributes.
The physicochemical properties of rice starches are highly dependent on the rice variety, environment, and agronomic and extraction conditions. Many studies have revealed that the physicochemical characteristics such as the amylose/amylopectin ratio and granule size are responsible for the properties of starch (Madsen & Christensen, 1996; Singh et al., 2003). In addition, studies have shown that significant changes occur in the structural and thermophysical properties of various starches when they are subjected to annealing (Wani et al., 2012). There are structural changes within the amorphous and crystalline domains of starch granules (Lan et al., 2008; Tester et al., 2000). In turn, these changes influence granular swelling, amylose leaching, pasting properties, gelatinization, and susceptibility to enzymes and acid (Wani et al., 2012).
This report is the result of studying the changes in starch characteristics when transplanting is delayed for each mature type of rice variety.
MATERIAL AND METHOD
Sample preparation and experimental design
The varieties used in the experiments includes Jopyeong (early-maturing variety), Haiami (mid-maturing variety), and Ilpum (mid-late maturing variety). In 2017~2019, these three varieties were transplanted after tilling a designated experimental plot in May 30th, Jun 30th, and July 30th at a paddy field of Gyeongsangbuk-do agricultural Research & Extension Services. The planting distance was 30×15 cm, the amount of the fertilizer applied was N-P2O5-K2O = 9 ‒ 4.5 ‒ 5.7 kg 10a-1, and the fertilizer split application was performed at a basal-tillering stage-panicle initiation ratio of 50-25-25. When the grain moisture reached 15%, after removing the rice husks with a laboratory milling machine (SY94+RTA2+2400, Ssangyong Machinery Industry Co., LTD, Korea), crushing them using a food grinder (HMF-2100S, Hanil Electronics, Korea). Then, flour from all varieties with different planting times was passed through a 100 mesh sieve and used as test sample.
Milled rice quality and boiled rice palatability test
The husked grain was mille by uniformly placing pressure, achieving 92% milled rice per brown rice ratio. Milled rice quality such as head rice and chalky kernel ratio were measured in a Grain Analyzer (Cervitec Grain Inspector 1625, Foss, Sweden). Rice endosperm protein contents were measured using Near-Infrared Grain Tester (Infratec 1241, Foss, Sweden). Additionally, a ToYo-Tester (MA90B, TOYO, Japan) was utilized for measurements of the glossiness of cooked rice.
Starch isolation
Starch was isolated through alkaline treatment after soaking the rice grains in water (Yamamoto & Shirakawa, 1999). After drying the soaked rice, it was dried and pulverized using a blender, and then the sample was steeped in 0.2% NaOH solution. Alkaline treatment was repeated until the yellowish color disappeared and the biuret reaction was no longer observed. Thereafter, the precipitate was collected, thoroughly washed with deionized water, neutralized with 1N HCl, washed repeatedly with deionized water, and centrifuged at room temperature at 1,300 × g for 10 min (VS-21SMT, Vision Scientific Co., Ltd, Korea). The isolated starch was dried at room temperature and sieved (100 mesh).
Granule size distribution analysis
A laser diffraction particle size analyzer (Malvern Mastersizer 2000, Malvern Instruments Ltd., UK) was used to measure the granule size distribution of flour from each experimental sample (implanted at different transplanting time). Powder samples were then immersed in ethyl alcohol for 30 s after sonication as previously described (Sochan et al., 2012).
Gelatinization properties
Starch pasting properties
Starch pasting properties of rice flours were measured with a Rapid Visco Analyzer (RVA, Model 4, Newport Scientific, Australia). Briefly, 3 g rice flour sample and 25 mL of deionized water were added in the sample canister and then rotated at 960 rpm for 10 s to produce rice flour suspensions. Then, the rotation speed was maintained at 160 rpm until the analysis was completed. The heating temperature was maintained at 50℃ for 1 min; The sample was then heated at a rate of 12 °C per min to 95 °C, held at 95 °C for 2.5 min, then cooled to 50 °C and held at this temperature for 2 min. RVA characterization included initial pasting temperature, peak viscosity, though viscosity, final viscosity, breakdown (BD), and setback (SB) from the RVA viscogram.
Differential scanning calorimetry (DSC)
The gelatinization properties of starch were evaluated using Differential scanning calorimetry (DSC) as previously described (Donovan et al., 1983). Briefly, 3.0 mg of rice flour and deionized water (1:2, v/v) were poured into an aluminum pan using a microsyringe; the aluminum pan was scaled, left for 1 h and then heated from 30℃ to 100℃ at a rate of 10℃/min using a DSC (DSC 8500, Perkin Elmer, Waltham, MA, USA). From this peak, the gelatinization onset temperature (To), gelatinization peak temperature (Tp), gelatinization conclusion temperature (Tc), and gelatinization enthalpy (⊿H) were measured in triplicate.
Physicochemical properties of starch
Amylopectin branch-chain-length distribution
The chain-length distribution of amylopectin was analyzed with a high-performance anion-exchange chromatography system equipped with pulsed amperometric detection (HPAEC-PAD) according to a previously described method (Jane et al., 1999), with some modifications (Wang & Wang, 2000). The HPAEC system (Dionex DX500, Sunnyvale, CA, USA) consists of a GP50 gradient pump, an LC20-1 chromatography organizer, an ED40 electrochemical detector, a CarboPac PA-1 guard column (4 × 50 mm), a CarboPac PA-1 analytical column (4 × 250 mm), and an AS40 automatic sampler (Kim et al., 2016). Filtered (0.45 μm pore size) samples were separated with gradient elution from 100% eluent A (150 mM NaOH) to 100% eluent B (500 mM NaOH in 150 mM NaOH).
X-ray diffraction (XRD) analysis
The crystalline structure of starch was evaluated using an X-ray diffractometer (X’pert Pro MPD, Multi Purpose X-Ray Diffractometer, PANalytical, Netherlands). Crystallinity and crystal strength were compared with the position and height of the peak measured at the diffraction angle (2θ) of 5° to 50° using Cu-kα as a target at a scanning speed of 0.05° 2θ/s, a voltage of 40 kV, and an electric current of 20 mA. The relative crystallinity was calculated by dividing the amorphous region (Aa) and the crystalline region (Ac) (Crystallinity (%) = Ac/(Aa +Ac) ×100) using the Origin 7.0 program (Origin 7.0, Origin Lab Inc., Northampton, MA, USA).
Statistical analysis
One-way ANOVA of the average values was performed to identify significant differences between-groups (P < 0.05). Duncan’s multiple range test was also performed to identify differences between treatment using R statistical software (version 3.6.2). All tests were performed in triplicate.
RESULT AND DISCUSSION
Growth and yield
The period required for heading was shorter in all tested varieties when planting was delayed. It took about 42~44 days from transplanting to heading in late transplanting at July 30th, regardless of the maturity of the varieties (Table 1). In Daegu region, an inland plain area of Gyeongsangbuk-do, the critical period for transplanting to secure a stable yield of rice was evaluated as around July 15th for early and mid-maturing varieties and around July 5th for mid-late varieties (Fig. 1). In the late rice transplanting around July 30th, the culm length and the ripening rate decreased in the case of early and mid-maturing varieties, and the number of spikelet per panicle decreased in the case of mid-late maturing varieties, resulting in low yield (Table 3). In the case of early maturing varieties, transplantation in late June can avoid high temperatures during the ripening period, improving the yield and quality of rice. When transplanted too late in late July, the low temperature during the ripening period and insufficient cumulative air temperature resulted in a decrease in rice yield and quality (Table 2, Table 3, Table 4). Due to the high and low temperatures during the grain-filling stage caused deleterious effects on the yield and quality of crop production (Tetlow et al., 2004; Baeket al., 2018; Kwak et al., 2018).
Table 1.
Effect of transplanting time on heading of different mature rice varieties.
| Variety | Transplanting time (M.D) | Heading date (M.D) | Days for heading (Days) |
| Jopyeong | May 30th | July 24th | 54a† |
| Jun 30th | Aug. 15th | 45b | |
| July 30th | Sep. 13th | 43c | |
| Haiami | May 30th | Aug. 12th | 74a |
| Jun 30th | Aug. 25th | 54b | |
| July 30th | Sep. 14th | 44c | |
| Ilpum | May 30th | Aug. 15th | 77a |
| Jun 30th | Aug. 26th | 56b | |
| July 30th | Sep. 12th | 42c |
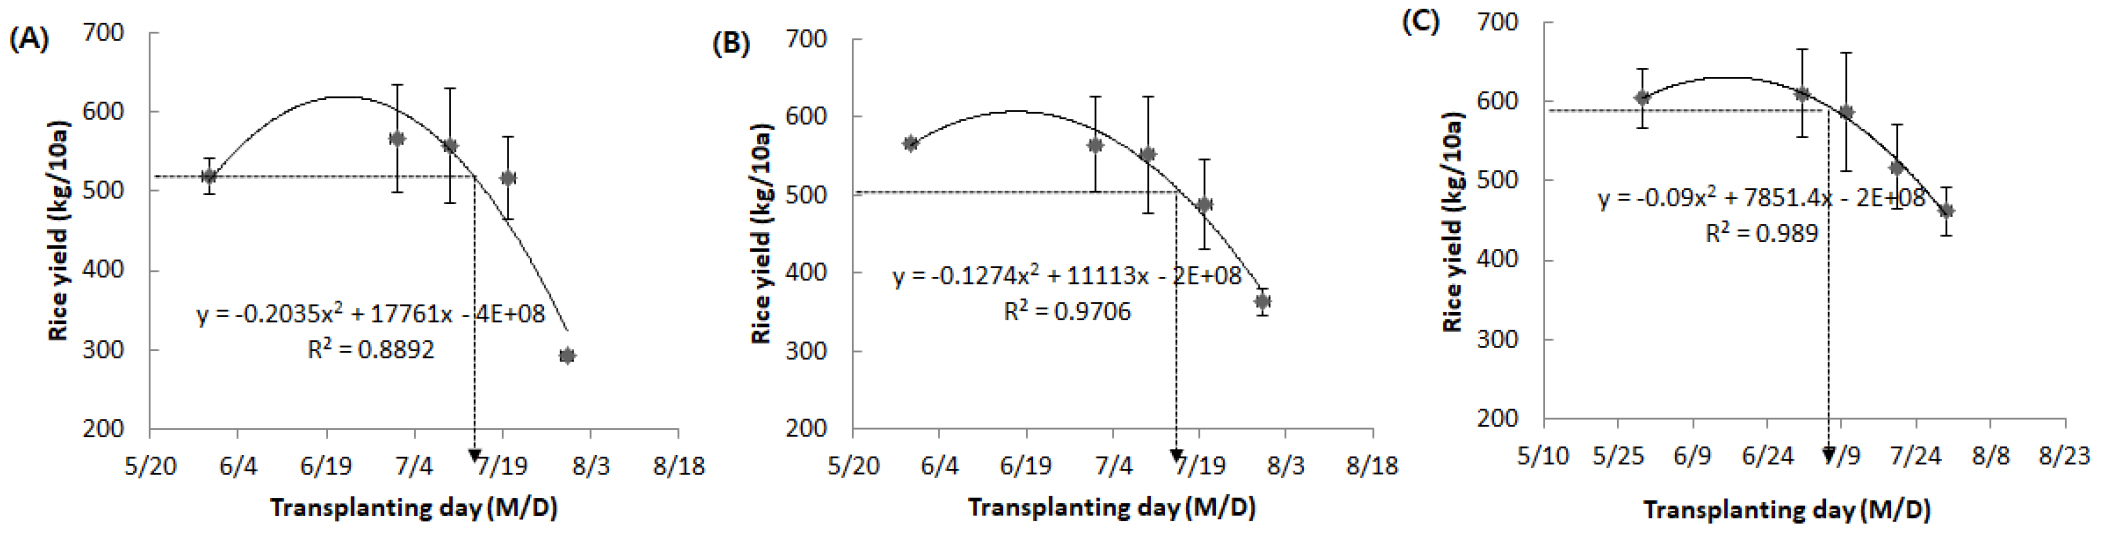
Table 2.
Changes in air temperature and sunshine during the growing period of different mature rice varieties by transplanting time.
| Variety |
Transplanting time (M.D) | Before heading | 45 days after heading | ||||||
|
Mean temp. (℃) |
Accumulative temp. (℃) |
Sunshine (h/d) |
Accumulative sunshine (h) |
Mean temp (℃) |
Accumulative temp. (℃) |
Sunshine (h/d) |
Accumulative sunshine (h) | ||
| Jopyeong | May 30th | 25.0 ± 0.5b† | 1,342 ± 52a | 6.4 ± 0.6ns | 341 ± 17ns | 26.9 ± 1.1a | 1,210 ± 48a | 6.9 ± 0.8ns | 314 ± 31ns |
| Jun 30th | 27.8 ± 0.7a | 1,289 ± 46b | 6.5 ± 1.2 | 300 ± 57 | 23.1 ± 0.2b | 1,040 ± 10b | 5.7 ± 1.3 | 254 ± 58 | |
| July 30th | 26.0 ± 1.0b | 1,165 ± 85c | 6.7 ± 0.3 | 302 ± 29 | 17.8 ± 0.7c | 804 ± 32c | 5.4 ± 1.4 | 242 ± 60 | |
| Haiami | May 30th | 26.1 ± 0.4b | 1,915 ± 81a | 6.8 ± 0.4ns | 499 ± 30a | 23.5 ± 0.2a | 1,056 ± 7a | 5.6 ± 0.7ns | 252 ± 31ns |
| Jun 30th | 27.7 ± 0.5a | 1,544 ± 38b | 6.7 ± 1.4 | 375 ± 82b | 21.3 ± 0.3b | 957 ± 16b | 5.0 ± 1.6 | 227 ± 70 | |
| July 30th | 25.8 ± 0.8b | 1,186 ± 28c | 6.8 ± 0.3 | 310 ± 11b | 17.7 ± 0.7c | 796 ± 30c | 5.3 ± 1.4 | 237 ± 61 | |
| Ilpum | May 30th | 26.1 ± 0.4b | 1,992 ± 29a | 6.7 ± 0.5ns | 514 ± 35a | 23.0 ± 0.2a | 1,037 ± 11a | 5.7 ± 1.2ns | 254 ± 63ns |
| Jun 30th | 27.7 ± 0.5a | 1,577 ± 33b | 6.8 ± 1.2 | 385 ± 64b | 21.1 ± 0.4b | 951 ± 17b | 5.0 ± 1.4 | 225 ± 64 | |
| July 30th | 26.0 ± 0.9b | 1,143 ± 47c | 6.8 ± 0.2 | 299 ± 18c | 17.0 ± 2.0c | 816 ± 23c | 5.2 ± 1.3 | 237 ± 57 | |
Table 3.
Effect of transplanting time on growth and yield components of different mature rice varieties.
| Variety |
Transplanting time (M.D) |
Culm length (cm) |
Panicle length (cm) |
Panicle number (ea/plant) |
Spikelet number (ea/panicle) |
Grain ripening (%) |
1,000 grain weight of brown rice (g) |
Rice yield (kg/10a) |
| Jopyeong | May 30th | 70 | 20 | 14 | 96ns† | 80.8a | 21.2c | 519b |
| Jun 30th | 75 | 20 | 15 | 96 | 80.9a | 23.3a | 567a | |
| July 30th | 66 | 20 | 15 | 98 | 50.9b | 22.4b | 292c | |
| Haiami | May 30th | 70 | 20 | 16 | 94ns | 81.6a | 22.9ns | 567a |
| Jun 30th | 71 | 20 | 15 | 91 | 84.6a | 23.5 | 565a | |
| July 30th | 62 | 19 | 16 | 83 | 65.1b | 22.6 | 364b | |
| Ilpum | May 30th | 68 | 20 | 15 | 104a | 84.5ns | 22.8ns | 604a |
| Jun 30th | 67 | 20 | 16 | 99a | 83.1 | 23.5 | 610a | |
| July 30th | 49 | 19 | 15 | 85b | 85.6 | 23.7 | 462b |
Milled rice quality and boiled rice palatability
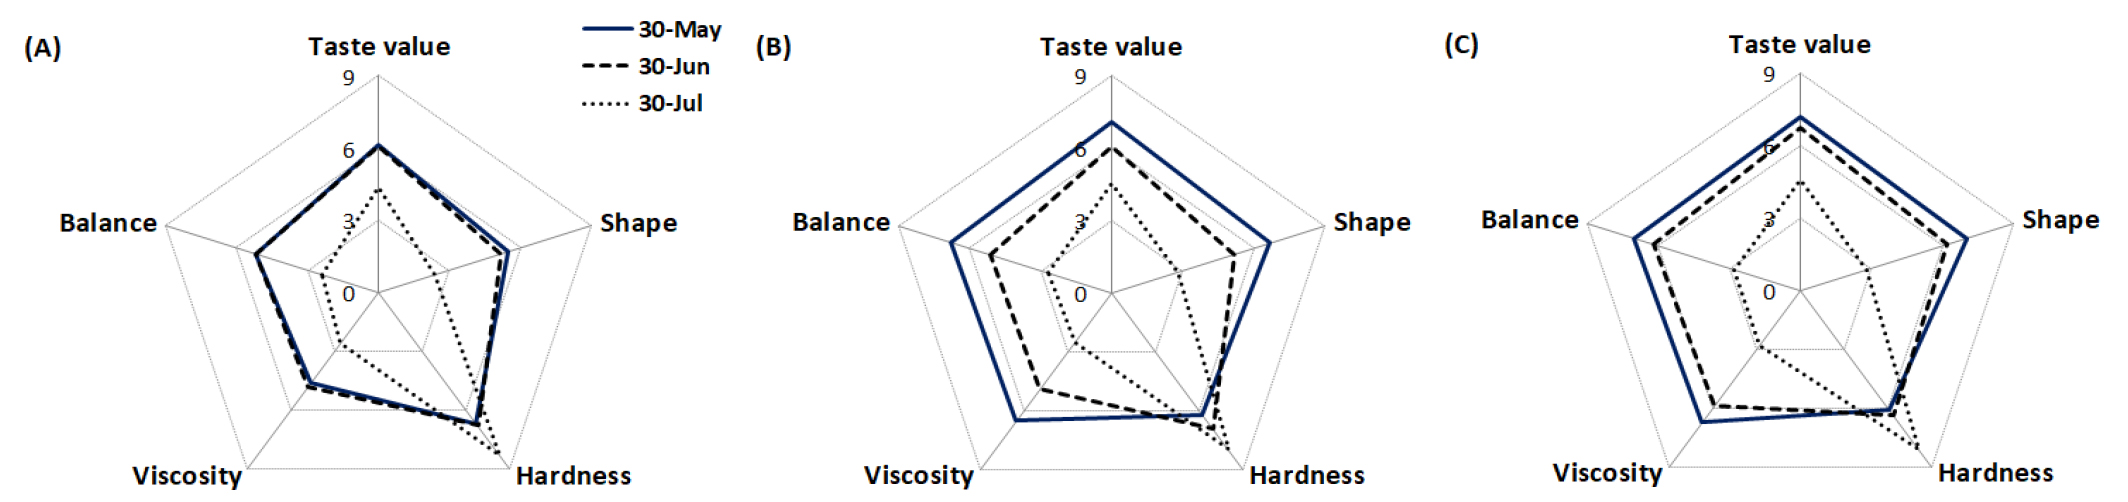
Decreased rice yield in late transplanting resulted in increased protein content in milled rice (Table 4). The rate of head rice was significantly lowered in the late planting on July 30th, and the level of rice taste evaluated as gloss value also decreased as the planting was delayed. The proper time to rice transplanting, considering the composition and milled rice quality, was late June for Jopyeong (early-maturing variety), and late May to early June for Haiami and Ilpum (mid-maturing and mid-late maturing varieties). The later the rice transplanting, the worse the shape of the boiled rice, the less viscous and the harder it became, and consequently the taste of the boiled rice decreased (Fig. 2).
Table 4.
Effect of transplanting time on protein contents and milled rice quality of different mature rice varieties.
| Variety |
Transplanting time (M.D) |
Protein (%) |
Head rice (%) | Witness |
Palatability (Toyo value) |
| Jopyeong | May 30th | 6.6b† | 75.1b | 53.8a | 65a |
| Jun 30th | 6.8b | 86.8a | 43.4b | 67a | |
| July 30th | 8.5a | 66.4c | 36.3c | 38b | |
| Haiami | May 30th | 6.0c | 90.0a | 42.4a | 74a |
| Jun 30th | 6.8b | 91.2a | 39.1a | 63b | |
| July 30th | 8.2a | 71.7b | 34.3b | 43c | |
| Ilpum | May 30th | 6.0c | 89.6a | 42.9ns | 75a |
| Jun 30th | 6.5b | 92.1a | 42.5 | 68b | |
| July 30th | 8.5a | 83.0b | 41.5 | 43c |
Granule size distribution
The size distribution of rice flour granules directly affects the quality of final products, including bread and noodles, due to changes in the gelatinization properties (Hallick & Kelly, 1992) and gel consistency (Cagampang et al., 1973) of rice flours (Evers & Stevens, 1985; Hsieh & Luh, 1991; Juliano et al., 1985). The particle size distribution of each variety is reported in Fig. 3, and Table 5. In the case of Jopyeong, early-maturing variety, the starch granule size increased as the transplanting time was delayed, and the opposite tendency was observed for mid-late maturing variety, Ilpum. Liu et al. (2017) reported high temperature increased the average diameter of starch granules and enhanced the proportion of large starch granules. However, only limited information is available on the effect of environmental temperature on the granule size distribution of rice grain starches.
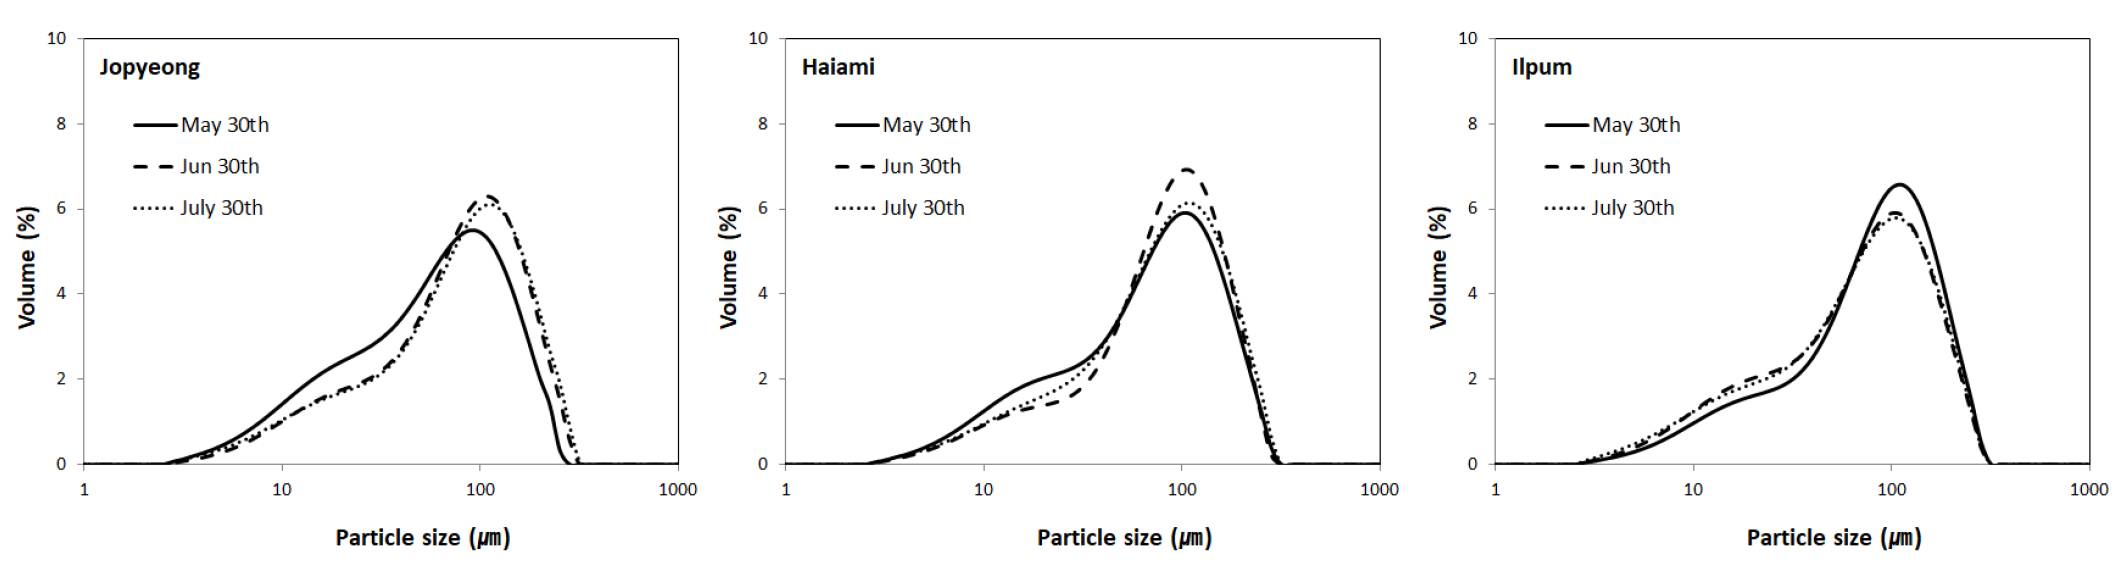
Table 5.
Effect of transplanting time on particle size distribution (D10, D50, and D90) of different mature rice varieties.
| Variety |
Transplanting time (M.D) | Particle size (μm) | ||
| D10† | D50 | D90 | ||
| Jopyeong | May 30th | 12.1b†† | 57.1b | 141.6c |
| Jun 30th | 15.4a | 75.1a | 166.7b | |
| July 30th | 14.6a | 76.4a | 173.5a | |
| Haiami | May 30th | 13.1b | 68.4c | 159.7c |
| Jun 30th | 16.5a | 78.3a | 162.5b | |
| July 30th | 15.6a | 75.4b | 169.9a | |
| Ilpum | May 30th | 15.8a | 78.2a | 168.1a |
| Jun 30th | 14.0b | 72.0b | 166.7a | |
| July 30th | 12.6c | 68.5c | 162.0b | |
Gelatinization properties
Pasting properties
The pasting properties of rice flour varied depending on the maturing type of variety and transplanting period (Fig. 4, Table 6). Pasting is the phenomenon following gelatinization in the dissolution of a starch and involves granular swelling, exudation of molecular components from the granules, and eventually, total disruption of the granules (Thomas & Atwell, 1999). In general, japonica-type varieties with a high taste value are known to have low pasting temperatures, high peak and BD, and low final viscosity (Choi et al., 2006). In all mature types of rice, the late transplanting resulted in a longer pasting time and a higher pasting temperature. In addition, the peak viscosity and BD were significantly lowered, and the SB was significantly increased, indicating that the overall pasting properties of rice flour were lowered.
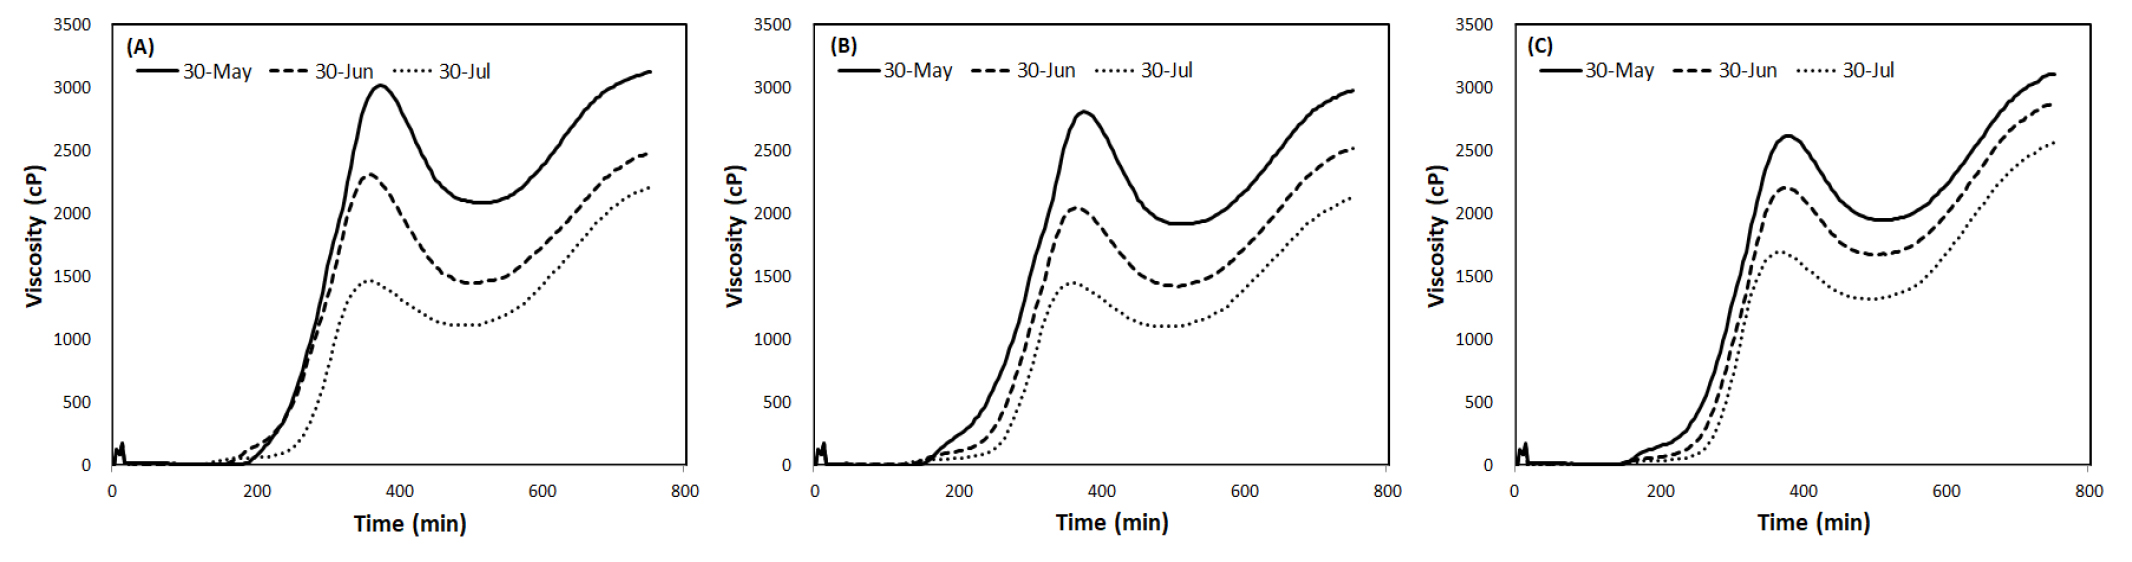
Table 6.
Effect of transplanting time on RVA pasting parameters of different mature rice varieties.
| Variety |
Transplanting time (M.D) |
Pasting time (min) |
Pasting temp. (℃) | Viscosity (cP) | ||||
| PV†† | HPV | CPV | BD | SB | ||||
| Jopyeong | May 30th | 3.3 ± 0.1c† | 77.6 ± 0.8c | 3,032 ± 51a | 2,081 ± 51a | 3,120 ± 27a | 951 ± 98a | 123 ± 57b |
| Jun 30th | 3.7 ± 0.0b | 81.6 ± 0.4b | 2,319 ± 41b | 1,446 ± 115b | 2,486 ± 90b | 872 ± 81a | 168 ± 58b | |
| July 30th | 4.3 ± 0.0a | 88.8 ± 0.5a | 1,468 ± 45c | 1,110 ± 49c | 2,216 ± 24c | 357 ± 6b | 749 ± 31a | |
| Haiami | May 30th | 3.0 ± 0.5c | 74.1 ± 6.3c | 2,814 ± 65a | 1,912 ± 72a | 2,976 ± 76a | 902 ± 41a | 162 ± 43c |
| Jun 30th | 4.0 ± 0.1b | 85.6 ± 0.9b | 2,073 ± 56b | 1,421 ± 148b | 2,520 ± 116b | 652 ± 92b | 447 ± 63b | |
| July 30th | 4.3 ± 0.0a | 88.6 ± 0.0a | 1,452 ± 66c | 1,099 ± 40c | 2,132 ± 83c | 352 ± 26c | 681 ± 26a | |
| Ilpum | May 30th | 3.9 ± 0.0c | 84.3 ± 0.5c | 2,628 ± 110a | 1,942 ± 76a | 3,107 ± 73a | 686 ± 105a | 479 ± 72c |
| Jun 30th | 4.1 ± 0.1b | 86.7 ± 1.0b | 2,216 ± 140b | 1,670 ± 163b | 2,880 ± 122b | 548 ± 73b | 664 ± 19b | |
| July 30th | 4.4 ± 0.0a | 90.1 ± 0.1a | 1,695 ± 71c | 1,317 ± 69c | 2,566 ± 37c | 379 ± 46c | 871 ± 42a | |
†All data represent the mean ± SD of three determinations. Different letters in the same column of each variety indicate significant differences among the samples according to Duncan’s multiple range test (P < 0.05).
††PV, HPV, and CPV are the peak viscosity, hot paste viscosity, and cool paste viscosity, respectively. BD and SB are the breakdown and setback, respectively. BD is equal to the difference between the PV and HPV, consistency is equal to the difference between the final viscosity and HPV, and SB is equal to the difference between the CPV and PV.
Thermal properties
Differential scanning calorimetry (DSC) was used for real-time heat flow analysis to determine how transplanting time affected the thermal properties of three different mature type rice variety (Fig. 5, Table 7). DSC is a thermal analysis that can thermodynamically describe the gelatinization process by measuring enthalpy from an endothermic reaction of gelatinization pasting because it can measure heat absorption or release by chemical reactions during phase changes, such as melting (Lee et al., 1993). The onset (To), peak (Tp), and conclusion temperature (Tc) of gelatinization of rice flour of late transplanted rice were lowered in all mature types of rice variety. In all three varieties, the gelatinization temperature measured by DSC and BD in RVA was lower as the transplanting time was delayed. Therefore, the late transplanting of rice resulted in the lower resistance to heat transfer during the gelatinization process. In the case of Ilpum, a mid-late maturing variety, the highest gelatinization enthalpy was shown in transplanting on May 30th, indicating that higher gelatinization enthalpy required more energy to disrupt (i.e., melt) starch crystallinity, which was significantly lowered when transplanting late.
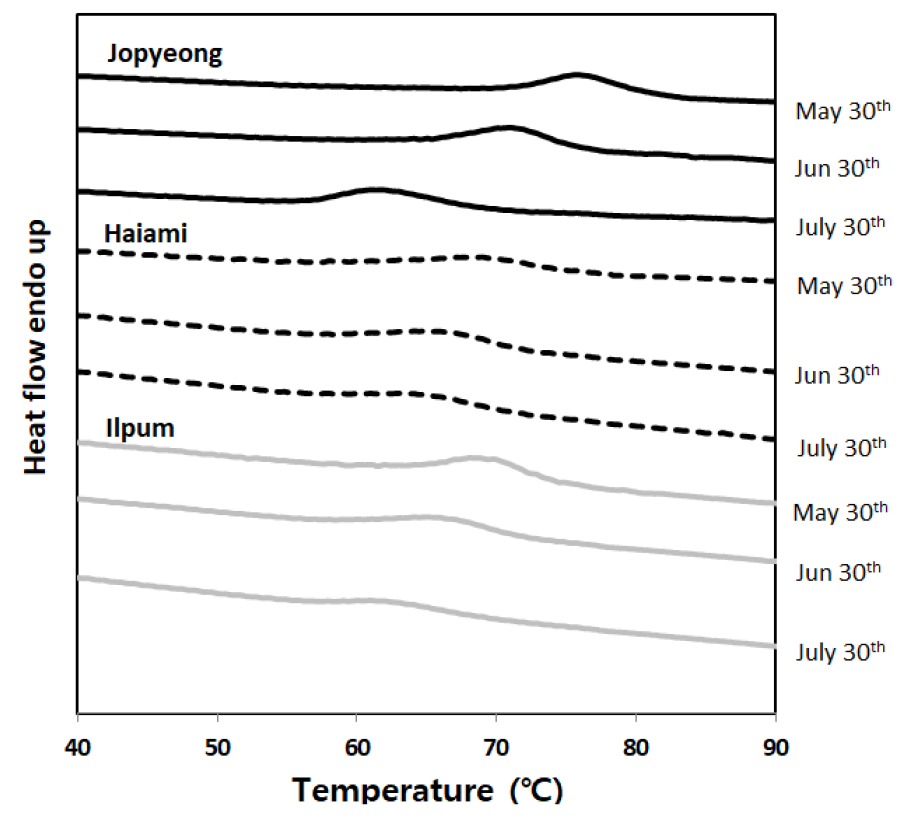
Table 7.
Effect of transplanting time on DSC parameters of different mature rice varieties.
| Variety |
Transplanting time (M.D) | To† (℃) | Tp (℃) | Tc (℃) | ⊿T (Tc-To) | ⊿H (J/g) |
| Jopyeong | May 30th | 71.8 ± 0.3a†† | 75.6 ± 0.0a | 80.1 ± 0.1a | 8.3 ± 0.4c | 1.8 ± 0.1ns |
| Jun 30th | 66.1 ± 0.1b | 70.8 ± 0.1b | 75.2 ± 0.3b | 9.0 ± 0.3b | 1.8 ± 0.1 | |
| July 30th | 57.0 ± 0.3c | 61.5 ± 0.5c | 67.6 ± 0.1c | 10.6 ± 0.3a | 1.8 ± 0.1 | |
| Haiami | May 30th | 63.4 ± 0.4a | 69.3 ± 0.5a | 75.5 ± 3.0a | 12.2 ± 2.6a | 1.9 ± 0.7ns |
| Jun 30th | 59.7 ± 1.6b | 66.4 ± 0.6b | 70.7 ± 0.3b | 11.0 ± 1.9ab | 1.4 ± 0.0 | |
| July 30th | 55.2 ± 0.1c | 59.8 ± 0.0c | 65.9 ± 0.1c | 10.7 ± 0.9b | 1.3 ± 0.0 | |
| Ilpum | May 30th | 64.5 ± 0.7a | 69.4 ± 0.4a | 73.3 ± 0.7a | 8.8 ± 1.2ab | 2.2 ± 0.2a |
| Jun 30th | 61.3 ± 0.5b | 66.3 ± 0.6b | 70.5 ± 0.3b | 9.2 ± 0.7a | 1.2 ± 0.1b | |
| July 30th | 60.0 ± 2.1b | 64.4 ± 2.8b | 67.2 ± 1.0c | 7.2 ± 1.2b | 1.2 ± 0.2b |
Physicochemical properties of starch
Amylopectin branch-chain-length distribution
Amylopectin also plays a substantial role in the process of starch gelatinization and retrogradation. In the case of Jopyeong, an early-maturing rice variety, the distribution of amylopectin short chains increased as transplanting was delayed, and in the case of Hiami, a mid-maturing rice variety, there was no significant difference in the distribution of amylopectin chain lengths according to the transplanting time. In the case of Ilpum, a mid-late maturing rice variety, the distribution of amylopectin short chains tended to increase markedly when rice was transplanted on June 30th (Table 8, Fig. 6). Studies suggest a bimodal size distribution of polymer chains into small and large chains (Hizukuri, 1986; Robin, 1974). The small chains have an average degree of polymerization (DP) of approximately 15, whereas the larger chains have approximately 45. This unique configuration contributes to the crystalline mature of amylopectin and an ordered arrangement of amylopectin molecules within the starch granule. Numerous studies showed that short amylopectin A chain (DP 6-12) was negatively correlated to the gelatinization temperature (To, Tp, Tc) and enthalpy (ΔHg) during flour gelatinization (Nakamura et al., 2002; Vandeputte et al., 2003), while the long amylopectin chains exhibited the opposite trends (Jane et al., 1999).

Table 8.
Effect of transplanting time on the chain-length distribution of amylopectin of rice starch of different mature rice varieties.
X-ray diffraction (XRD) analysis
X-ray diffraction (XRD) is used to compare the crystallinity of starch granules, in other words to analyze the cluster structure crystallinity of amylopectin. Rice starch granules showed strong peaks near the diffraction angles of 15°, 17°-18°, and 22°-23°. These results consist with the A-type peak pattern known to have a compact structure and low moisture content (Imberty et al., 1991). In three varieties used in the test, there was no change in the crystal structure of rice starch according to the transplanting period (Fig. 7). Relative crystallinity was estimated as the ratio of the peak areas to the total diffractogram area, which is the sum of peak areas and amorphous area (Chen et al., 2010). Jopyeong, an early-maturing variety, and Ilpum, a mid-late maturing variety, exhibited a relatively higher degree of ctystallinity than Hiami, a mid-maturing variety. In case of Hiami and Ilpum variety, the relative crystallinity (RC) degree decreased when transplanted late (Table 9). You et al. (2015) reported that the presence of short chains (DP 6-12) in amylopectin led to a decrease in crystallinity. Consistent with these reports, a negative association between RC of rice starch and the proportion of amylopectin short chain (DP 6-12) due to late transplanting was observed in this study (Table 8).

Table 9.
Effect of transplanting time on relative crystallinity and the ratio of absorbance at 1047/1022 cm-1 of different mature rice varieties.
| Variety |
Transplanting time (M.D) |
Relative crystallinity† (%) |
IR ratio of 1047/1022cm-1 |
| Jopyeong | May 30th | 41.6b†† | 1.55 ± 0.057b |
| Jun 30th | 48.0a | 1.58 ± 0.020ab | |
| July 30th | 38.1c | 1.62 ± 0.012a | |
| Haiami | May 30th | 36.3a | 1.52 ± 0.064b |
| Jun 30th | 35.7a | 1.56 ± 0.042b | |
| July 30th | 30.4b | 1.64 ± 0.047a | |
| Ilpum | May 30th | 42.4a | 1.60 ± 0.040ns |
| Jun 30th | 35.5b | 1.58 ± 0.045 | |
| July 30th | 35.9b | 1.60 ± 0.033 |
Correlation between ripening temperature and rice quality, starch characteristics
The temperature decrease during the ripening period due to the late transplanting (Table 2) had a significant effect on rice yield, quality, and starch characteristics (Tables 10 and 11). The protein content and gelatinization temperature were significantly increased due to the decrease in average temperature during to ripening period by late transplanting. In starch gelatinization characteristics, peak viscosity and BD were lowered while SB was increased. The distribution of amylopectin short chains (DP6-12) tended to increase in late transplanting in Jopyeong, an early maturing variety, and Haiami, a mid-maturing variety.
Table 10.
Correlation of rice yield and quality with temperature during the ripening stage.
| Variety | Grain ripening | Milled rice yield | Rice protein | Palatability (Toyo) |
| Jopyeong | 0.91† | 0.83 | -0.95 | 0.88 |
| Haiami | 0.86 | 0.93 | -1.00***†† | 1.00* |
| Ilpum | -0.62* | 0.94 | -0.99* | 0.99 |
Table 11.
Correlation of rice starch characteristics with temperature during the ripening stage.
| Variety |
Particle size (D50) | RVA pasting parameters |
Amylopectin (DP6 - 12) |
Relative crystallinity | |||
| PT† | PV | BD | SB | ||||
| Jopyeong | -0.85†† | -1.00* | 1.00 | 0.95 | -0.93 | -0.99* | 0.44 |
| Haiami | -0.58 | -0.89 | 0.98 | 1.00 | -0.98 | -0.93* | 0.96 |
| Ilpum | 0.93 | -0.99** | 0.99 | 0.99 | -0.98 | 0.03 | 0.71 |