


Oat (Avena sativa L.) grains have various uses including as animal feed, human food and in health care. However, the cultivation area of oats in the world is smaller than for other cereal crops such as wheat, barley and corn (Koehler & Wieser, 2013). This is maybe owing to the lower yield of oats compared to the other cereals (Brand et al., 2003). Oat resistant to wet and acidic soil far better than other cereals, and demand less chemical fertilizers (Givens et al., 2004). In consequence, their production costs may be similar to other crops such as wheat or barley. Since 2006 in Korea, oat has been cultivated in Jeong-up City to large-scale, in which yield production account for up to 70% of the total.
There is two eco-types recognized as hulled and de-hulled characteristic in oat. Compared with two eco-types, hulled oat has strong merits for yield and stability in cultivation except milling properties. Oat takes many healthy beneficial components of the diet for humans and animals which can draw consumer attention. It has been accepted as Top 10 Super Foods by the Food and Drug Administration in the USA because the (1-3)(1-4)-β-glucan polysaccharide presents, lowering cholesterol levels, coronary heart disease and type 2 diabetes (Anon 1997; Liu et al., 2000). Also, it contains a high percentage of lipids, especially unsaturated fatty acid (Peterson, 1998) which is used to assess the quality of oat products and consumer preference. So, these factors have made oat appealing for the development of new foods and techniques.
Oat has been mainly used in several forms such as rolled, flaked and flour. After roasting, milling to flours allows lipids and enzymes to rea ct and release free fatty acids (FFA), which are much more susceptible to lipid oxidation than the original lipids. And phase transition and melting of original materials could occurs during the heat- treatment process (Kim et al., 1999b). There have been some studies on processing research of cereals (Yoon and Kim., 1989; Lee et al., 2009), but less investigation results considering phase transition and melting point from crops. The melting point, being possibility of phase transition, of various components such as vitamin C, carbohydrate, dietary fiber and β-glucan of plants is 192°C, 138°C, 90°C and 180°C respectively.
Therefore, the aim of this study was to evaluate the influence of various roasting temperatures on domestic covered and naked oat flour for their enhanced-processing utilization.
MATERIALS & METHODS
Materials
The oat samples were of two cultivars (Choyang and Samhan), mostly grown at the whole Jeollabuk-do Province, Korea. So, two oat cultivars of Choyang (De-hulled oat, The following is written in DO) and Samhan (Hulled oat, The following is written in HO) was used as materials, which were harvested in the 2015 growing season. The oats were heated at different temperatures of 0, 80, 120, 160 and 200°C for 5min to begin with, and under the previous same temperature for 10min at the second times. Based on the different kinds of previous results (Lee et al., 2013; Lee et al., 2009), we slightly applied the 15 minutes to roast oat. Oats grains were ground in a hammer mill equipped with a 80 mesh screen, and the oat flour was stored at 4 degree Celsius for the analysis.
Moisture content and Flour morphology
The moisture content was determined by using a hygrometer (Kett Electric Laboratory PB-1D2, Kett CO., Ltd., Japan). About 1/2 gram of flour was placed in a volumetric container and measured. The morphology of the flour particles was studied with a light microscope (ZEISS AX10 Imager A2, Germany). A thin layer of the flour was prepared on a slide. The flours were photographed using a Nikon camera attached to the microscope.
Determination of pH
The pH values of flours were determined, based on the use of a homogenate prepared with 1g of flour samples and 5 ml of distilled water, using a digital pH meter (Seven Excellence pH, Mettler-toledo AG, Schwerzenbach, Switzerland) equipped with an electrode calibrated with phosphate buffer at pH 4.0 and pH, 7.0 at ambient temperature.
Determination of flour color
The color of oat flour was measured as b* values using a colorimeter (Minolta Chroma Meter CM-3500d, Minolta Co., Ltd., Ramcy, NJ, USA) which was calibrated with a standard plate. The flour (3g) was put into Petri dish of 4.5 cm diameter, the surface color was measured three times for each sample and mean values were used.
Determination of total polyphenols and flavonoid
Total polyphenols content was determined using Folin- Ciocalteu Method (Singleton et al., 1999). The 0.5 ml lyophilized polyphenols solution dissolved in 50% ethanol was diluted with 0.5 ml deionized water, and added to 1 ml Folin-Ciocalteu’s solution (1:10 dilution of Folin-Ciocalteu’s phenol reagent with deionized water). After 5 min, 3 ml of Na2CO3 (1mol/L) was added followed by an incubation at 25°C for 15 min. The absorbance was measured at 725 nm and the results were expressed as mg of gallic acid equivalent per mg of total polyphenols (five points from 0 ㎍/ml to 250 ㎍/ml gallic acid in 50% ethanol were used as standard curve). Total flavonoid content was determined by a colorimetric method described previously and modified in our laboratory (Adom et al., 2005). Aliquots of extracts (100 ㎕) were reacted with Diethylene glycol (150 ㎕). After 1 min, a 1N NaOH (20 ㎕) was added and incubated for one hour at 37°C. The absorbance was measured at 420 nm and compared to that of rutin standards (0~250 ㎍/ml). Flavonoid content of the sample was expressed as mg of rutin eq./g DW.
Determination of nutrients of flours
Total nitrogen content in flours was determined by Kjeldahl method using a Kieltec analysister (Foss Tecator AB, Höganäs, Sweden) and a conversion factor was multiplied to 5.83 to estimate the protein content. The β-glucan content was measured using a Mixed-Linkage Beta-Glucan Assay Kit (Megazyme international Ireland Limited 2006) by the AOAC Official Method 995.16. The chemical composition of oats was determined in triplicate for each oat samples, and then all results were reported on a dry weight basis.
2-Thiobarbituric acid reactive substances (TBARS) value
The amount of TBARS was measured by the modified method of Buege and Aust (1978). One gram of sample was homogenized with 15 mlof distilled water for 30 s, after which 2 ml of homogenate was placed in a test tube, and 2 ml of the TBA reagent was added and mixed with the homogenate. The mixture was then incubated in a 95 °C water bath for 15 min, to allow for color development. The sample was cooled and then centrifuged for 15 min at 3,000 rpm. The absorbance values of the reaction solution and reagent blank were recorded at 531 nm.
Sensory evaluation
On the 10th day of storage of the flours, sensory evaluation was performed by 6 panelists who were trained using the guidelines and procedure. One gram of sample was homogenized with 5 ml of distilled water for 10 min and served to the panels. Samples were evaluated for color, smell, flavor, and overall preference, using a five-point scale method (1 point = extremely unsatisfactory, 5 point = extremely satisfactory).
RESULTS AND DISCUSSION
Moisture content
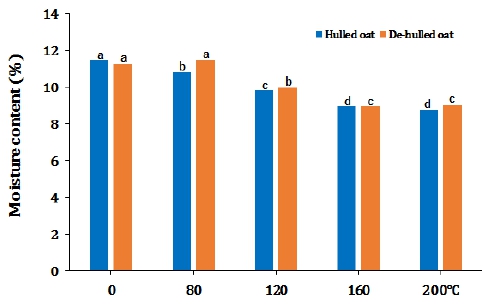
The moisture content of covered oat and naked oat before heat treatment was nearly same as 11.7% and 11.4%, respectively. The one in the oat samples was influenced by heat conditions (Fig. 1). It was decreased in proportion to temperature increases and showed same level as about 9% from 160°C among two oats.
Flour morphology
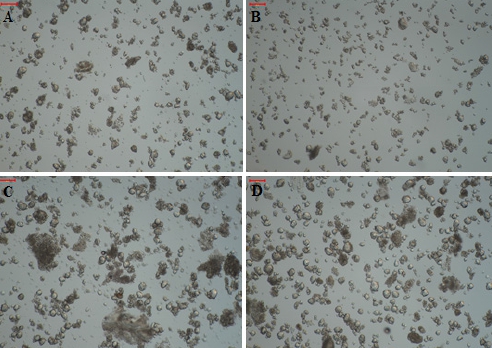
Photomicrographs of the flours were produced using a light microscope. Heat treatment of oat grain had significant effects on the size of flour particle (Fig. 2). Overall, oat was more broken finely with increasing temperature in HO and DO. The heat-treated ones were pounded to a fine power when compared with non-treated one. HO was more easily crushed than DO. It was reported that the fatty acid and tocopherol of DO was significant higher those that of HO (Ham et al., 2015; Lee et al., 2016). Thus, we thought that there was a significantly negative correlation between this element composition and grinding of oat.
Chemical properties of flour
The pH difference of flour was examined as shown in Fig. 3. The pH variation ranged from 6.2 to 6.6. Generally, its value increased up to 120°C and subsequent value statistically decreased. The result was consistent with tendency of previous study (Lee et al., 2009). These findings imply that more detail research will be needed to understand a reason of the phenomenon.
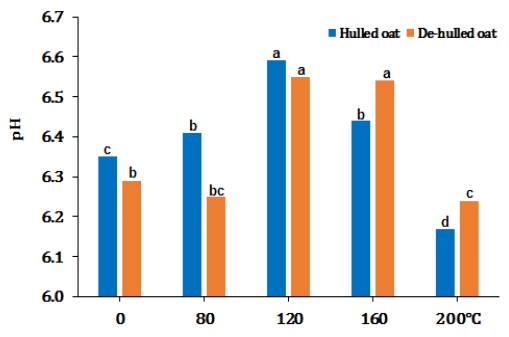
Fig. 3
Differences in pH of oat flour treated at 0 (non-heating treatment), 80, 120, 160 and 200°C for 15 min. Different letters for each oat cultivar at each temperature indicate a significant difference (p<0.05), as determined by Duncan’s multiple range test.The Hunter b value represented surface blackish color. The b values of HO, and DO at 0, 80, 120, 160, 180, and 200°C ranged from 13.3 to 17.9, and from 14.4 to 20.0, respectively (Fig. 4). Obviously, b value of DO was higher than that of HO. The b value of latter showed statistical same value from 0 until 160°C, while it increased sharply at high temperature, 200°C. Even though there was a difference in b value of DO from 0 until 160°C, frankly, the gap of figure was small, but showed the similar pattern such as HO at high temperature. Our present study indicates that a high temperature have attributed to producing carbonization process of substances, resulting in increasing b value. Some previous reported that there was a significantly positive correlation between increment of b value and decomposition of substances, such as fatty acid (Lee et al., 2013; Kim & Kim. 1996).
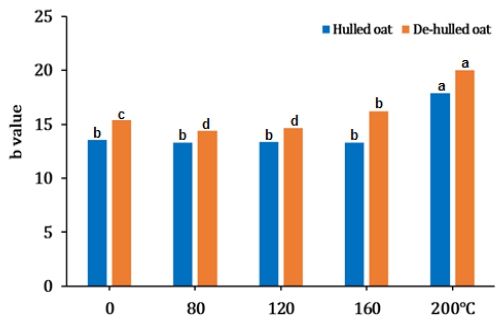
Fig. 4
Differences in color (b*) of oat flour treated at 0 (non-heating treatment), 80, 120, 160 and 200°C for 15 min. Different letters for each oat cultivar at each temperature indicate a significant difference (p<0.05), as determined by Duncan’s multiple range test.The polyphenol content ranged 1.47 to 2.11 mg/g DW. Comparing polyphenol content of HO and DO according to heat treatment, its content was decreased significantly (p<0.05) with heat increasing (Fig. 5). The former’s polyphenol content showed statistically identical gap among heat treatment plots, while the latter’s one was declined with roasting temperature being increased. At temperature increased beyond 120°C, the polyphenol content of HO was higher than that of DO as opposed to low temperature from 0 to 80°C. Previous study showed high level of polyphenol contents in DO as compared with HO (Ham et al., 2015). In this study, its content was declined after heat treatment, but other many studies reported its content increasing after heat treatment due to Maillard reaction produced by reaction of other elements such as amino acid and peptide (Francisco and Resurreccion, 2009; Ross et al., 2011). We thought that when all results mentioned earlier considered, the difference of compositional phenolic acid depending on heat reaction among cultivars caused a significant change of polyphenol content after heat treatment.
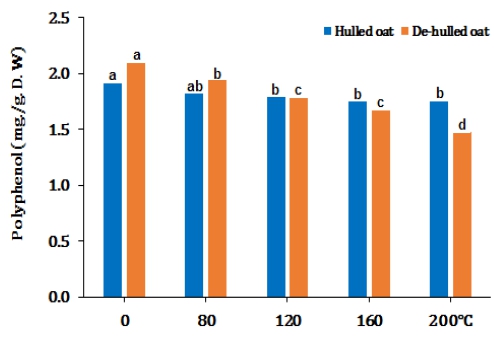
Fig. 5
Differences in polyphenol content of oat flour treated at 0 (non-heating treatment), 80, 120, 160 and 200°C for 15 min. Different letters for each oat cultivar at each temperature indicate a significant difference (p<0.05), as determined by Duncan’s multiple range test.The flavonoid is polyphenol compounds including anthocyanidines, flavonols, flavones and cathechins flavanones which widely exist in nature. The range of flavonoid content was 0.5~0.71 mg/g DW (Fig. 6). The HO’s flavonoid contents were significantly declined at a specimen treated by 80°C and increased from 120 up to 200°C compared with control. Those of DO were significantly climbed up to 160°C (p<0.05) and decreased at 200°C. The result of its contents was consistent with that of previous studies (Kwak et al., 2013; Woo et al., 2010). Some study indicated that the flavonoid took different component composition according to cultivar and each component differently reacted to heat, resulting in different flavonoid content (Francisco and Resurreccion, 2009; Kwak et al., 2013).
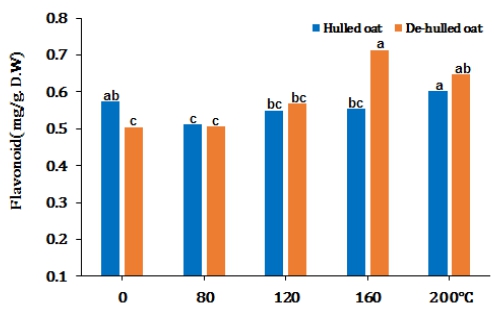
Fig. 6
Differences in flavonoid content of oat flour treated at 0 (non-heating treatment), 80, 120, 160 and 200°C for 15 min. Different letters for each oat cultivar at each temperature indicate a significant difference (p<0.05), as determined by Duncan’s multiple range test.The protein contents were influenced by heat treatment (Fig. 7). Oat’s one showed a range of 11.2 to 14.9% depending on heat treatment. When compared HO and DO in protein content, HO’s one was higher than that of DO. Findings showed that the protein level of HO at 80°C was slightly decreased, but increased from 120 to 200°C as compared with 0°C. As for DO’s protein levels, that were statistically (p<0.05) increased from 80 to 200°C. The result was same with another research’s one being in comparison of protein level with Choyang and Samhan (Lee et al., 2016). Kim et al. (1999a) indicated that the protein content of sesame was increased after roasting at 121°C, and its content of soybean was decreased at high temperature of 200°C as compared with fresh flour (Shin et al., 2014). Previous study reported a dimerization of protein at a suitable roasting temperature has contributed to its increase and a protein denatured at high temperature developed a protein-carbohydrate complex which was resulting in reducing protein content (Srikanta and Narasinga Rao. 1974).
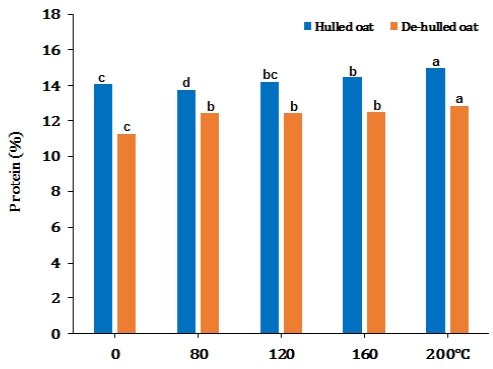
Fig. 7
Differences in protein content of oat flour treated at 0 (non-heating treatment), 80, 120, 160 and 200°C for 15 min. Different letters for each oat cultivar at each temperature indicate a significant difference (p<0.05), as determined by Duncan’s multiple range test.The β-glucan in oat has beneficial effects on lowering the serum low density-lipoprotein (LDL) cholesterol, a risk factor for cardiovascular disease. In the study, the β-glucan percentages were between 5.2% and 8.2% (Fig. 8), which is over the range of previous reported values for two cultivars : 3.5~4.1% (Lee et al., 2016; Genc et al., 2001). Result showed that β-glucan percentages of HO at 80°C was decreased sharply, and statistical equal level with fresh flour appeared from 120 to 200°C. About DO’s β-glucan levels, its levels were increased from 80 to 200°C over fresh flour. Another study has shown that β-glucan levels were increased up to some degree temperature and decreased sharply beyond the critical point (Lee et al., 2012). We thought that temperature over the critical point caused a phase transition of elements, resulting in reducing component content. As mentioned before, since the β-glucan has good effects on improving healthy, it is important to find optimum temperature being for nothing in its content to produce high-quality processed goods of oat.
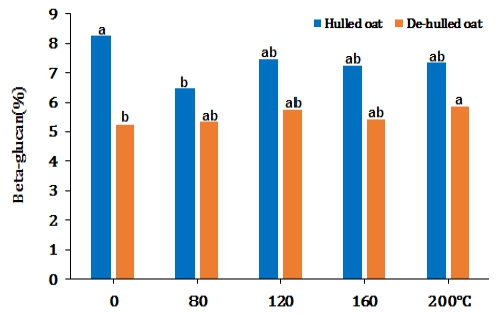
Fig. 8
Differences in β-glucan content of oat flour treated at 0 (non-heating treatment), 80, 120, 160 and 200°C for 15 min. Different letters for each oat cultivar at each temperature indicate a significant difference (p<0.05), as determined by Duncan’s multiple range test.A MDA, thiobarbituric acid reactive substances, induced in the middle of unsaturated fatty acid’s oxidation was seen red color by the fusion with 2-thiobarbituric acid. So. the MDA used to be able to be indicator of oxidation degree. The formation of MDA was statistically same from 0 until 160°C, but risen sharply at 200°C between all two oats (p<0.05) (Fig. 9). This findings is in agrement with other previous works (Falade and Oboh. 2015; Oboh et al., 2014), might be attributed to the breakdown of peroxidation to carbonyl and aldehyde compounds such as MDA, inducible heating or high temperature (Serjouie et al., 2010). MDA is able to form adducts with free amino acids and many more with proteins and this may induce profound alteration in their biochemical properties. Thus, it represents that roasting over 160°C at oats is not suitability for a development of proceeded goods.
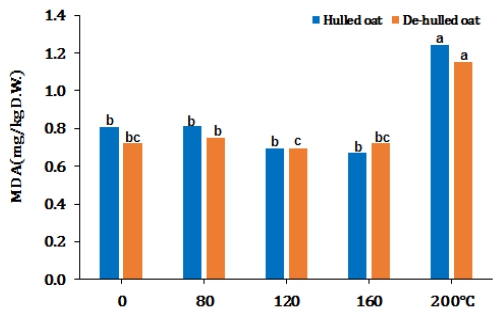
Fig. 9
Differences in MDA content of oat flour treated at 0 (non-heating treatment),, 80, 120, 160 and 200°C for 15 min. Different letters for each oat cultivar at each temperature indicate a significant difference (p<0.05), as determined by Duncan’s multiple range test.Variation in sensory characteristics such as color, taste, smell and overall preference was observed. The formation of a Maillard reaction product in the course of heating the oat added a unique flavor, which led to increase preference for the color, taste, smell, and overall preference. At all of sensory characteristics, DO’s index was higher than that of HO. Color, taste, smell, and overall preference index ranged 2.3~4.2, 1.8~4.2, 2.0~4.3, and 2.0~4.3, respectively. The specimens treated from 0°C to 120°C appeared same letter at 5% level by DMRT as opposite to the one treated from 160°C to 200°C with the “a” letter (Table 1). Lee et al. (2009) mentioned that heating the rice enhanced the sensory characteristics.
Table 1
Differences in sensory evaluation of roasted oat flour.
| Sensory characteristics | Temperature (°C) | Hulled oat | De-hulled oat |
|---|---|---|---|
| Color | 0 | 2.3c | 2.5b |
| 80 | 2.8bc | 2.7b | |
| 120 | 2.7bc | 2.8b | |
| 160 | 3.3ab | 3.7a | |
| 200 | 4.0a | 4.2a | |
| Taste | 0 | 2.3b | 1.8b |
| 80 | 2.2b | 1.7b | |
| 120 | 2.7b | 2.3b | |
| 160 | 3.7a | 3.8a | |
| 200 | 3.7a | 4.2a | |
| Smell | 0 | 2.2b | 2.0c |
| 80 | 2.3b | 2.3c | |
| 120 | 2.8b | 3.2b | |
| 160 | 3.8a | 3.8ab | |
| 200 | 4.0a | 4.3a | |
| Overall preference | 0 | 2.0c | 2.0c |
| 80 | 2.2bc | 2.0c | |
| 120 | 2.8b | 2.8b | |
| 160 | 3.8a | 4.0a | |
| 200 | 4.0a | 4.3a |
All things considered including particle size, polyphenol, flavonoid, MDA, β-glucan content and sensory evaluation, a optimum temperature for roasting oat to develop processed goods was verified as about 160°C and 15 min. Our results indicate that roasting temperature must be controlled to produce high-quality processed goods of oat. Finally, we will make a point of producing various proceeded goods of oats based on the research’s results.