

INTRODUCTION
MATERIALS AND METHODS
Plant material and DNA extraction
Analysis of the CAPS markers
Data analysis
RESULTS
Genetic diversity
Population structure
DISCUSSION
INTRODUCTION
Peanut (Arachis hypogaea L.) is widely cultivated from tropical to temperate regions such as Africa, America and Asia with an annual production of about 42.4 million tons (FAO, 2020). It is also one of the main sources of cooking oil in the world, which contains 25% protein and 50% of oil. Peanut has a significant role in sustainable agriculture in terms of global food security and nutrition, fuel and energy, sustainable fertilization, and enhanced agricultural productivity as a rotation crop (Feng et al., 2012).
Cultivated peanut is allotetraploid (2n = 4× = 40, AABB) with a genome size of 2800 Mb/1C and the genome composition of cultivated peanut was known to have derived from a recent hybridization of A.duranensis (A subgenome) and A.ipaensis (B subgenome) (Smartt et al., 1978; Seijo et al., 2007; Robledo et al., 2009; Bertioli et al., 2016). The genetic diversity of cultivated peanut is extremely low because of the single recent polyploidization during domestication (Kim et al., 2017). Peanut subgenomes show a high similarity (Kottapalli et al., 2007; Khera et al., 2013) with an estimated repetition rate of 64%, which makes the assembly of peanut genome sequences extremely difficult (Dhillon et al., 1980; Temsch & Greilhuber, 2000; Bertioli et al., 2016). The genome sequences of the diploid ancestors (A.duranensis and A.ipaensis) of cultivated peanut were reported in 2016, which became the basis for understanding the genome of cultivated peanut (Ren et al., 2011). Recently, the reference sequence of cultivated peanut allotetraploid A. hypogaea genome was reported in 2019 and compared with the related diploid A.duranensis and A.ipaensis genomes. A total of 39,888 A subgenome genes and 41,526 B subgenome genes were annotated in the allotetraploid subgenomes (Chen et al., 2019).
Recently, next generation sequencing (NGS) technology has made significant progress and the sequencing cost has dropped sharply (Kim et al., 2017). In addition, the accuracy and productivity of sequencing data have indeed improved innovatively. In particular, NGS technologies such as De nove assembly and resequencing based on a variety of bioinformatics methods have enabled the production of large numbers of single nucleotide polymorphism (SNP) and simple sequence repeats (SSR) in complex genomes (Yang et al., 2012; Lee et al., 2015; Bertioli et al., 2016; Kang et al., 2016). Using NGS technology, high throughput genotyping was conducted by using double-digest restriction-site associated DNA sequencing (ddRADseq), a total of 14,663 SNPs were developed and used for the construction of a genetic linkage map in peanut cultivars (Zhou et al., 2014). Numerous SNP and CAPS markers have been developed from the re-sequencing of the two Korean peanut cultivars “K-OL” and “Pungan”, which means that the molecular marker information can provide valuable guidance and information for peanut breeding program (Kim et al., 2017).
Cleaved amplified polymorphic sequence (CAPS) is the combination of PCR amplification and restriction enzyme analysis, SNP occurs within the recognition site of a restriction enzyme. The digestion of PCR products can be carried out in laboratory with separation of the fragments in agarose gel. Because of the convenience of analysis, development of SNP-based markers such as CAPS has been widely carried out followed by NGS analysis, and the developed markers have been used to figure out genetic diversity or population structure in crops (Rasheed et al., 2017; Wang et al., 2017).
In this study, we aimed to evaluate genetic diversity and population structure in 96 peanut accessions derived from five different origins using the CAPS markers developed from re-sequencing of two Korean peanut cultivars
MATERIALS AND METHODS
Plant material and DNA extraction
A total of 96 peanut accessions obtained from the National Agrobiodiversity Center, Jeonju, Republic of Korea were used for the present study (Table 1). Ninety-six accessions were originally donated from five countries; two accessions from Peru (PRE), thirteen accessions from China (CHN), fifteen accessions from Argentina (ARG), 17 accessions from Brazil (BRA), and 49 accessions from Korea (KOR). In 2017, the accessions were planted in a greenhouse at Pusan National University, Miryang, Republic of Korea. A young leaf from each individual accession was collected to extract genomic DNA. Genomic DNA was extracted for each accession with the CetyltrimethylAmmonium Bromide (CTAB) protocol (Saghai-Maroof et al., 1984) with minor modifications. The quality and quantity of the extracted DNA were measured with a NanoDrop ND-1000 (Thermos Fisher Scientific Inc., USA) and electrophoresis on a 1% agarose gel. Final concentration of each DNA sample was adjusted to 30 ng/µl.
Table 1.
Information on the 96 peanut accessions used in the study.
| No | IT noa | Originb | Seed colorc | Varietyd | Growth habite | 100 swf | Seed sizeg |
| 1 | IT030843 | KOR | Tan | Landrace | Half erect | 51.50 | Middle |
| 2 | IT030923 | KOR | Red | Breeding line | Erect | 80.26 | Middle |
| 3 | IT030847 | KOR | Tan | Landrace | Half erect | 66.20 | Middle |
| 4 | IT030848 | KOR | Tan | Landrace | Erect | 79.78 | Middle |
| 5 | IT030851 | KOR | Tan | Landrace | Half erect | 77.60 | Middle |
| 6 | IT030858 | KOR | Tan | Landrace | Half erect | 64.40 | Middle |
| 7 | IT030859 | KOR | Tan | Landrace | Erect | 81.96 | Big |
| 8 | IT030862 | KOR | Tan | Landrace | Erect | 76.88 | Middle |
| 9 | IT030867 | KOR | Tan | Landrace | Half erect | 64.10 | Middle |
| 10 | IT030930 | KOR | Tan | Breeding line | Erect | 79.92 | Middle |
| 11 | IT030871 | KOR | Tan | Landrace | Half erect | 55.80 | Middle |
| 12 | IT030873 | KOR | Tan | Landrace | Spreading | 70.10 | Middle |
| 13 | IT030880 | KOR | Tan | Landrace | Half erect | 63.56 | Middle |
| 14 | IT030881 | KOR | Tan | Landrace | Half erect | 59.00 | Middle |
| 15 | IT030882 | KOR | Red | Landrace | Erect | 79.34 | Middle |
| 16 | IT030886 | KOR | Tan | Landrace | Erect | 35.84 | Small |
| 17 | IT030887 | KOR | Tan | Landrace | Erect | 42.44 | Small |
| 18 | IT030888 | KOR | Tan | Landrace | Erect | 39.80 | Small |
| 19 | IT030953 | KOR | Tan | Landrace | Erect | 41.30 | Small |
| 20 | IT030957 | KOR | Tan | Breeding line | Half erect | 53.90 | Middle |
| 21 | IT110193 | BRA | Tan | Unknown | Half erect | 29.80 | Small |
| 22 | IT110214 | KOR | Tan | Breeding line | Half erect | 70.00 | Middle |
| 23 | IT110222 | KOR | Tan | Cultivar | Half erect | 67.60 | Middle |
| 24 | IT110224 | KOR | Tan | Cultivar | Half erect | 50.40 | Middle |
| 25 | IT110233 | ARG | Tan | Unknown | Erect | 27.70 | Small |
| 26 | IT110243 | KOR | Tan | Landrace | Erect | 73.06 | Middle |
| 27 | IT110255 | KOR | Tan | Landrace | Half erect | 46.00 | Small |
| 28 | IT171378 | KOR | Tan | Breeding line | Erect | 94.98 | Big |
| 29 | IT172455 | ARG | Red | Unknown | Bunch | 47.05 | Middle |
| 30 | IT172482 | PER | Purple | Unknown | - | 58.10 | Middle |
| 31 | IT172547 | KOR | Light brown | Breeding line | Erect | 103.98 | Big |
| 32 | IT172656 | KOR | Light brown | Landrace | Erect | 85.30 | Big |
| 33 | IT172812 | KOR | Red | Cultivar | Erect | 101.74 | Big |
| 34 | IT181768 | KOR | Light brown | Breeding line | Erect | 94.03 | Big |
| 35 | IT030933 | KOR | Tan | Breeding line | Erect | 47.22 | Small |
| 36 | IT184874 | BRA | Red | Unknown | Erect | 31.90 | Small |
| 37 | IT184867 | ARG | Red | Unknown | Spreading | 32.50 | Small |
| 38 | IT184889 | BRA | Red | Unknown | Erect | 29.8 | Small |
| 39 | IT184896 | BRA | Red | Unknown | Spreading and Bunch/ Erect | 31.60 | Small |
| 40 | IT184903 | ARG | Purple | Unknown | Erect | 30.50 | Small |
| 41 | IT184910 | BRA | Red | Unknown | Erect | 35.10 | Small |
| 42 | IT184938 | CHN | Red | Unknown | - | 40.20 | Small |
| 43 | IT214799 | KOR | Light brown | Cultivar | Erect | 85.00 | Middle |
| 44 | IT185030 | CHN | Tan | Unknown | Erect | 45.30 | Small |
| 45 | IT185032 | CHN | Red | Unknown | Erect | 38.30 | Small |
| 46 | IT185076 | BRA | Red | Unknown | Erect | 86.90 | Big |
| 47 | IT191283 | BRA | Red | Unknown | Half erect | 50.30 | Middle |
| 48 | IT191288 | BRA | Red | Unknown | Half erect | 33.60 | Small |
| 49 | IT191293 | ARG | Red | Unknown | Half erect | 38.20 | Small |
| 50 | IT191295 | ARG | Red | Unknown | Half erect | 30.00 | Small |
| 51 | IT191315 | BRA | Red | Unknown | Half erect | 30.00 | Small |
| 52 | IT191436 | ARG | Red | Unknown | Half erect | 28.70 | Small |
| 53 | IT191437 | ARG | Red | Unknown | Half erect | 29.80 | Small |
| 54 | IT191441 | ARG | Red | Unknown | Erect | 39.50 | Small |
| 55 | IT191443 | ARG | Red | Unknown | Erect | 37.30 | Small |
| 56 | IT184876 | BRA | Red | Unknown | Erect | 34.40 | Small |
| 57 | IT191451 | CHN | Red | Unknown | Half erect | 32.80 | Small |
| 58 | IT191456 | BRA | Red | Unknown | Erect | 27.00 | Small |
| 59 | IT191504 | ARG | Red | Unknown | Erect | 28.40 | Small |
| 60 | IT191513 | BRA | Red | Unknown | Half erect | 27.10 | Small |
| 61 | IT191514 | BRA | Red | Unknown | Half erect | 26.40 | Small |
| 62 | IT191524 | BRA | Red | Unknown | Spreading | 43.20 | Small |
| 63 | IT191525 | BRA | Red | Unknown | Half erect | 31.70 | Small |
| 64 | IT191528 | BRA | Red | Unknown | Half erect | 30.50 | Small |
| 65 | IT191558 | CHN | Tan | Unknown | Erect | 46.00 | Small |
| 66 | IT191587 | CHN | Tan | Unknown | Erect | 45.70 | Small |
| 67 | IT196389 | CHN | Red | Unknown | Erect | 40.00 | Small |
| 68 | IT207327 | CHN | White | Unknown | Erect | 76.00 | Middle |
| 69 | IT213159 | KOR | Purple | Cultivar | Erect | 93.00 | Big |
| 70 | IT213160 | KOR | Light brown | Cultivar | Erect | 83.00 | Middle |
| 71 | IT213162 | KOR | Tan | Cultivar | Erect | 75.00 | Middle |
| 72 | IT214781 | KOR | Tan | Cultivar | Erect | 103.00 | Big |
| 73 | IT214787 | KOR | Purple | Cultivar | Erect | 99.00 | Big |
| 74 | IT214789 | KOR | Light brown | Cultivar | Erect | 96.00 | Big |
| 75 | IT214791 | KOR | Tan | Cultivar | Half erect | 103.00 | Big |
| 76 | IT214792 | KOR | Tan | Cultivar | Erect | 108.00 | Big |
| 77 | IT184886 | BRA | Red | Unknown | Erect | 32.60 | Small |
| 78 | IT184973 | CHN | Red | Unknown | Erect | 64.48 | Middle |
| 79 | IT214802 | KOR | Brown | Cultivar | Half erect | 118.00 | Big |
| 80 | IT214803 | KOR | Light brown | Cultivar | Erect | 99.00 | Big |
| 81 | IT191568 | CHN | Red | Unknown | Erect | 44.00 | Small |
| 82 | IT214793 | KOR | Tan | Cultivar | Erect | 80.00 | Big |
| 83 | IT214806 | KOR | Tan | Cultivar | Erect | 90.00 | Big |
| 84 | IT221533 | KOR | Brown | Cultivar | Erect | 101.00 | Big |
| 85 | IT221534 | KOR | Brown | Cultivar | Erect | 87.00 | Big |
| 86 | IT221535 | KOR | Purple | Cultivar | Erect | 90.00 | Big |
| 87 | IT267782 | ARG | White | Unknown | Erect | 33.00 | Small |
| 88 | IT267783 | ARG | Red | Unknown | Erect | 25.00 | Small |
| 89 | IT271343 | CHN | Red | Landrace | - | 67.00 | Middle |
| 90 | IT214795 | KOR | Tan | Cultivar | Erect | 79.00 | Big |
| 91 | IT271426 | ARG | Purple | Unknown | Erect | 58.00 | Middle |
| 92 | IT271431 | ARG | Purple | Unknown | Erect | 30.00 | Small |
| 93 | IT271463 | PER | Light brown | Unknown | Erect | 33.00 | Small |
| 94 | IT271494 | CHN | Red | Cultivar | - | 62.00 | Middle |
| 95 | IT271495 | CHN | Purple | Cultivar | - | 57.00 | Middle |
| 96 | IT271499 | KOR | Red | Landrace | Half erect | 69.00 | Middle |
Analysis of the CAPS markers
A total 30 CAPS markers were used to evaluate genetic diversity and population structure of the peanut accessions in the present study (Supplementary Table S1). The CAPS markers were derived from thirteen different chromosomes (A01, A03, A05, A06, A07, A06, A08; B01, B03, B04, B06, B07, B08). It has been confirmed that 28 of the CAPSs were in intergenic regions and two CAPSs were in coding regions in peanut genome (Kim et al., 2017).
Polymerase chain reaction (PCR) amplifications were conducted in 20 µL reactions containing 60 ng of template DNA, 5nM mixed Primer, 1X reaction buffer, 10mM dNTP, and 1.0 unit of Taq DNA polymerase (Gen-Script USA Inc., Piscataway, N.J., USA). PCR product was digested with enzyme (AseI, DraI, HpaII, MseI, MspI, PstI, Taq. I) (New England Biolabs, USA; Enzynomics, Republic of Korea) and incubated at T-100 thermal cycler (BIO-RAD, USA) using optimum enzyme cutting temperature for 1 h. PCR products and the restriction enzyme- digested PCR products were resolved on 1.5% agarose gels (Promega, USA) to detect the polymorphism.
Data analysis
UPGMA (Unweighted Pair Group Method with Arithmetic Mean) dendrogram was constructed using the MEGA 4 (Tamura et al., 2007). The bootstrap consensus tree inferred from 1000 replicates is taken to represent the evolutionary history of the accessions analyzed, and branches corresponding to partitions reproduced in less than 42 % bootstrap replicates collapsed (Felsenstein, 1985). The evolutionary distances were computed among the 96 accessions by using the Maximum Composite Likelihood method (Tamura et al., 2004).
The population structure of 96 peanut accessions was evaluated by Structure v2.3.4 software (https://web.stanford.edu/group/ pritchardlab/structure_software/release_versions/v2.3.4/html/structure.html) under the admixture model. Models were tested for K-values ranging from 1 to 15, with 3 independent runs per K value. To make a decision for the optimum number of K, delta K (ΔK) method was used the software online “harvester structure” (Evanno et al., 2005). Population structure and relationships were analyzed by principle coordinate analysis (PCoA) using software GenAlEx V6.503 (Peakall & Smouse, 2006).
For the estimation of genetic differentiation between subpopulations, the values of FST > 0.25 are taken to mean great differentiation between subpopulations; the range 0.15 to 0.25 indicates high differentiation; and the range 0.05 to 0.15 indicates moderate differentiation, while differentiation can negligible if FST < 0.05. Estimates of Genetic diversity indices were calculated for each locus using GeneAlEx 6.503. The genetic differentiation between individual accessions was calculated using the FST to evaluate the reduction in genotypic heterozygosity (Grasso et al., 2014).
RESULTS
Genetic diversity
The UPGMA tree placed the peanut accessions into two major clusters (Fig. 1), indicating that most accessions from Korea grouped in a cluster. The other cluster contained with accessions from other four origins and eight accessions collected from Korea show a small group in this cluster.
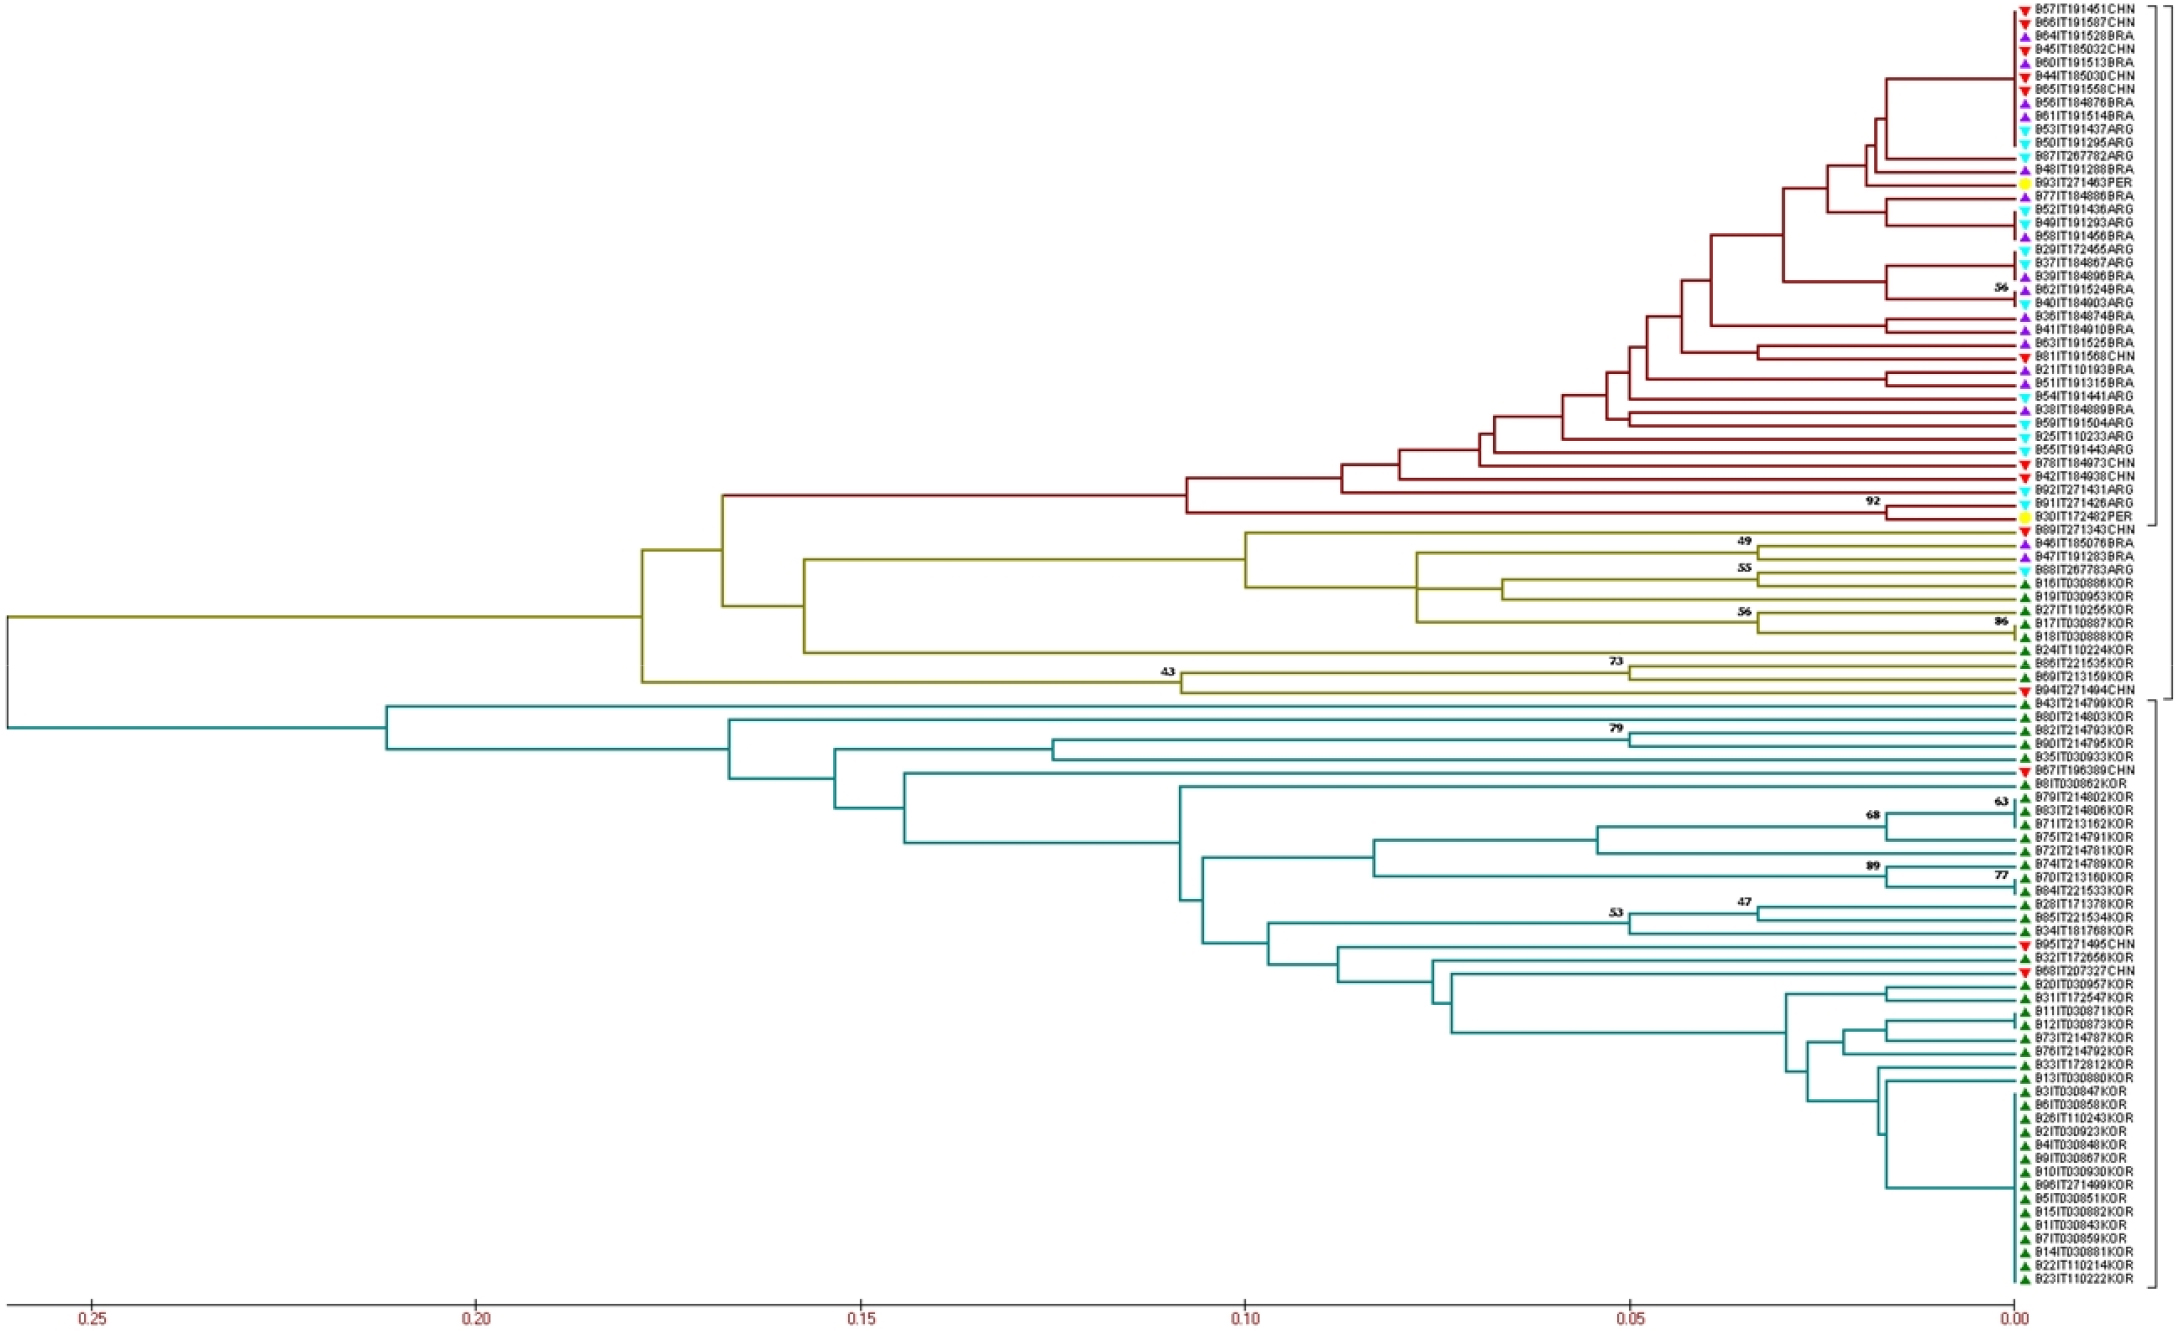
Fig. 1
Evaluation of evolutionary relationships among the 96 peanut accessions based on the 30 CAPS markers. The green mark indicates the genotypes from Korea; the blue mark indicates the genotypes from Argentina; the purple mark indicates the genotypes from Brazil; the red mark indicates the genotypes from China; and the yellow mark indicates the genotypes from Peru. The different colors of the branch represent different groups.
Accessions from BRA and ARG presented the FST values more than 0.25 compared to the KOR accessions (0.311 and 0.264, respectively) indicating the most significant differences between the accessions (Table 2). Accessions from KOR and CHN, KOR and PER, PER and BRA had FST values ranged from 0.15 to 0.25 showed a high differentiation. Accessions from BRA and CHN, ARG and CHN, ARG and PER, PER and CHN had FST values ranged from 0.15 to 0.25 presented moderate differentiation. Accessions from BRA and ARG had FST values less than 0.05 indicating that the differentiation could be negligible.
Table2.
Pairwise population FST values among five different origins.
| Origins† | KOR | BRA | ARG | CHN |
| BRA | 0.311 | - | ||
| ARG | 0.264 | 0.034 | - | |
| CHN | 0.159 | 0.083 | 0.056 | - |
| PER | 0.246 | 0.156 | 0.094 | 0.115 |
The value of the Nei’s genetic distance ranged from 0.012 to 0.437 (Table 3). The accessions from BRA and ARG presented the lowest genetic dissimilarity (0.012). The accessions from KOR and BRA presented the highest genetic dissimilarities (0.437). The highest genetic dissimilarities were observed accessions from KOR between other four origins while genetic dissimilarities of accessions from other four origins had less than 0.1.
Table 3.
Pairwise population matrix of Nei’s genetic distance among five different origins.
| Origins† | KOR | BRA | ARG | CHN |
| BRA | 0.437 | - | ||
| ARG | 0.390 | 0.012 | - | |
| CHN | 0.224 | 0.047 | 0.036 | - |
| PER | 0.284 | 0.083 | 0.051 | 0.071 |
The pattern of PCoA (Fig. 2) was similar with the results of the UPGMA tree. The first two axes accounted for 65.03% of the total variation, and the 96 accessions were divided into three broad groups across the first two axes. The first axes separate the KOR accessions into two parts. However, Korea accessions formed a less sticky block with the others. The intermixing of color across the coordinates, further support the UPGMA tree with SNP marker that there is no location-specific grouping (Singh et al., 2013) between accessions from BRA and ARG.
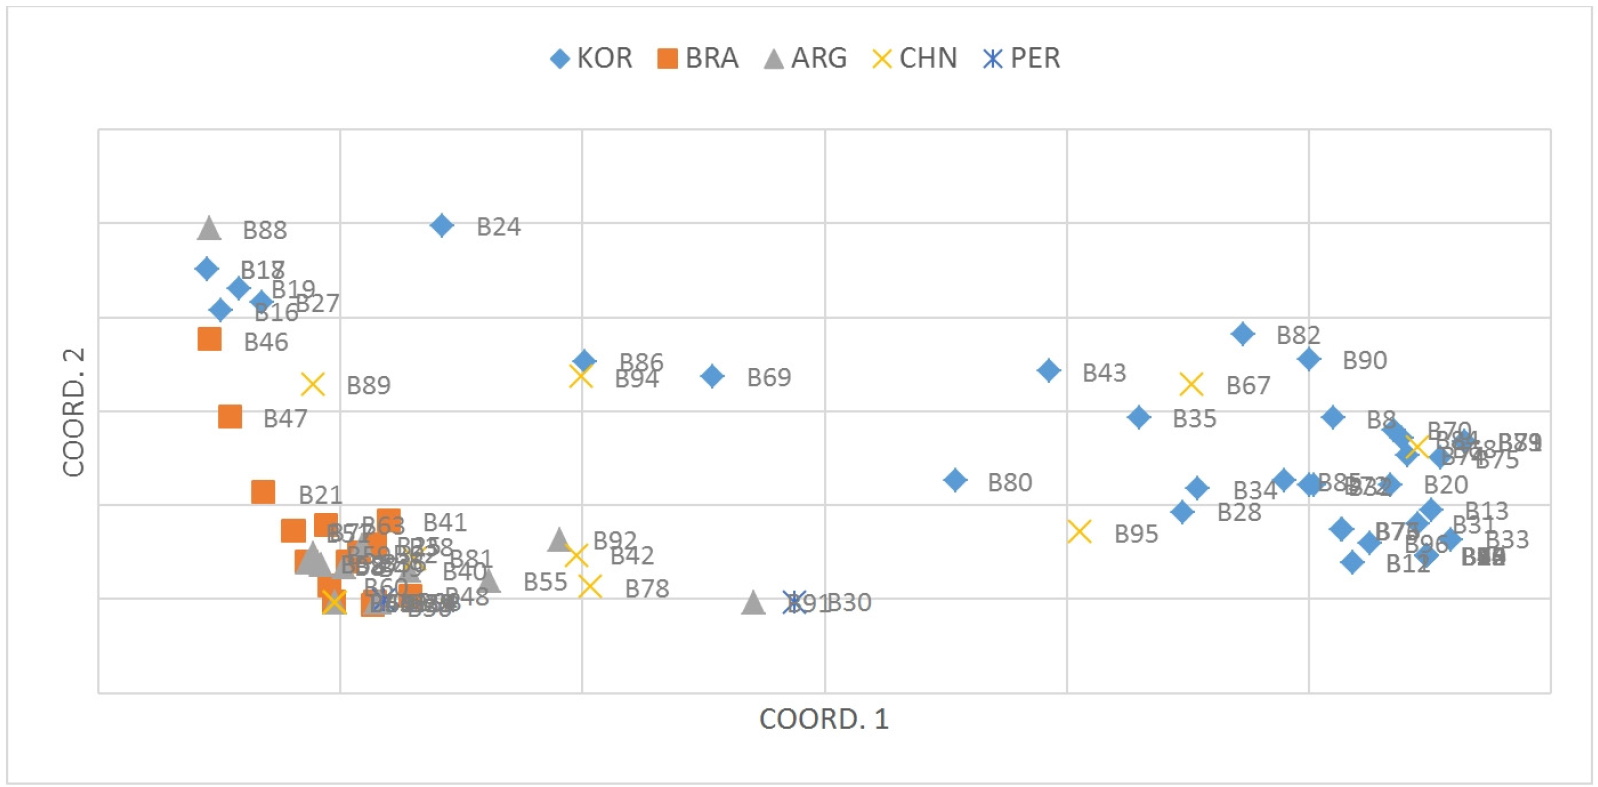
Fig. 2
Principal component analysis (PCoA) for the 96 peanut accessions based on the 30 CAPS markers; each point represents one accession and individuals are colored according to their origins. Coord.1 (49.86%) and Coord.2 (12.95%) refer to the first and second principal component, respectively. ARG is Argentina; BRA is Brazil; CHN is China; KOR is Korea; PER is Peru.
Genetic diversity indices including HO (observed heterozygosity), HE (expected heterozygosity), and the Fixation Index (F) were calculated (Table 4). For each group, the HO and HE calculated using all SNPs by observed genotype frequencies. The F values ranged from -1 to +1. Negative values indicate excess of heterozygosity. Values close to zero expected under random mating while a mass of positive values indicate inbreeding or undetected null alleles. For the 96 peanut individuals, mean HO ranged from 0.070 (KOR) to 0.084 (ARG). The lowest mean HE was found in the population from PER (0.121), whereas the highest was in the population from KOR (0.320). Across the origins, HO (0.079) was significantly less than HE (0.205).
Table 4.
Genetic diversity indices in five subpopulations.
| Origin | Na | Nab | Nec | Id | HOe | HEf | uHEg | Fh | %Pi |
| KOR | 49 | 1.967 | 1.505 | 0.492 | 0.070 | 0.320 | 0.324 | 0.828 | 96.67% |
| BRA | 17 | 1.500 | 1.214 | 0.206 | 0.078 | 0.130 | 0.134 | 0.552 | 50.00% |
| ARG | 15 | 1.733 | 1.244 | 0.282 | 0.084 | 0.170 | 0.176 | 0.684 | 73.33% |
| CHN | 13 | 1.867 | 1.467 | 0.430 | 0.077 | 0.282 | 0.293 | 0.813 | 86.67% |
| PER | 2. | 1.267 | 1.227 | 0.172 | 0.083 | 0.121 | 0.161 | 0.250 | 26.67% |
| Total | 19 | 1.667 | 1.331 | 0.316 | 0.079 | 0.205 | 0.218 | 0.705 | 66.67% |
Population structure
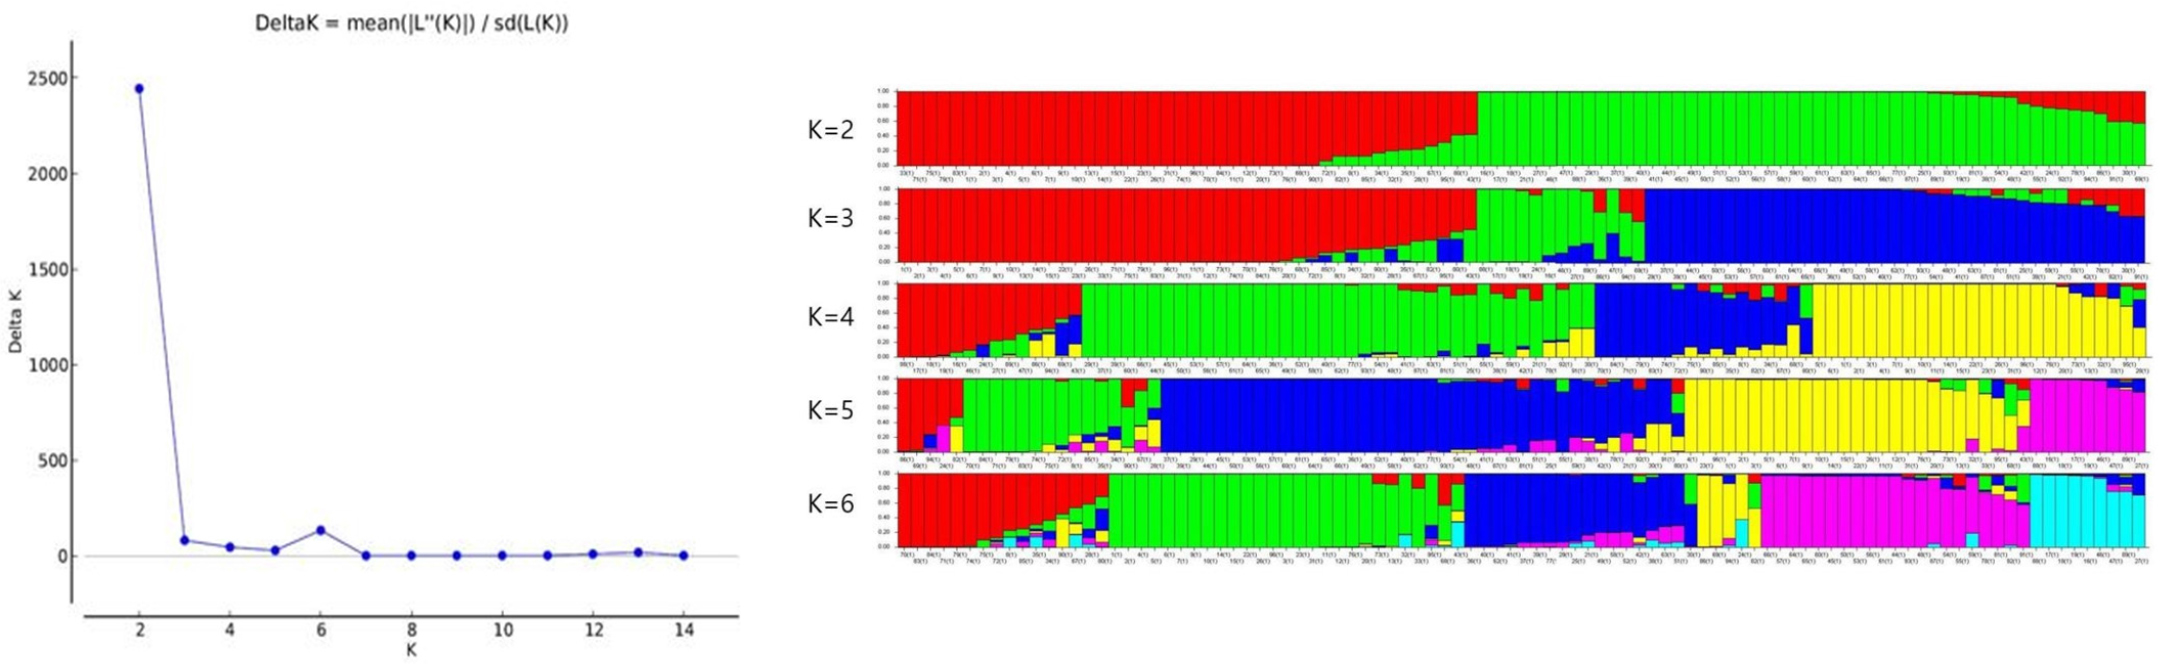
At K = 2, we found maximum Δk (Fig. 3A) values that were plotted against the K to confirm the number of populations. Another lower peak was shown at K = 6 (Fig. 3A). When most accessions divided into the two subpopulations (K = 2, Fig. 3B), a large portion of accessions from Korea belonged to one subgroup (red) while another subgroup (green) revealed features of accessions from other four origins. As we continue to divide subgroups carefully, there is a new division into the subgroups. The most divergent subgroups by origin were formed at K = 6, but all subgroups are mixed in origin. In the red, green, and yellow subpopulations, most accessions derived from KOR with only four accessions from CHN. However, the subpopulation labeled with dark blue were mainly from ARG and BRA, pink and light blue subpopulations mixed with different areas, which coincided with results of the UPGMA tree and PCoA.
DISCUSSION
Most crops including peanut have undergone a significant loss of genetic diversity during both the evolution and cultivation (Smýkal et al., 2018). The rich genetic diversity of genetic resources is a precondition for improvement in productivity and other goals in crop breeding programs. Genetic heterozygosity (H) known as genetic diversity could reflect the degree of genetic consistency of in the population (Tambasco-Talhari et al., 2005). The lower H values represent that the higher genetic consistency and the lower genetic variation in the population. In the present study, the HO was significantly lower than the HE regardless the origins. This result might be directly affected by low heterozygosity of the tested peanut accessions or a general characteristic of peanut species with low genetic diversity. Besides, the low genetic diversity in the peanut accessions might be results of long-term peanut germplasm collection conducting with a lack of understanding of the genetic background or too much emphasis on the phenotypic variations.
The genetic diversity of the 96 peanut accessions was analyzed by cluster analysis. According to the SNP marker data, the 96 accessions were divided into two subpopulations. Most of the analyzed germplasms come from KOR divided with other germplasms. Genotypes from other origins were mixed in the same group, in this group, some peanut accessions from Korea formed a small separate group. Although low genetic diversity in peanut germplasm has been reported, analyses for population structure and clustering indicated that clear genetic differentiation between germplasm from KOR and other four countries. The STRUCTURE analysis reveals the existence of two subpopulations consistent with the clustering results based on genetic diversity. Our study identified the genetic differentiation in the peanut accessions from the five origins and this result could provide fundamental and visible information for enhancing genetic diversity studies and for finding novel traits in peanut breeding programs.
According to the geographical origin of different peanut accessions, the origins of peanut accessions are divided into East Asia and South America. The East Asia section includes peanut accessions from China and South Korea, while the South America section includes peanut accessions from Argentina, Brazil and Peru. In terms of geographical distribution, the peanut accessions from China and South Korea are the closest, while the other accessions from Argentina, Brazil and Peru are the closest. The Fst values between ARG, BRA, CHN and PER were small, indicating that there was a small genetic differentiation between the four populations. However, the Fst value between KOR and ARG, BRA, CHN and PER is large, which indicates that the genetic distance between peanut varieties from Korea and those from ARG, BRA, CHN and PER is large, and there is a high genetic differentiation between populations, indicating that there is a significant difference between groups from Korea and other groups. Moreover, the Fst value between KOR and CHN was relatively small compared with that between KOR and ARG, BRA and PER, indicating that the genetic differentiation of peanut accessions in KOR and CHN was small. Geographically, it corresponds to the distribution characteristics of East Asia and South America. The long distance geographical separation of East Asia and South America is the reason for the high genetic diversity between KOR and South American peanut populations generally regarded as the origin of peanuts. According to the results of population structure, there are abundant genetic differences between peanut accessions from Korea and those from other sources, which may be the result of human selection, or the peanut accessions from Korea are excellent adapted to the local ecological environment. Also, it is necessary to introduce more peanut germplasm resources into Korean peanut accessions to expand the genetic diversity of Korean peanut accessions in future breeding programs.
In the latest research, peanuts made significant progress in the whole genome sequencing, providing a huge amount of molecular marker information and gene annotations, despite the complexity of genome of cultivated peanut (Bertioli et al., 2016). Especially, SNP markers have good genetic affinity and can directly reflect a genetic diversity in the accessions at the DNA sequence level (Ren et al., 2013). In this study, CAPS markers developed from SNPs clearly separated all accessions into the distinct subpopulations. Therefore, the use of molecular markers including CAPS might be a useful tool to determine genetic diversity and population structure in peanut.
In summary, this investigation about information on genetic diversity is helpful for developing appropriate scientific strategy for peanut breeding (Landjeva et al., 2006) and it can be a great tool for genotype selection in a breeding program. Because of the large size of genome in the peanut species, it is necessary to use molecular markers, and breeders can use the molecular marker data to select the required information in the absence of any pedigree information. The results obtained from this study showed that the successful application of SNP information derived from re-sequencing based on NGS technology, and this study also proved availability of the CAPS marker to figure out genetic diversity and population structure using 96 peanut accessions.
