


INTRODUCTION
MATERIALS AND METHODS
Material and experimental design
Starch isolation
Granule size analysis
Damaged starch quantification
Total amylose and protein contents
Starch pasting properties
Differential scanning calorimetry (DSC) analysis
X-ray diffraction and crystallinity analysis
Fourier-transform infrared spectroscopy (FT-IR) analysis
Statistical analysis
RESULTS AND DISCUSSION
Growth characteristics
Granule size distribution
Level of damaged starch
Total protein and amylose content
Pasting properties
Thermal properties
X-ray diffraction and crystallinity
FT-IR spectroscopy analysis
CONCLUSION
INTRODUCTION
Although rice farming is mostly mechanized from soil preparation to post-harvest management, approximately 30% of labor time for rice production is used for sowing, growing seedlings, and transplanting, which still represents a significant burden for farmers. Recently, low planting density has been promoted in South Korea in response to demands for new agricultural technologies that can reduce production costs due to labor shortage associated with the aging of the rural population. Low-density rice planting is a cultivation technique that can reduce the number of boxes required to grow seedlings by densely seeding when growing seedlings and transplanting a smaller number of seedlings per unit area, which in turn reduces labor and production costs for raising seedlings (Hwang et al., 2021). Planting density in rice crops is one of the factors most closely related to yield, as wider planting distances provide plants with more space to absorb solar radiation, resulting in improved accumulation of nutrients by plants necessary for efficient photosynthesis (Baloch et al., 2002).
Panicle number type (PNT) rice, which tillers well, has a higher yield per plant, a higher number of spikelets per panicle, and a lower yield per area in low planting density (Moradpour et al., 2013; Nakano et al., 2012). Conversely, yield increases with a high planting density because the number of spikelets per area is increased (Mobasser et al., 2007), although the panicle length is shorter and the number of spikelets per panicle decreases (Uddin et al., 2011). In South Korea, the standard planting density is approximately 80 plants per 3.3 m2. However, for a stable low planting density, a planting density of 50 or more plants per 3.3 m2 is suggested, and wide tillering varieties are recommended (Yang et al., 2021). Generally, rice tillering begins at the lowermost internode, continuing to form secondary and tertiary tillers (Wang et al., 2007). Accordingly, the number of panicles and grains will vary depending on the tillering capacity. Early tillering results in more rachis branches and grains than those observed following late tillering. PNT rice significantly affects spikelets and rachis branches because of differences in the tillering capacity due to increased neck-node differentiation at a low planting density (Wang et al., 2007). Therefore, the spikelet position of each plant varies depending on the planting density, which may affect rice quality because of differences in ripening delay (Hwang et al., 2021).
The palatability of rice is determined by albumen starch, protein, lipid, trace elements, as well as their balance, and it is influenced by various factors, such as variety, production area, cultivation conditions, storage, polishing, and cooking conditions (Juliano, 1965; Sterling, 1978). Starch has a significant influence on the physicochemical quality and palatability score of rice (Syahariza et al., 2013), as well as on starch properties, including its particle size, crystallinity, and damaged starch content (Yu et al., 2012; Zhu et al., 2011). The internal molecular structure and physicochemical properties of starch are greatly influenced by the accumulation pattern of amylose and amylopectin (Goldstein et al., 2017; Vamadevan & Bertoft, 2020). Although low planting density can effectively help minimize yield reduction compared with conventional planting density, increasing the planting distance will delay the ripening of rice plants due to tillering capacity differences, which will in turn affect the quality of the grain. Previous studies on planting density have only focused on the appearance quality, protein, and palatability scores; however, the impact of panicle position on the grain quality because of differences in tillering capacities has rarely been studied (Dou et al., 2021; Saju & Thavaprakaash, 2020; Kakar et al., 2019).
The present study aimed to contribute to the field by investigating the changes in rice quality due to low planting density by analyzing the appearance quality and physicochemical properties of starch of PNT rice according to panicle position.
MATERIALS AND METHODS
Material and experimental design
This study was conducted using Ilpum variety, a PNT rice, that was cultivated in the Gyeongsangbuk-do Agricultural Research & Extension Services. We transplanted 30-day Ilpum seedlings sown on May 5, 2021, at planting intervals of 30 × 14, 30 × 18, 30 × 22, and 30 × 30 cm that, respectively, were divided into 80, 60, 50, and 30 plants/3.3 m2. To examine the difference in tillering capacity of panicle-number type rice per planting density, panicles were collected at the upper and lower positions of the culm length of 70 cm. All samples were milled using the SY94 + RAT2 + 2400 milling machine (Ssangyong Machinery Industry, Incheon, Korea), ground using the HMF-2100S food grinder (Hanil Electronics, Seoul, Korea), and sieved through a 100-mesh sieve for analysis.
Starch isolation
An alkaline treatment was used to isolate starch after soaking the rice grains in water (Yamamoto & Shirakawa, 1999). Briefly, soaked rice grains were dried and ground using a blender, following which the samples were submerged in 0.2% NaOH. The alkaline treatment was repeated until the yellowish color disappeared and biuret reaction was no longer observed. The precipitates were collected, thoroughly washed with deionized water, neutralized with 1 N HCl, washed again with deionized water, and centrifuged at 1,300 × g for 10 min at room temperature (VS-21SMT; Vision Scientific, Daejeon, Korea). The isolated starch was dried at room temperature and separated using a 100-mesh sieve.
Granule size analysis
Granule size distribution of the flour obtained from each experimental variety was determined by laser diffraction particle size analysis (Mastersizer 2000; Malvern Panalytical, Malvern, UK). The flour samples were immersed in ethyl alcohol and measured as previously described (Han et al., 2021).
Damaged starch quantification
A Starch Damage Assay kit (Megazyme International, Wicklow, Ireland) was used to measure the damaged starch content, according to the American Association of Cereal Chemists method 76-31 (AACC,76-31). A total of 0.1 g of rice flour and fungal α-amylase were activated for 5 min at 40°C. Then, 50 U/mL fungal α-amylase (1 mL) was added to the rice flour, and the reaction was allowed to proceed for 10 min at 40°C. Next, 0.2% sulfuric acid (8 mL) was added to stop the enzymatic reaction, and the samples were centrifuged at 1,000 × g for 5 min at room temperature. Further, 0.1 mL each of the supernatant and 20 U/mL amylose-glucosidase enzyme solution were transferred to a conical tube, and the reaction was allowed to proceed for 10 min at 40°C. Finally, glucose oxidase/peroxidase solution (4 mL) was added before a 20 min chromogenic reaction, and the absorbance was measured at 510 nm. The damaged starch percentage was calculated as previously described (Han et al., 2021).
Total amylose and protein contents
Rice endosperm amylose and protein contents were measured in a Cervitec Grain Inspector 1625 (Foss Analytical, Höganäs, Sweden). The Cervitec 1625 Grain Inspector used in the experiment is a device system that measures the amylose and protein contents of rice in a non-destructive manner. Milled rice samples were evaluated as previously described (Han et al., 2021).
Starch pasting properties
The starch pasting properties of rice flour was determined using a Rapid Visco Analyser (RVA, Model 4; Newport Scientific, Sydney, Australia). Briefly, 3 g of the different rice flours were suspended in 25 mL of deionized water by rotating at 960 rpm for 10 s, followed by rotation at 160 rpm until the analysis was completed. The temperature was maintained at 50°C for 1 min, increased to 95°C at a rate of 12°C/min, maintained at 95°C for 2.5 min, cooled to 50°C, and maintained at 50°C for 2 min. Starch characterization included initial pasting temperature, peak viscosity, trough viscosity, final viscosity, breakdown, and setback obtained from the viscogram.
Differential scanning calorimetry (DSC) analysis
DSC was used to evaluate the gelatinization properties of starch as previously described (Han et al., 2021). Briefly, a microsyringe was used to pour 3.0 mg of rice flour and deionized water (1:2, v/v) into an aluminum pan. The aluminum pan was sealed, rested for 1 h, and then was heated from 30 to 100°C at 10°C/min using a DSC 8500 furnace (Perkin Elmer). The gelatinization onset temperature (To), gelatinization peak temperature (Tp), gelatinization conclusion temperature (Tc), and gelatinization enthalpy (ΔH) were measured in triplicate samples.
X-ray diffraction and crystallinity analysis
An X-ray diffractometer (X’pert Pro MPD; PANalytical, Almelo, Netherlands) was used to evaluate the crystalline structure of the starch. The crystallinity and crystal strength were compared with the position and height of the peak measured at diffraction angles (2θ) of 5° to 50° using Cu-kα as target, at a scanning speed of 0.05° 2θ/s, voltage of 40 kV, and electric current of 20 mA.
Fourier-transform infrared spectroscopy (FT-IR) analysis
The external regions of starch granules from the two rice varieties were evaluated by FT-IR using a spectrometer (Nicolet iS50 FT-IR; Thermo Fisher Scientific, Waltham, MA, USA) equipped with a deuterated triglycine sulphate detector. The spectrum of each sample was measured at 1 cm−1 intervals, ranging from 3,500 to 1,000 cm−1.
Statistical analysis
One-way ANOVA of the average values was performed to investigate significant differences among sample groups (P < 0.05). Least significant difference test was also performed to identify differences between treatments using R statistical software (version 3.6.2) (http://www.rproject.org). All results shown in the tables are the mean ± standard deviation (SD), and all tests were conducted in triplicate.
RESULTS AND DISCUSSION
Growth characteristics
Table 1 shows the growth characteristics of the Ilpum variety according to different planting densities. Culm length tended to decrease as the planting density decreased, whereas the panicle length did not seem to be influenced by the planting density. Noteworthily, both culm and panicle were longer in upper than in lower panicles. The number of panicles showed a tendency to increase as the planting density decreased, regardless of the panicle position, and almost doubled from 80 to 37 plants/3.3 m2. The increase in the number of panicles was more significant in the lower position, at which the number of panicles increased nearly fourfold from 80 to 37 plants/3.3 m2. Based on the increase in the number of panicles by planting density, the percentage of panicles by position was 76–24% in 80 plants/3.3 m2 and 55–45% in 37 plants/3.3 m2. This result confirmed that the number of panicles differed significantly depending on the panicle position. Although the 1,000 seed weight was not significantly affected by the planting density in upper panicles, it decreased as the planting density decreased in lower panicles.
Table 1.
Growth characteristics of panicle number type (PNT) rice according to different planting densities.
Granule size distribution
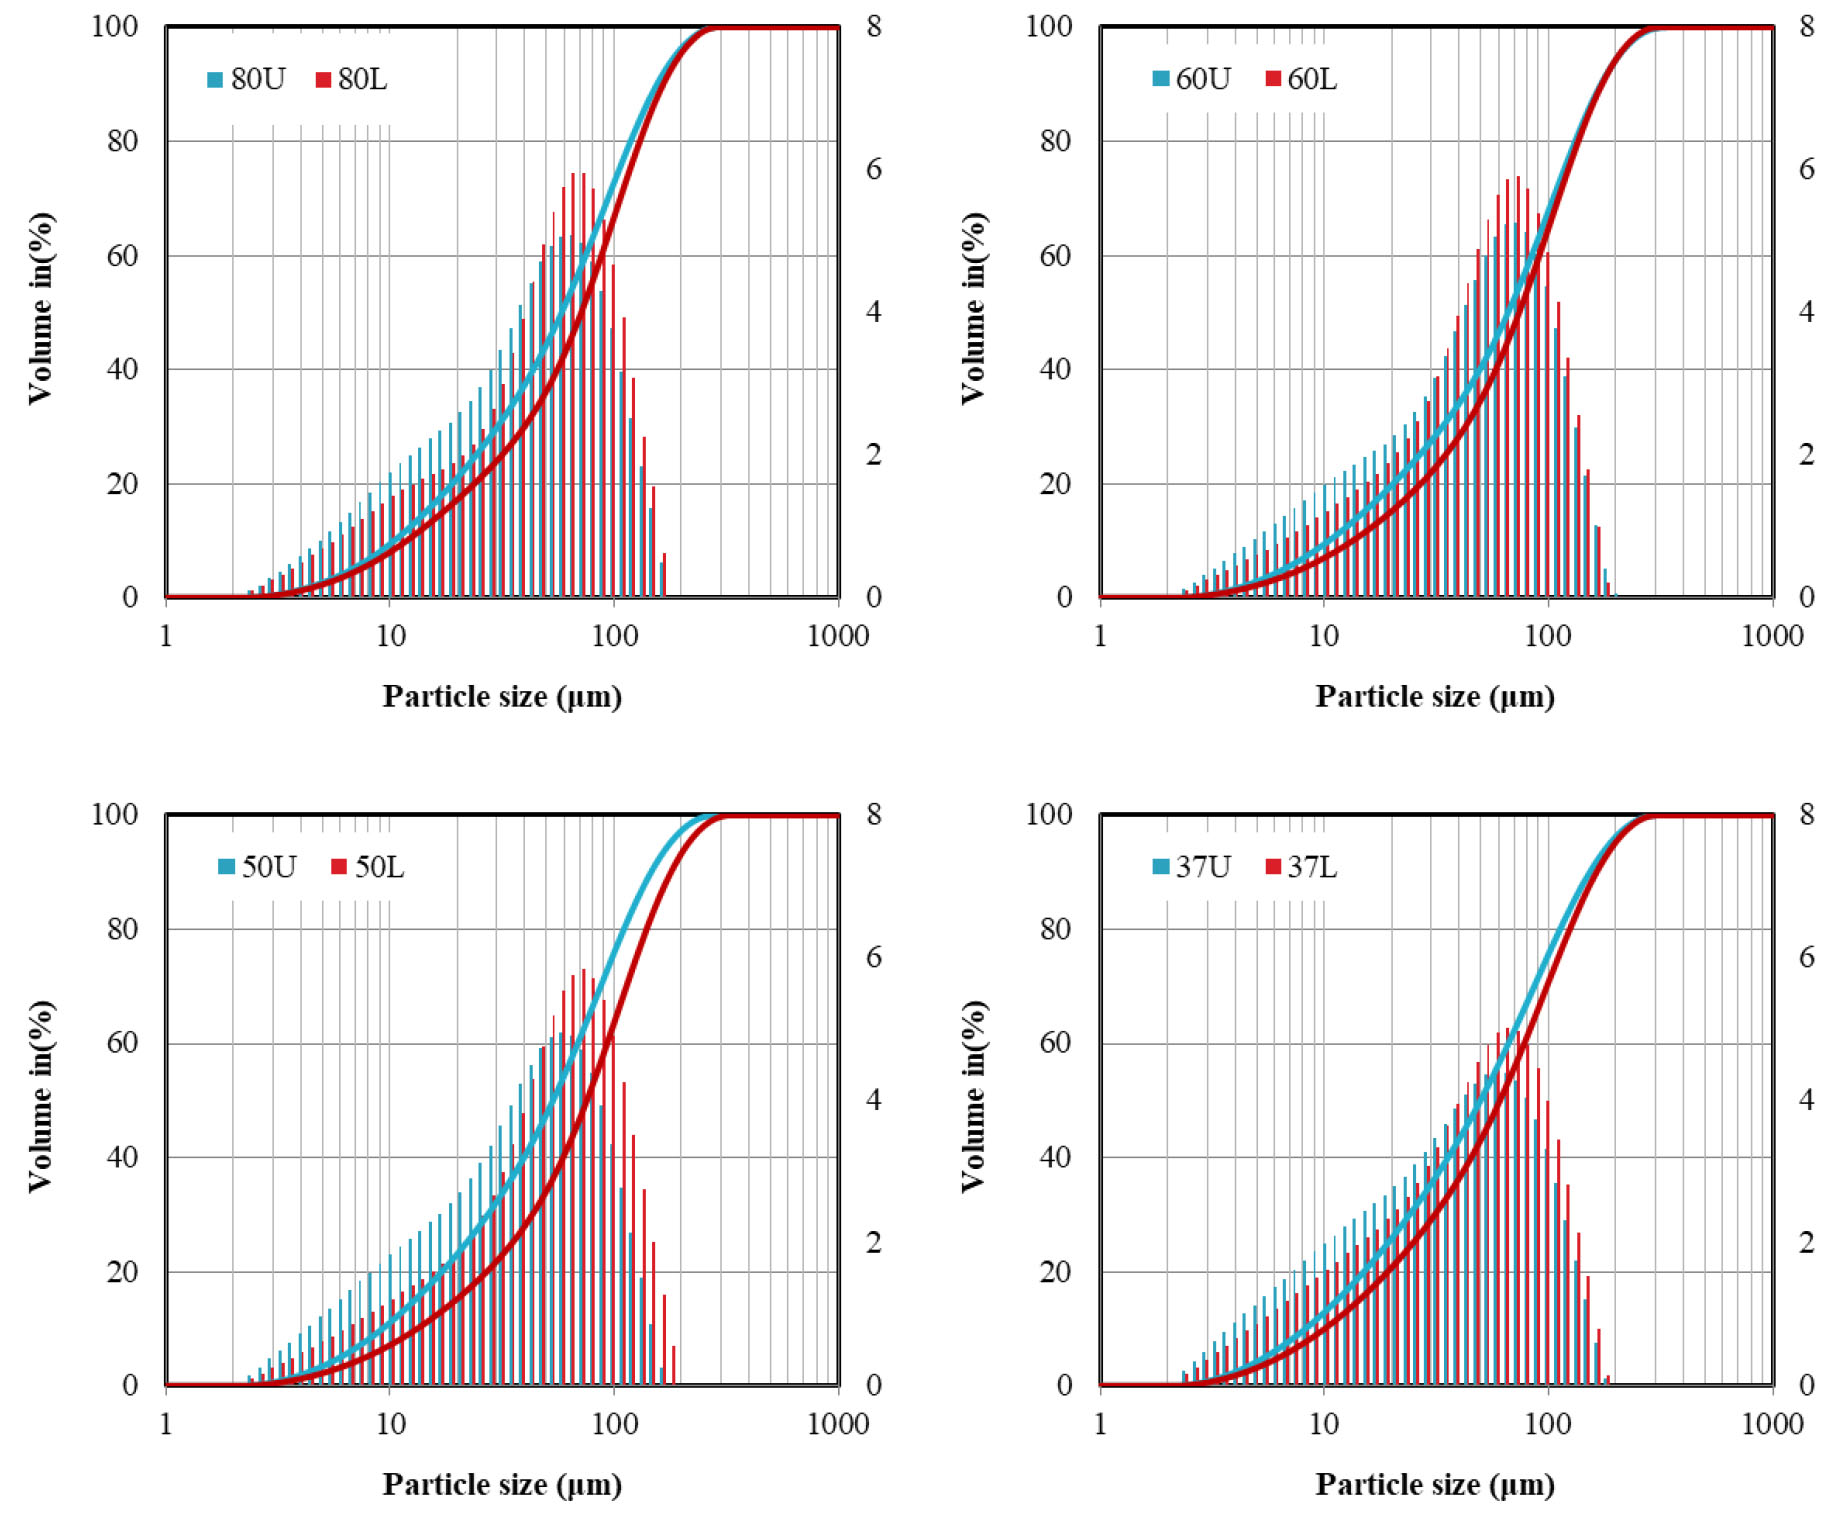
The granule size of rice flour can change depending on differences in rice starch. Starch damage and gelatinization temperature affect the quality of the flour granule size, consequently affecting their processing suitability (Han et al., 2012; Kim et al., 2005). Granule size distribution was analyzed to determine grain particle size changes at different planting densities and panicle positions. Regardless of planting density, the grain particle sizes in lower panicles were larger than those in upper panicles (Table 2). The most significant difference between panicle positions was observed at a planting density of 50 plants/3.3 m2 (Fig. 1). In contrast, the smallest grains were observed at a planting density of 37 plants/3.3 m2, regardless of panicle position.
Table 2.
Physicochemical characteristics of panicle number type (PNT) rice according to different planting densities.
Level of damaged starch
Regardless of the planting density, the starch damage observed in upper panicles was significantly higher (9–10%) than in lower panicles (Table 2). The degree of starch damage tended to increase in lower panicles as planting density gradually decreased. Damaged starch can be used as a substrate for starch hydrolase, but excessive starch can negatively affect dough quality (Han, 2021). Rice flour starch damage is closely linked to granule size, and rice flours with fine granule sizes are not suitable for the production of high-quality food products due to their high damaged starch content (Chiang & Yeh, 2002). From the results of this experiment, considering the small particle size and high damaged starch content at the lowest density, it is predicted that processing suitability using rice harvested from 37 plants/3.3 m2 tends to be unsatisfactory.
Total protein and amylose content
The protein and amylose content of rice is a deciding factor for its palatability. A high amylose content leads to low viscosity and cohesiveness and, hence, no stickiness. In contrast, a high protein content increases rice texture hardness and decreases viscosity, reducing palatability (Martin & Fitzgerald, 2002). The protein content increased with a decrease in planting density, starting from the planting density of 60 plants/3.3 m2, and the increase was most significant in lower panicles (Table 2). The difference between panicle positions increased with the decrease in planting density. This affected the viscosity reduction in lower panicles, especially during pasting (Table 3). Furthermore, the amylose content was higher in lower panicles than in upper panicles at higher planting densities of 60–80 plants/3.3 m2 (Table 2). At lower densities of 37–50 plants/3.3 m2, the amylose content was higher in the upper panicles than observed in the lower panicles. These differences in amylose content affected the changes in viscosity, gelatinization temperature, and crystallinity areas during pasting.
Pasting properties
Rapid visco analysis is a usability test for processed food or industrial materials, and involves a similar experimental procedure as cooking starch. High amylose content leads to insufficient swelling of starch particles, which in turn reduces rice viscosity, increases the gelatinization temperature, and increases rice texture hardness, ultimately reducing its stickiness (Juliano et al., 1985). Rice viscosity was higher overall in lower panicles than in upper panicles (Table 3). The lower the planting density, the higher the viscosity in upper panicles, but not in lower panicles. In the present study, the viscosity tended to decrease in upper panicles with decreasing planting density, and the viscosity difference between panicle positions decreased as the planting density decreased. This can be explained as lower planting density had little effect on rice ripening at different panicle positions.
Table 3.
Pasting properties of panicle number type (PNT) rice starch according to different planting densities.
All data are presented as the mean ± SD of three measurements. Different letters within columns indicate significant differences according to the least significant difference test (P < 0.05). Breakdown (BD) represents the difference between peak viscosity (PV) and hot paste viscosity (HPV). Consistency was calculated as the difference between the final viscosity and HPV. Setback (SB) was calculated as the difference between cool paste viscosity (CPV) and PV.
Thermal properties
DSC is a procedure used for thermal analysis that measures the absorption or release of heat generated by chemical reactions during physical states, such as melting a crystalline substance (Gabbott, 2008). The initiation temperature of gelatinization can be defined as the point at which the microstructure of starch molecules begin to collapse, and the energy required for this collapse can be expressed as gelatinization enthalpy (Bogracheva et al., 1998). Herein, the initiation, peak, and finishing temperatures of gelatinization gradually increased as the planting density decreased, except for samples collected at a density of 80 plants/3.3 m2 (Table 4). This trend was similar to that observed for protein content (Table 2). The enthalpy was relatively high in lower panicles, although it was higher in upper panicles at a planting density of 37 plants/3.3 m2 (Table 4). The significant effect increased starch damage due to the destruction of crystal structures at the specific planning density may explain these observations.
Table 4.
Thermal properties, relative crystallinity, and infrared (IR) parameters of panicle number type (PNT) rice starch according to different planting densities.
All data are presented as the mean ± SD of three measurements. Different letters within columns indicate significant differences according to the least significant difference test (P < 0.05). To, Tp, and Tc represent gelatinization onset, peak, and conclusion temperature, respectively. ΔT (Tc − To) represents the temperature range of gelatinization, and ΔH represents the change in gelatinization enthalpy.
X-ray diffraction and crystallinity
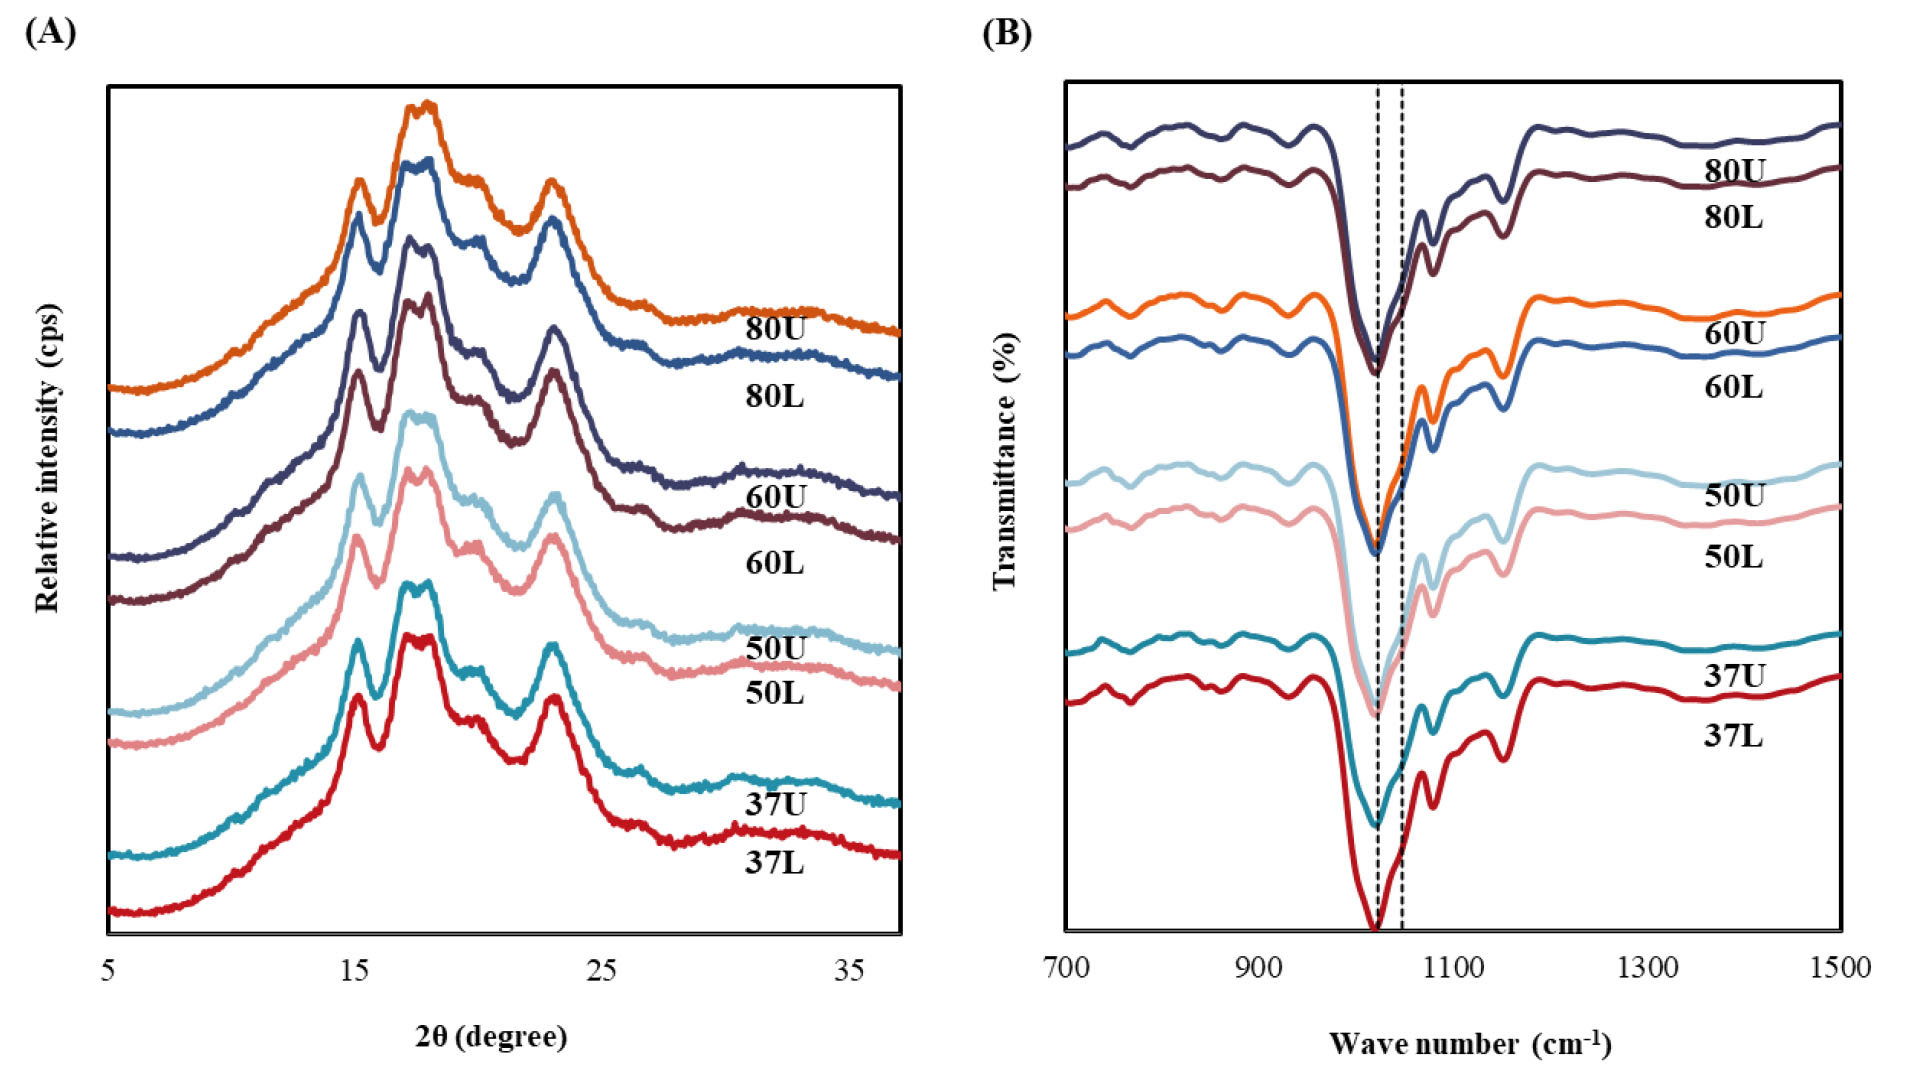
The crystallinity of starch granules at different planting densities was measured by X-ray diffraction. The diffraction width was narrow and sharp, and the crystallinity increased, implying that starch granule clusters were regular (Han, 2021). Wheat and rice starch granules showed strong peaks near the 15°, 17°–18°, and 22°–23° diffraction angles. These results corresponded with the A-type peak pattern, which is known to have a dense structure and low moisture (Imberty et al., 1991). Therefore, there were no changes in the crystal structure of rice starch (Fig. 2A). Relative crystallinity was estimated by the ratio of the peak areas to the total diffractogram area, which is the sum of peak areas and amorphous areas (Chen et al., 2010). The relative crystallinity tended to decrease at a lower planting density (37 plants/3.3 m2) than at a high planting density (80–50 plants/3.3 m2) (Fig. 2A and Table 4). This pattern, which was similar to that observed for amylose content in lower panicles, is deemed essential for strengthening the crystal structures via amylopectin molecules binding.
FT-IR spectroscopy analysis
FT-IR spectrum analysis is considered to be a useful and sensitive tool to investigate the qualitative and quantitative properties of food compounds and to identify starch crystal structures with a specific spectrum for the characterization of functional groups in chemical structures (Han, 2021). Spectral analysis showed similar patterns overall, despite slight variations in peak intensity (Fig. 2B). Peaks at 1,047 and 1,022 cm–1, as indicators of crystallinity, were observed on the surface of the starch granules. In general, the ratio of the peak intensity at the 1047 cm–1/1022 cm–1 peaks determined the degree of crystallinity of the surface of the starch granule (Sevenou et al., 2002). The peaks were overall higher in the upper panicles than in lower panicles at a planting density of 50–80 plants/3.3 m2. In contrast, the peaks were much higher in lower panicles at a planting density of 37 plants/3.3 m2 (Table 4). These results are congruous with the relative crystallinity results based on position. Therefore, the lowest planting density analyzed in this study may induce significant changes in crystallinity on the starch granules.
CONCLUSION
In the present study, we analyzed the physicochemical properties of starch at different planting densities and panicle positions. Although a planting density of 37 plants/3.3 m2 may support similar yield to that obtained through conventional cultivation, it can cause a difference in ripening due to delayed tillering, and consequently negatively affecting the rice quality and palatability after harvesting. Overall, for the PNT rice Ilpum, as the number of panicles increased, the size of 1000-grain weight decreased, and fewer grains became fully mature as the planting density decreased. This had a great influence on the physicochemical changes of rice starch, especially at 37 plants/3.3 m2. For 37 plants/3.3 m2, as the rice flour particles became very fine, an increase of the damaged starch content occurred. Particularly, the lower panicles showed the highest amount of protein and a low relative crystallinity level despite having the lowest amylose content. This suggests structural changes in amylopectin. Thermal analysis also indicated that the enthalpy value, which shows the energy required to destroy the crystallinity of starch, was lowered, which confirmed that the planting of the panicles at low density facilitated physicochemical changes in the rice starch. Therefore, restricting plant transplantation to a planting density of ≤37 plants/3.3 m2 is recommended to ensure stable rice quality and palatability. We believe that our findings provide new valuable information that can support farm households cultivating low planting density, thereby contributing to the diverse application of cultivations in the industrial rice sector.