


Sesame (Sesamum indicum L.), a member of the Pedaliaceae, is a diploid (2n = 26) dicotyledon and one of the oldest oil seed crops, growing widely in tropical and subtropical areas (Ashri, 2010). Its cultivation history can be traced back to between 5,000 and 5,500 years ago in the Harappa Valley of the Indian subcontinent (Bedigian and Harlan, 1986). The total area of sesame harvested in the world is currently 7.8 million hectares, and annual production is 3.84 million tons (UN Food and Agriculture Organization data, 2010). Sesame seed contains oil (44~58%), protein (18~25%) and carbohydrate (13.5%) (Borchani et al., 2010; Mohammed et al., 2011), and has desirable physiological effects, including antioxidant activity, blood pressure, serum lipid lowering potential. They are used as active ingredients in antiseptics, bactericides, viricides, disinfectants, moth repellants, and antitubercular agents because they contain natural antioxidants such as sesamin and sesamolin (Anilkumar et al., 2010; Nweke et al., 2012). Among the primary edible oils, sesame oil has the highest antioxidant content (Cheung et al., 2007). The most abundant fatty acids present in sesame oil include, oleic acid (43%), linoleic acid (35%), palmitic acid (11%) and stearic acid (7%) contributing toward 96% of total fatty acids (Elleuch et al., 2007). In addition, sesame oil is important in the food industry because of its distinct flavor. These characteristics have stimulated interest in the biochemical and physiological composition of sesame oil (Chung et al., 1995). India, China, and Korea are the world’s leading countries for sesame germplasm collection and preservation, as well as research on sesame core collection establishment (Zhang et al., 2012). Bisht et al. (1998) investigated 19 phenotypic and agronomic traits in 3,129 sesame accessions from seven ecogeographical regions in India and established a sesame core collection consisting of 362 accessions in India. To broaden the genetic bases in breeding, extensive germplasm collections have been carried out in the Republic of Korea. Consequently, 7,698 accessions have been collected to date and are being preserved at the National Agrobiodiversity center, Rural Development Administration (RDA) in Suwon, Korea. These accessions are composed of 3,538 exotic collections (including 1,961 accessions from the sesame world collection), 2,660 indigenous collections, 1,072 improved genetic stocks and 428 others. Kang et al. (2006) investigated 12 agronomic traits in 2246 Korean sesame accessions from ten agroclimate zones preserved in the Rural Development Administration (RDA) Genebank in Korea and established a sesame core collection of 475 accessions. The objective of this study was to develop a core collection of sesame from 2,751 accessions representing 278 core collection accessions, 15 countries of origins and investigated 5 qualitative and 10 quantitative trait descriptors.
MATERIALS AND METHODS
Data set
A total of 2,751 accessions of sesame collected over 15 countries. Evaluated in the experimental farm of the National Agrobiodiversity Center, National Academy of Agricultural Science, RDA, Republic of Korea during the year of 2008 -2009. Qualitative traits evaluated were, plant growth habit (PT) (cm), number of locules per capsule (LC), number of capsules per axil (CA), type of capsule dehiscence at ripening (DR), seed coat color (SC), Quantitative traits evaluated were numbered of capsules per plant (NCP), distance from the first capsule to end capsule (DFEC) (cm), distance from ground to first capsule (DGFC) (cm), capsule length (CL) (cm) and 1000-seed weight (g) (1000SW). Fatty acid analysis, scanned by near infrared reflectance spectroscopy (NIRS), was conducted at the laboratory of the RDA Genebank of Korea in 2009. Fatty acids scanned by NIR were percentages of palmitic acid (PAL), stearic acid (STE), oleic acid (OLE), linoleic acid (LIN), and linolenic acid (LINN) (Table 1). The RDA, National Agrobiodiversity center has developed the Powercore software to help genebanks to identify accessions for core collection (Kim et al., 2007). The software works on identifying all useful alleles or characteristics in accessions so that these can be retained in genebank. It helps in reducing the redundancy of useful alleles and thus enhancing the richness of the core collection.
Table 1.
List of descriptors recorded for the study.
Statistical analysis in entire and core collection
The means, ranges of standard deviation cumulative value, skewness and distribution homogeneity for 10 important quantitative traits to compare between entire collection and core collection were analyzed by the t-test were performed using SPSS ver.17.0. The phenotypic correlation coefficient of different traits has also been used as a measure for evaluating the quality of core collections (Reddy et al., 2005; Mahajan et al., 2007). The quantitative trait comparative frequencies were generated with the program GenAlEx version 6.41 (Peakall and Smouse, 2006) and fatty acid; Gas Chromatography (GC) was used for fatty acid analysis after (Kim et al., 2007). The diversity index of Nei’s (1973) was estimated and used as a measure of 10 important quantitative traits diversity in the entire collection and the core collection. Comparisons of various indicators percentage analysis of accessions from entire collection (EC) and core collection (CC), among countries of origin were calculated for the MD% mean difference percentage, VD% variance difference percentage, CR% is the coincidence rate of range and VR% indicates the variable rate of the coefficient of variance.
$$MD(\%)=^1/m\sum_{i=1}^m\frac{Me-Mc}{Mc}\times100$$Where Me is the mean of entire collection; Mc is the mean of core collection.
$$VD(\%)=^1/m\sum_{i=1}^m\frac{Ve-Vc}{Vc}\times100$$Where Ve is the variance of entire collection; Vc is the variance of core collection.
$$CR(\%)=^1/m\sum_{i=1}^m\frac{Rc}{Re}\times100$$Where Rc is the range of each trait for the entire collection; Re: is the range of each trait for the core collection.
$$VR(\%)=^1/m\sum_{i=1}^m\frac{CVc}{CVe}\times100$$Where CVe is the coefficient of variation of the trait for the entire collection; CVc is the coefficient of variation of the trait for the core collection; m is the number of traits according to Kim et al. (2007).
RESULTS
Development of core collection
The core collection of 278 accessions was established from 2751 randomly selected sesame accessions. These 278 accessions developed by using the power core program to represent about 10.1% of the core collection were used in our study. The different level of percentage of representation in entire and core collection, the entire collection majority of accessions from Korea contain 2133 (77.5%) accessions followed by China contain 109 (4%) accessions, USA-ARS comprise 95 (3.5%) accessions, India include 83 (3%) accessions, Turkey contain 82 (3%) accessions, Mexico contain 76 (2.8%), Venezuela contain 40 (1.5%), Pakistan contain 32 (1.2%), Japan contain 23 (0.8%), Russia contain 15 (0.5%) accessions, Egypt contain 15 (0.5%) accessions, Afghanistan contain 14 (0.5%) accessions, Nepal contain 13 (0.5%) accessions, Philippines contain 11 (0.4%) accessions, Iran contain10 (0.4%) accessions The predominance was reflected in the core collection that contain 16.9% and 47 accessions from Korea followed by China contain 9.7% (27 accessions), USA-ARS contain 9% accessions respectively, in the core collection (Table 2).
Table 2.
Descriptions of entire collection (EC) and core collection (CC) of sesame germplasm.
Quantitative traits mean comparison analysis
The mean, ranges and skewness of the 10 morphological descriptors are given in table 3. Differences among the means of the entire and core collection for the 10 morphological descriptors used in developing the core collection were significant also different significant levels were observed, significant P < 0.05, high significant P <0.01 and very high significant P < 0.005, and the range of values was lower in core collection than in entire collection in all 10 morphological descriptors. Skewness is a measure of the extent to which a probability distribution of a real-valued random variable, we observed in palmitic acid (-0.85~1.07) and distance from the first capsule to end capsule (5.1~3.75) showed the greatest difference between core collection and entire collections (Table 3).
Table 3.
Mean comparisons by t-test analysis of entire collection (EC) and core collection (CC) in 10 quantitative traits.
| NCP | DFEC | DGFC | CL | 1000SW | PAL | STE | OLE | LIN | LINN | ||
|---|---|---|---|---|---|---|---|---|---|---|---|
| EC | Mean±SE | 58.7±0.76 | 69.4±0.63 | 65.1±0.87 | 25.2±0.20 | 2.6±0.01 | 8.4±0.16 | 5.6±0.01 | 39.9±0.05 | 43.4±0.06 | 0.4±0.002 |
| Range | 0-407 | 3-178 | 10-802 | 1-99 | 0.47-5.03 | 0.97-13.89 | 2.09-12.57 | 28.1-49.2 | 22.5-55.8 | 0.01-0.65 | |
| STD | 39.94 | 27.92 | 41.53 | 9.17 | 0.49 | 0.67 | 0.52 | 2.22 | 2.51 | 0.06 | |
| CV% | 68.07 | 40.23 | 63.78 | 36.35 | 18.81 | 7.95 | 9.30 | 5.55 | 5.78 | 15.49 | |
| Skewness | 2.47 | 0.63 | 3.75 | -0.66 | 0.34 | 1.07 | 2.16 | -0.16 | -0.94 | -1.13 | |
| CC | Mean±SE | 68.7***±3.73 | 73.9**±2.08 | 105.8***±4.40 | 27.2*±0.59 | 2.9***±0.47 | 8.9***±0.77 | 5.8***±0.06 | 38.9**±0.20 | 44.0***±0.27 | 0.4***±0.01 |
| Range | 4-407 | 11-178 | 16-802 | 1-67.3 | 0.47-4.67 | 0.97-13.89 | 2.09-12.57 | 28.1-49.2 | 22.5-55.8 | 0.02-0.64 | |
| STD | 61.51 | 33.31 | 67.91 | 8.02 | 0.71 | 1.05 | 0.88 | 2.80 | 3.74 | 0.08 | |
| CV% | 89.60 | 45.05 | 64.20 | 29.54 | 24.75 | 11.85 | 14.99 | 7.21 | 8.50 | 20.11 | |
| Skewness | 2.72 | 0.65 | 5.19 | -0.50 | -0.35 | -0.85 | 2.37 | 0.01 | -2.15 | -1.20 | |
Nei’s diversity index
The Nei’s index value for core collection was 0.91 in number of capsules per plant (0.90 in the entire collection, the descriptor distance from first capsule to end capsule (DFEC) core collection was 0.89 (0.88 in the entire collection), the descriptor DGFC core collection was 0.80 (0.81 in the entire collection), the descriptor CL core collection was 0.86 (0.85 in the entire collection), descriptor 1000SW core collection was 0.71 (0.69 in the entire collection), the descriptor PAL core collection was 0.77 (0.74 in the entire collection), descriptor STE core collection was 0.76 (0.68 in the entire collection), descriptor OLE core collection was 0.77 (0.75 in the entire collection), descriptor LIN core collection was 0.76 (0.76 in the entire collection), descriptor LINN core collection was 0.75 (0.73 in the entire collection). For 10 quantitative trait descriptors were similar in the entire and the core collection indicating that the diversity of the entire collection was represented in the core collection (Table 4).
Table 4.
Nei’s diversity index for 10 quantitative traits in the entire collection (EC) and core collection (CC) of sesame.
Fatty acid analysis
The most common fatty acid classes among 1788 accessions in entire collection, palmitic acid content was observed in 8.1~ 8.5% (699 accessions) (Fig. 1A), stearic acid content were observed 38-39% in 726 accessions (Fig. 1B), oleic acid content observed 42-43% (Fig. 1C), linoleic acid content 0.41~0.45% in 613 accessions (Fig. 1D). Among the 189 core collection accessions most frequent fatty acid class percentage of palmitic acid 8.6~ 9.0% in 586 accessions, stearic acid 5.6~6.0% in 63 accessions, linoleic acid scored more than 40% in 58 accessions and linolenic acid 0.40-0.45% in 63 accessions (Fig. 1E). The oleic acid and linolenic acid there is no variation in entire and core collection and the remaining fatty acid for palmatic acid, citric acid and linoleic acid occurred differentiation this differentiation find good agronomic traits may be utilized in genetic improvement programs.
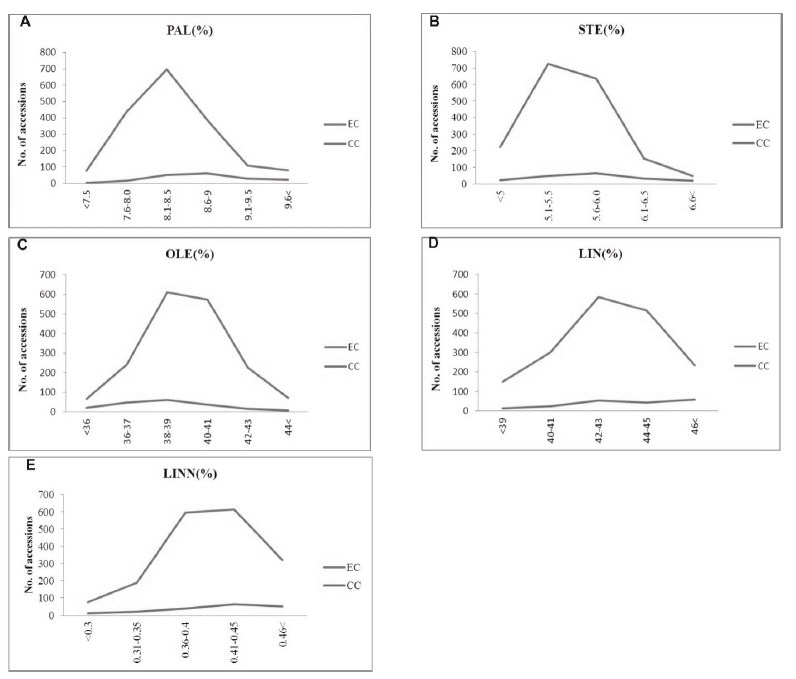
Fig. 1.
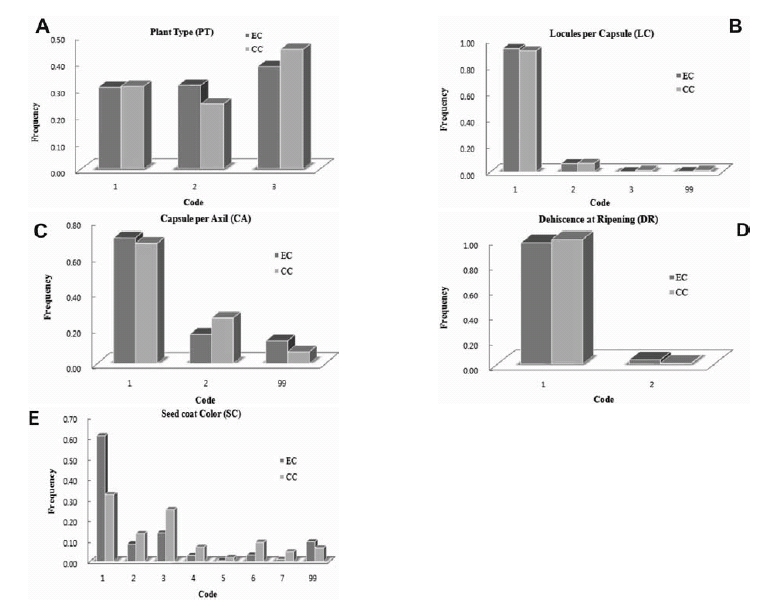
Comparative frequency distributions for A: Plant type (PT) among 2650 accessions in the entire collection (EC) and 258 accessions in the core collection (CC) (Code 1 - Non branching, 2 - Few branching, 3 - Many branching); B: Number of locules per capsule (LC) among 2606 accessions in EC and 265 accessions in CC (Code 1 - 4 locules per 2 capsules, 2 - 8 locules per 4 capsules, 6 locules per 3 capsules, 99 - Other); C: Number of capsules per axil (CA) among 2576 accessions in EC and 257 accessions in CC (Code 1 - 1 capsule per axil, 2 - 3 capsules per axil, 3 - Other); D: Type of capsule dehiscence at ripening (DR) among 1503 accessions in EC and 188 accessions in CC (Code 1 - Completely shattering, 2 - Partially shattering); E: Seed coat color (SC) among 2265 accessions in EC and 216 accessions in CC (Code 1 - White, 2 - Brown, 3 - Light brown, 4 - Grey, 5 - Light red, 6 - Black, 7 - Dull black, 99 - Other).Qualitative trait frequency distribution in entire and core collection
The frequency distribution of five qualitative trait descriptor was recorded in our study. The plant type 2650 accessions and core collection 258 accessions were used to analyze frequency distribution were not significantly correlated (r = -0.097) (Fig. 2A). The many branching type scored higher frequency compared to non-branching and few branching type. Locals per capsule scored higher frequency of plants with 1-4 locals per capsules these are not significantly correlated (r = 0.129*) in entire and core collections (Fig. 2B), the capsule per axial frequency 0.71 (relative frequency 0.93) entire collection and core collection score 0.68 (relative frequency 0.91) in 1-1 capsule per axil, the correlation coefficient was scored in 0.027 significantly correlated between entire and core collection (Fig. 2C). The dehiscence at ripening in completely shattering type (code1) had a much higher frequency than the partially shattering type in entire and core collection (Fig. 2D) and the seed coat color was negatively correlated (r = 0.102) in entire and core collections (Fig. 2E).
Compare different indicators percentage analysis
Compare to indicators between entire and core collection 9 out of 15 countries of origin (Table 5) used to measure the various indicator percentage. The CR% of each country was larger than 80%, indicating that the range of variation of traits was retained well. The VD% Korea only scored 70.56% remaining countries scored below 40%, but the VR% seven countries scored more than 100% and remaining two countries scored 96%, which could be explained by the fact that the genetic variation was significantly increased after eliminating countries of accessions. The MD% were scored in 1.29 (Japan) to 11.63 (Korea) respectively.
Table 5.
Comparisons of various indicators percentage analysis of accessions from entire collection (EC) and core collection (CC), among countries of origin.
Correlation coefficient analysis
Phenotypic correlations were performed for all 15 descriptors in the entire and core collections separately and the patients were found to be similar, demonstrating that association observed in the entire collection were well preserved in core collection, and also we found such meaningful relationship in the entire collection r = -0.783 at P < 0.01 and core collection r = -0.710 at P <0.01 respectively (Table 6).
Table 6.
Correlation coefficients between agronomic descriptors for the entire collection (above the diagonal) and the core collection (below the diagonal).
| PT | LC | CA | DR | SC | NCP | DFEC | DGFC | CL | 1000SW | PAL | STE | OLE | LIN | LINN | |
|---|---|---|---|---|---|---|---|---|---|---|---|---|---|---|---|
| PT | -.029 | -.310** | .092** | -.069* | -.002 | -.006 | -.095** | -.037 | -.093** | -.007 | .005 | .036 | -.054 | -.035 | |
| LC | -.021 | .053* | -.046 | -.016 | .028 | -.009 | -.016 | .020 | -.050 | -.022 | .015 | .016 | -.020 | -.036 | |
| CA | -.165* | .264** | -.038 | .012 | -.014 | .004 | .119** | .037 | .149** | .066* | .010 | -.048 | .033 | .012 | |
| DR | -.008 | -.019 | -.010 | -.033 | -.045 | -.021 | -.026 | -.008 | -.018 | -.032 | -.020 | -.072* | .062 | .035 | |
| SC | .030 | -.030 | .023 | -.023 | -.022 | .012 | -.038 | .018 | .013 | -.034 | .002 | -.020 | .033 | .028 | |
| NCP | .155* | -.068 | -.008 | .005 | -.129 | .539** | .040 | .105** | .175** | .056* | .048* | .035 | -.084** | -.053* | |
| DFEC | -.158* | -.100 | -.003 | .091 | -.213** | .440** | -.165** | .026 | .268** | .162** | .059* | -.059* | -.012 | -.069* | |
| DGFC | .097 | -.106 | -.156* | -.092 | -.038 | -.167* | -.259** | .124** | .243** | .168** | .074** | -.244** | .208** | -.001 | |
| CL | -.021 | -.124 | -.074 | -.001 | -.113 | -.075 | .044 | .095 | .288** | .174** | -.034 | .011 | -.021 | .072** | |
| 1000SW | .002 | -.099 | -.237** | -.084 | -.225** | .130 | .313** | .108 | .172* | .178** | .040 | -.231** | .208** | -.006 | |
| PAL | .136 | -.050 | -.176* | -.005 | -.284** | -.018 | -.069 | .017 | .208* | .030 | .222** | -.101** | .044 | -.178** | |
| STE | .015 | -.039 | .206** | -.020 | .277** | -.051 | -.015 | -.027 | -.159 | -.086 | -.155* | -.053* | -.171** | -.192** | |
| OLE | -.106 | .154* | -.005 | .200* | -.069 | .118 | -.107 | -.011 | -.081 | -.174* | .100 | -.146* | -.783** | .069** | |
| LIN | .071 | -.077 | -.159* | -.184* | -.192* | -.106 | .081 | .075 | .217** | .191* | .145* | -.395** | -.710** | -.005 | |
| LINN | -.131 | -.013 | .017 | .015 | -.209* | -.071 | -.074 | .071 | .173* | .096 | -.152* | -.271** | -.002 | .163* |
DISCUSSION
In our study the core collection of 278 accessions was established from 2751 sesame accessions. These 278 accessions developed by using the power core program to represent about 10.1% of the core collection were used in our study. The different level of percentage was scored respective countries in the entire and the core collection (Table 2). Suresh and Balakrishnan (2001) Strategies for developing core collection of safflower compared the diversity of the core sample with that of the whole collection using six different sampling approaches. The pool diversity index based on 28 descriptors was close to the diversity of the whole collection. However, when accessions from different diversity groups were allocated with equal frequency or in proportion to the logarithm of the number of accessions in each group or in the proportion to the square root-proportion of the number of accessions in each group, the resultant core samples had higher levels of diversity than the whole collection. Johnson et al. (1993) also reported that a core of 210 Carthamu stinctorius L. accessions, roughly 10% of the 2000 accessions, represented the whole collection. Ortiz et al. (1998) emphasized the importance of proper and adequate sampling for the conservation of phenotypic associations arising from co-adapted gene complexes in core collection.
Present study the mean, ranges and skewness of the 10 morphological descriptors are given in Table 3. Differences among the means of the entire and core collection for the 10 morphological descriptors used in developing the core collection were significant, and the range of values was lower in core collection than in entire collection. Skewness we observed in palmitic acid (-0.85–1.07) and distance from the first capsule to end capsule (5.1 –3.75) showed the greatest difference between core collection and entire collections (Table 3).
Yol and Uzun (2012) reported in sesame quantitative traits are compared in the mean values of six traits (plant height, number of branches, number of capsules per plant, number of seeds per capsule, 1000-seed weight, and seed yield) were not significantly different between the core and main collection. The mean values for the number of days to first flowering, the number of days to 50% flowering, and stem length to the first capsule were significantly different between the main and core collections. However, the range of values for traits in the core collection (minimum to maximum) represented the main collection approximately 100%. Therefore, the core collection was representative of the main collection.
In our study Nei’s index value for all the 10 quantitative trait descriptors were similar in the entire and the core collection indicating that the diversity of the entire collection was represented in the core collection. Yol and Uzun (2012) reported in sesame the Shannon diversity index was used to compare the core collection with the main collection with respect to the qualitative traits. The Shannon diversity index values showed that 12 qualitative traits were similar in the core subset and the main collection, indicating that the diversity of the entire collection was well represented in the core subset.
In our study oleic acid and linolenic acid there is no variation in entire and core collection and the remaining fatty acid for palmatic acid, citric acid and linoleic acid occurred differentiation this differentiation find good agronomic traits can be utilized in genetic improvement programs. Yol and Uzun (2012) reported core collection was developed, providing an indispensable resource for fatty acid composition studies based on analyses of fewer accessions than the entire collection indicated that the core collection was optimal and appropriately represented the entire collection. Upadhyaya et al. (2012) reported correlations among nutrient and agronomic traits indicated that simultaneous selection for various nutritional and agronomic traits, such as high protein and high pod yield and high oleic acid content and oleic to linoleic acid with high 100- seed weight was possible in the mini core collection. Also, the selection for protein did not adversely affect oil content.
In the present study the qualitative trait descriptors frequency distribution analysis of plant type, locules per capsule, dehiscence at ripening and seed coat color were not significantly correlated in entire and core collection, only one descriptor of capsule per axil significantly correlated (0.027*) in entire and core collection. Upadhyaya et al. (2011) reported the development of pearl millet mini core collection frequency distribution of classes in all 10 qualitative traits were no significant (P = 0.0859 to 0.9495). Uniform distribution of classes in the core and mini core collections indicated that the sampling technique to constitute the mini core was appropriate and that the mini core represented the core collection of qualitative traits.
In our study compared to indicators between entire and core collection 9 out of 15 countries of origin (Table 5) used to measure the various indicator percentages. The CR% of each country was larger than 80%, indicating that the range of variation of traits was retained well. The VD% Korea only scored 70.56% remaining countries scored below 40%, but the VR% seven countries scored more than 100% and remaining two countries scored 96%, which could be explained by the fact that the genetic variation was significantly increased after eliminating countries of accessions. The MD% were scored in 1.29 (Japan) to 11.63 (Korea). Kang et al. (2006) agreement with his result of a higher VR % (104.1%), which indicates that the value of the core collection was adequate. Higher (81.9%) value of CR% retained in the core collection suggests that it could be adopted as a representative of the whole collection.
Zhang et al. (2012) Power Core was used to extract a sesame mini-core collection containing 184 accessions from the core collection and the resulting collection was compared to that obtained by random sampling. The advantage of the advanced maximization strategy of PowerCore in capturing genetic diversity and in validating mini-core collection extraction was illustrated. A mini-core collection with low MD% and VD% and large VR% and CR % can be considered to provide a good representation of the genetic diversity in the initial core collection (Kim et al., 2007).
In our study Phenotypic correlations were performed for all 15 descriptors in the entire and core collections separately we found such high correlation coefficients in both the entire (r = -0.783) at P < 0.01and core (r = -0.710) at P < 0.01 collections. Skinner et al., 1999 reported estimates of correlation coefficients greater than 0.71 or lower than –0.71 have been suggested as meaningful correlations. Upadhyaya et al. (2009) also reported correlation coefficients in both the core (r = 0.712) and mini core (r = 0.702) collections between plot yield and yield per plant. Phenotypic correlations were performed for all quantitative traits in the core and mini core collections separately and the pattern was found to be similar, demonstrating that associations observed in the core collection were well preserved in the mini core collection. Further, the proportion of variance in one trait that can be attributed to its linear relationship with a second trait is indicated by the square of correlation coefficient (Snedecor and Cochran, 1980).
The result of this study revealed that the germplasm was a repository of many desirable characteristics with potential for utilization in sesame breeding. The development of the core collection should enhance the efficiency and usefulness of evaluating sesame germplasm collections and speed up future breeding progress. This core collection could be used for molecular characterization to identify allelic variation related to agronomically important characteristics.