

INTRODUCTION
MATERIALS AND METHOD
Chemicals and reagents
Seeds collection, cultivation, and sample preparation
Seed sample extraction
Total saponin content (TSC)
Total phenolic content (TPC)
Antioxidant activities
Data analysis
RESULTS AND DISCUSSION
Variation of TPC and effect of seed color difference
Variation of TSC and effect of seed color difference
Variations of antioxidant activities and effect of seed color difference
Multivariate analysis
INTRODUCTION
Adzuki beans (Vigna angularis (Willd.) Ohwi & Ohashi) have been grown and consumed for centuries throughout East Asian countries including Korea, Japan, and China (Chu et al., 2021a; Ha et al., 2021; Tayade et al., 2022). Adzuki beans are high in nutrition and bioactive chemicals that improve human health. As a result, they have long been utilized as a versatile component in a variety of Asian cuisines such as paste, soup, porridge, and pastries (Lee et al., 2017a; Yousif et al., 2007). Previous research has shown that adzuki beans are good sources of plant-based fats and proteins, as well as minerals including magnesium, iron, potassium, and zinc, all of which are necessary for human wellness (Chu et al., 2021b; Sangsukiam & Duangmal, 2022; Sahasakul et al., 2022). Furthermore, adzuki beans are high in both soluble and insoluble dietary fibers that may help with weight loss and aid food digestion (Popoola et al., 2023). Adzuki beans are also rich sources of secondary metabolites, the most common of which are saponins and polyphenols, which have a synergistic role in regulating reactive radicals in the human body (Liu et al., 2017a, 2017b; Liu & Xu, 2015). Several studies have indicated that adzuki bean phenolic acids, flavonoids, and anthocyanins provide a variety of physiological effects, including antioxidants, anti-inflammatory, anticancer, and antidiabetic properties (Kitano-Okada et al., 2012; Kuriya et al., 2023; Lee et al., 2015a; Sahasakul et al., 2022). In general, consuming adzuki beans gives a wide range of health benefits, which has expanded their use in food industries.
Several environmental and genetic factors, including diseases, genotype variation, temperature, post-harvest treatment, and growth conditions, influence the overall metabolite compositions and biological activity of legumes (Hoeck et al., 2000; Oh et al., 2022). Seed-related traits such as seed size, seed weight, cotyledon color, hilum color, and seed coat color are also additional factors that may influence the chemical makeup of legume seeds (Chu et al., 2021a, 2021b; Kim et al., 2011; Lee et al., 2008, 2017b). Adzuki beans come in a variety of seed colors, including red, black, gray, yellow, and white. Seed color variation in adzuki beans, like in other legumes, is regulated by numerous genes, and it is one of the key seed-related characteristics that determine metabolite levels and biological activities (Chu et al., 2021b; Horiuchi et al., 2015; Redden et al., 2009; Zhao et al., 2022). Furthermore, it is one of the qualities that influence consumer and farmer preferences, as well as genotype selection in breeding (Kaga et al., 2008). As a result, studying the effect of seed color variation on seed metabolite and biological activities in a large population of genetic resources is critical. Furthermore, such studies are required to identify adzuki bean genotypes with high metabolite content that are suited for breeding, conservation, and consumption (Chu et al., 2021a; Li et al., 2022).
Previously, some studies have shown the metabolite variations in adzuki beans of varying seed coat colors. Black and red adzuki beans, for example, are known to contain more phenolic acids, anthocyanins, and flavonoids than other colors (Chu et al., 2021b; Ha et al., 2021; Lee et al., 2015b). White adzuki beans, on the other hand, are thought to be high in nutrient composition but poor in secondary metabolite contents (Li et al., 2022; Nagao et al., 2023). Despite these observations, there has been little research that has looked at the impact of seed coat color variation on a large population of adzuki beans. Evaluating the impact of seed coat color variation using a large population of genetic materials could provide a better understanding of its relationship with seed metabolite levels. Moreover, such studies are desirable in order to uncover superior genotypes that could be used for both consumption and breeding as described before (Kaga et al., 2008; Li et al., 2022). In this study, 296 adzuki beans of various colors, including gray, red, and white were cultivated in Korea, and the diversity of total phenolic content, total saponin content, and antioxidant activities were assessed. Moreover, the effect of seed color variation on each of the parameters was evaluated. This study could serve as a foundation for further research into the relationship between seed color, metabolite concentration, and antioxidant activity in adzuki beans, specifically gray, red, and white genotypes.
MATERIALS AND METHOD
Chemicals and reagents
All of the chemicals and reagents used in this study were of the highest quality and used as obtained. Methanol and ethanol were purchased from Fisher Scientific (Pittsburgh, PA, USA), water from Thomas Scientific (Philadelphia, PA, USA), diosgenin from PhytoLab (Vestenbergsgreuth, Germany), and sulfuric acid from DAEJUNG Chemicals (Siheung, Korea). The other chemicals and reagents, including anhydrous sodium carbonate (Na2CO3), vanillin, gallic acid, Folin-Ciocalteu phenol reagent, L-ascorbic acid, sodium carbonate, potassium ferricyanide, trichloroacetic acid, ferric chloride, 1,1-diphenyl-2-picrylhydrazyl radical (DPPH•), 2,2′-azino-bis(3-ethylbenzothiazoline-6-sulfonic acid) diammonium salt (ABTS), 6-hydroxy-2,5,7,8-tetramethylchroman-2-carboxylic acid (Trolox), were obtained from Sigma Aldrich (St. Louis, MO, USA).
Seeds collection, cultivation, and sample preparation
The seeds of 296 adzuki bean genetic materials were obtained from the National Agrobiodiversity Center’s gene bank (RDA, Jeonju, Korea). Field cultivation of all adzuki bean varieties was carried out on an experimental field at the Center between June and October 2021. Detailed information regarding cultivation conditions can be found in our recently published paper (Desta et al., 2023). Matured seeds were hand-harvested and classified as gray, red, or white genotypes based on seed coat color. Seed samples from each accession were freeze-dried in an LP500 drier (ilSHINBioBase, Dongducheon, Korea). The dried samples were subsequently pulverized using 3 mm stainless TissueLyser II beads (Quagen, Germantown, MD, USA) and stored at -20°C in sealed plastic bags for further analysis.
Seed sample extraction
Seed sample extraction was carried out in accordance with a previously described protocol, with some modifications. Specifically, 0.2 g of powdered sample was combined in triplicate with 2.5 mL of 80% aqueous methanol. The mixture was sonicated for 45 min in the dark at 25 °C. The mixture was then taken off and centrifuged in a high-speed centrifuge (3134 ×g, 15 min) (Labogene, Daejeon, Korea). The upper supernatant was kept, and the extraction procedure was repeated for the residue. The combined supernatant was then used to determine total saponin content, total phenolic content, 1,1-diphenyl-2-picrylhydrazyl radical (DPPH•) scavenging activity, ABTS•+ scavenging activity, and ferric-reducing antioxidant power.
Total saponin content (TSC)
The TSC was estimated using a previously known vanillin-sulfuric acid assay, with minor modifications (Xu & Chang, 2009). In brief, 25 µL of sample extract was combined with an equal amount of freshly prepared 8% vanillin (w/v in ethanol) and 250 µL of 72% sulfuric acid (v/v in water). The mixture was incubated in a water bath at 60°C for 10 min before cooling in an ice bath for 15 min. The absorbance was then measured at 544 nm on an Eon Microplate Spectrophotometer (Bio-Tek, Winooski, VT, USA). Diosgenin (0.10~2.00 mg/mL) was used as a standard to plot calibration curves (R2 > 0.999). TSC was then calculated as milligrams of diosgenin equivalent per gram of dried seed sample (mg DE/g).
Total phenolic content (TPC)
The TPC was calculated using the Folin-Ciocalteu colorimetric technique (Xu & Chang, 2009). In brief, 100 μL of sample extract was mixed with 100 μL of Folin-Ciocalteu reagent, and the mixture was incubated at 25 °C in the dark for 3 min. After adding 100 μL of Na2CO3 solution (2%), the mixture was further incubated in the dark for 30 min. Finally, the absorbance was measured at 750 nm using an Eon Microplate Spectrophotometer (Bio-Tek, Winooski, VT, USA). Gallic acid (0.025~0.500 mg/mL) was used as a standard to plot calibration curves. TPC was estimated as milligrams of gallic acid equivalents (mg GAE/g) per gram of dried material.
Antioxidant activities
Three in vitro experiments were used to evaluate the antioxidant activity of each adzuki bean, as detailed below, using our previously published methodology (Desta et al., 2022). During each experiment, analysis was conducted in triplicate and absorbance was measured with an Eon Microplate Spectrophotometer (Bio-Tek, Winooski, VT, USA).
DPPH• scavenging activity
During the DPPH• scavenging activity assay, 100 μL of each sample extract was combined with an equivalent volume of freshly made DPPH-solution (150 μM). The mixture was then incubated for 30 min in the dark at 25 °C, and the absorbance was measured at 517 nm. Calibration curves were plotted using ascorbic acid (2.5~25.0 mg/L, R2 > 0.999), and DPPH• scavenging activity was calculated as milligrams of ascorbic acid equivalent per gram of dried material (mg AAE/g).
ABTS•+ scavenging activity
To determine the ABTS•+ scavenging activity, 10 μL of sample extract was combined with 150 μL of ABTS•+ working solution before being incubated for 3 min at 25°C in the dark. Then, the absorbance was measured at 734 nm. Trolox was used as a standard to plot calibration curves (10~250 mg/L, R2 > 0.999). ABTS•+ scavenging activity was calculated as milligrams of Trolox equivalent per gram of dry material (mg TE/g).
Ferric reducing antioxidant power (FRAP)
For the FRAP test, 60 µL of sample extract was mixed with 150 µL of freshly prepared phosphate buffer (pH: 6.6, 0.2 M) and an equal volume of 1% potassium ferricyanide solution (K3Fe(CN)6). After 20 min of incubation at 50 °C, 150 µL of 10% trichloroacetic acid was added. Then, the mixture was centrifuged (3134 × g, 10 min), and 100 µL of the supernatant was combined with an equal volume of distilled water and 20 µL of 0.1% ferric chloride solution. After 10 min, the absorbance at 700 nm was measured. Calibration curves were constructed using ascorbic acid (10~150 mg/L, R2 > 0.999), and FRAP was presented in mg AAE/g.
Data analysis
Measurements were taken in triplicate during each experiment, and results are reported as mean standard ± standard deviation (SD). Statistical analysis was carried out using the xlstat program (Lumivero, CO, USA). To statistically determine the differences between means, an analysis of variance at p < 0.05 was performed. R-software version 4.2 (www.r-project.org) was used for boxplot, principal component (PCA), hierarchical cluster (HCA), and Pearson’s correlation analyses.
RESULTS AND DISCUSSION
Variation of TPC and effect of seed color difference
Adzuki beans are well-known for their phenolic content, which plays an important role in health promotion (Wang et al., 2022). The TPC of all 296 adzuki beans was determined using a colorimetric assay, as previously described. Table S1 (Supplemental material) provides the average TPC for each accession, and Table 1 summarizes the statistical data. The TPC was in the range of 1.52~8.24 mg GAE/g with a mean of 3.75 mg GAE/g and a coefficient of variation (CV) of 27.47%. Among the 296 accessions, 52.03% of the adzuki beans had a TPC greater than the total mean value. The highest TPC was found in accession IT-216286, while the lowest was recorded in accession IT-105698. Previously, several studies assessed the level of TPC in various adzuki bean genotypes. For instance, Lee et al. (2017a) and Sung et al. (2020) independently investigated 209 adzuki bean landraces and 8 adzuki bean cultivars cultivated in Korea and discovered TPC ranges of 1.1~11.7 and 0.52~4.28 mg GAE/g, respectively. In another study, TPC in 150 adzuki beans grown in Korea ranged from 374.5 to 6596.9 µg/g (Kim et al., 2011). Johnson et al. (2022) recently discovered a TPC in the range of 53~152 mg GAE/100g in eight adzuki bean genotypes grown in Australia. Several factors, including post-harvest treatment conditions, growing conditions, and analysis techniques, are documented to alter TPC levels in adzuki beans. Therefore, the observed TPC variances in the previous studies could be attributed to these factors (Ha et al., 2021; Szakiel et al., 2011). Overall, the TPC values found in our investigation are within previously reported ranges.
Table 1.
Statistical values on the variations of total phenolic content, total saponin content, and antioxidant activities in gray, red, and white adzuki beans grown in Korea.
In legumes, seed color has been utilized to discriminate between metabolite variations. However, there has not been much research on adzuki beans that evaluate the effect of seed color on metabolite levels utilizing a wide population of genotypes (Siah et al., 2014; Wang et al., 2008; Xu et al., 2007). In this study, the TPC variation among the different seed coat colors was statistically evaluated. The box plots in Fig. 1 depict the level of TPC in the adzuki bean accessions according to their seed coat color. Table 1 contains both numerical values and statistical data. TPC ranged from 2.14 to 8.24 mg GAE/g in gray adzuki beans, from 2.70 to 6.34 mg GAE/g in red adzuki beans, and from 1.52-2.37 mg GAE/g in white adzuki beans. The average TPC decreased in the order of gray (4.16 mg GAE/g) > red (3.79 mg GAE/g) > white 2.37 (mg GAE/g), with significant variation between each group (p < 0.05). Among the accessions with a TPC above the total mean (3.75 mg GAE/g), 67.74% were gray while the remaining 32.26% were red adzuki beans. The TPC of all the white adzuki beans was less than the total mean. Previously, Hori et al. (2006) found a much lower TPC in white adzuki beans compared to black, red, and green adzuki beans, which our findings agree with. A recent study also showed white adzuki beans to have a much lower TPC level compared to other colored genotypes (Nagao et al., 2023). In general, our findings along with these previous studies demonstrate that white adzuki beans might not be good sources of polyphenols compared to other colored genotypes.
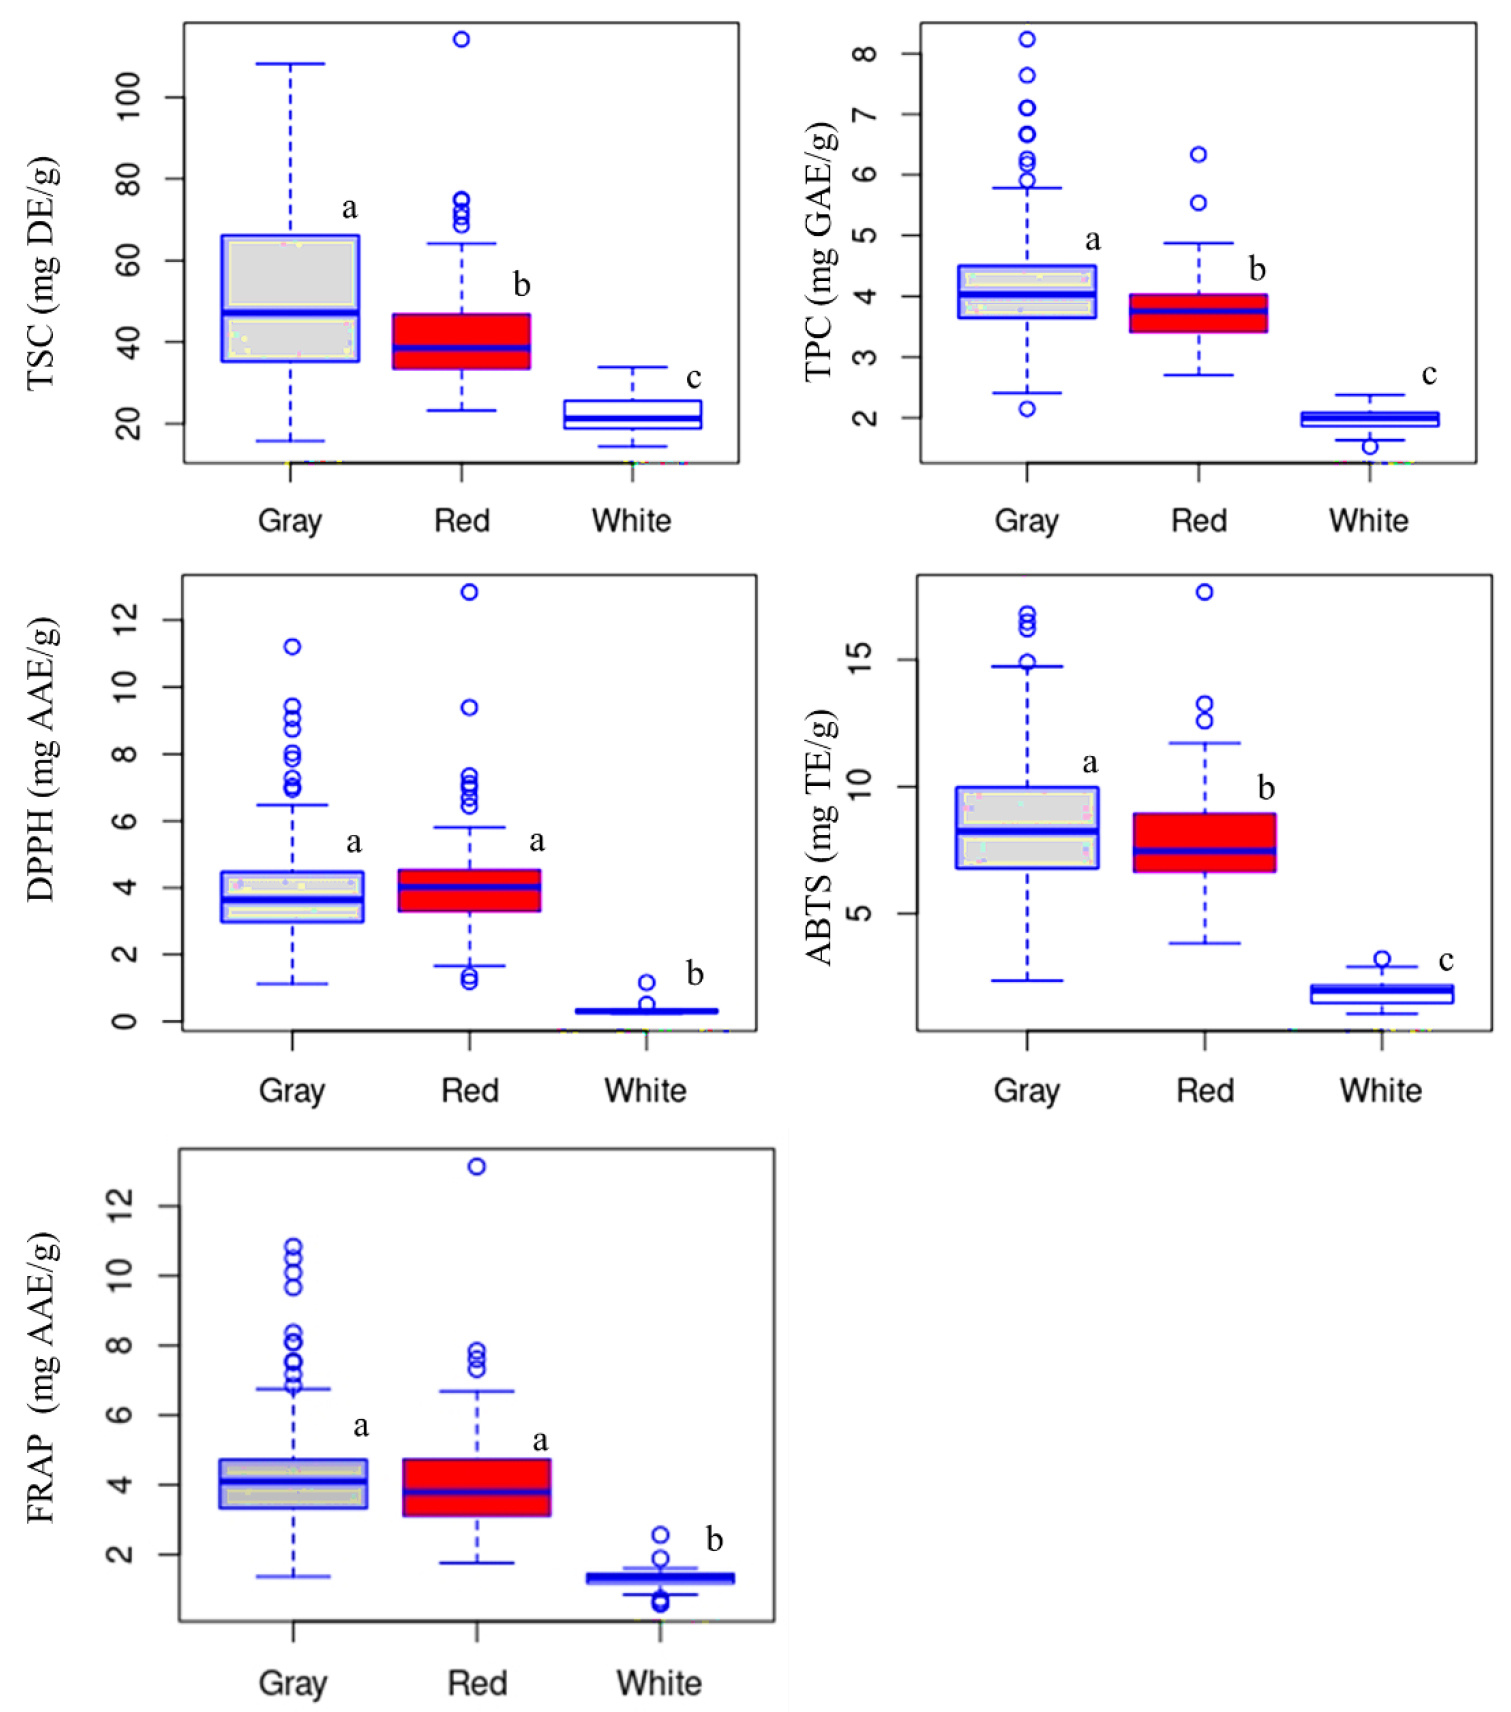
Fig. 1.
Boxplots showing the variations of total phenolic content, total saponin content, and antioxidant activities between gray, red, and white adzuki beans. AAE: Ascorbic acid equivalent; ABTS: ABTS•+ scavenging activity; DE: Diosgenin equivalent; DPPH: DPPH• scavenging activity; FRAP: Ferric reducing antioxidant power; GAE: Gallic acid equivalent; TE: Trolox equivalent; TPC: Total phenolic content; TSC: Total saponin content. Different letters on boxplots in a category indicate significantly different means (p < 0.05).
Variation of TSC and effect of seed color difference
Saponins, found in high concentrations in Adzuki beans, work in tandem with polyphenols to prevent disease and improve health (Liu et al., 2017b). In this study, the TSC of all accessions was determined using the vanillin-H2SO4 assay as described before. With a mean of 44.27 mg DE/g, the TSC in the entire population was in the range of 14.36~114.22 mg DE/g, indicating an approximately 8-fold variation across the adzuki bean accessions (CV = 44.27%) (Table S1, Table 1). Around 40.88% of the adzuki bean accessions had a TSC greater than the total mean. Accession IT-194575 had the highest TSC, while accession IT-294630 had the lowest. Many studies have shown that saponin concentrations differ amongst adzuki bean genotypes, and genetic variations, post-harvest management, extraction procedures, and growing conditions can all impact TSC levels. Previously, TSC levels in two adzuki bean genotypes ranged from 10.33 to 19.40 mg/g after different sonication treatments (Chiu, 2021). In other studies, Luo et al. (2016) and Liu & Xu (2015) separately reported TSC of 45.60 mg DE/g and 10.82 mg SBaE/g in two different Chinese adzuki beans. The TSC value in the former study corresponded to the total mean value in our investigation.
Saponin levels in legumes are also affected by seed color variations. However only a few studies were published in adzuki beans (Siah et al., 2014; Wang et al., 2008; Xu et al., 2007). In this study, the effect of seed color variation on TSC was statistically examined, and significant variation was found (Fig. 1, Table 1). TSC in gray, red, and white adzuki beans ranged from 15.74 to 108.24, 23.46 to 114.22, and 14.36 to 33.85 mg DE/g, respectively. The average TSC level followed a similar pattern as TPC, being the highest in gray adzuki beans (50.94 mg DE/g) and the lowest in white adzuki beans (22.09 mg DE/g). Statistically, the average TSC varied significantly among the different seed coat colors (p < 0.05). Moreover, gray adzuki beans accounted for 72.73% of the accessions with a TSC greater than the total mean, whereas red adzuki beans accounted for the remaining 27.27%. Again, none of the white adzuki beans had a TSC greater than the total mean value. To the best of our knowledge, there are no previous studies that investigated the influence of seed coat color on total saponin content in adzuki beans. Overall, our research found that white adzuki beans are low in saponin content when compared to gray and red adzuki beans.
Variations of antioxidant activities and effect of seed color difference
In vitro tests are widely accepted as the most convenient and cost-effective assays for determining the total antioxidant activity of plant and food extracts. However, due to variances in the scavenging mechanism, a single experiment alone cannot be utilized to evaluate the total antioxidant activity of such extracts (Martins et al., 2022). In this study, three separate assays were utilized to evaluate the antioxidant activity of each adzuki bean accession (Table 1, Table S1). The DPPH• scavenging activity, ABTS•+ scavenging activity, and FRAP were in the ranges of 0.23~12.84 mg AAE/g, 1.05~17.66 mg TE/g, and 0.59~13.14 mg AAE/g, respectively signifying a wide range of variations among the adzuki bean accessions. Accession IT-194575 displayed the highest DPPH• scavenging activity, ABTS•+ scavenging activity, and FRAP at the same time. This accession had the highest TSC as well as a TPC of 6.34 mg GAE/g, which is the 7th highest level of all the 296 accessions. On the other hand, accessions IT-236259, IT-105890, and IT-196872 displayed the lowest DPPH• scavenging activity, ABTS•+ scavenging activity, and FRAP, respectively. Compared to our study, much lower ABTS•+ scavenging activity (1.64~8.15 mg TE/g) and FRAP (0.41~5.44 mg AAE/g) ranges were reported, and the variations could be due to the difference in the number of genotypes investigated (Lee et al., 2017a; Sung et al., 2020). In addition to the studies mentioned above, other researchers have also revealed the antioxidant activities of a variety of adzuki bean genotypes. However, differences in extraction techniques, reporting methodologies, and tests used made comparing published values to our findings difficult (Gohara et al., 2016; Han et al., 2022). In general, our findings demonstrated wide variations of antioxidant activities among the different adzuki beans. Furthermore, accessions with greater levels of TPC and TSC displayed stronger antioxidant activities than those with lower levels of TPC and TSC (Table S1). Such findings have been reported in numerous prior research, indicating the roles of polyphenols and saponins in the regulation of reactive radicals (Johnson et al., 2022; Lee et al., 2017a).
The effect of seed coat color variations on each of the antioxidant activities was also statistically evaluated (Table 1, Fig. 1). The DPPH• scavenging activity, ABTS•+ scavenging activity, and FRAP were in the ranges of 1.13~11.21 mg AAE/g, 2.36~16.80 mg TE/g, and 1.37~10.84 mg AAE/g in gray, 1.20~12.84 mg AAE/g, 3.84~17.66 mg TE/g, and 1.76~13.14 mg AAE/g in red, and 0.23~1.64 mg AAE/g, 1.05~3.23 mg TE/g, and 0.59~2.56 mg AAE/g in white adzuki beans, respectively. The average ABTS•+ scavenging activity and FRAP each decreased in the order of gray > red > white, while DPPH• scavenging activity decreased in the order of red (4.14 mg AAE/g) > gray (3.91 mg AAE/g) > white (0.34 mg AAE/g) adzuki beans (Table 1, Fig. 1). ABTS•+ scavenging activity differed significantly between the three seed coat colors. Likewise, DPPH• scavenging activity and FRAP of gray and red adzuki beans differed significantly from those of white adzuki beans but not from each other. Furthermore, gray adzuki beans accounted for 56.38, 72.85, and 65.96% of the accessions with values above the total means of DPPH• scavenging activity, ABTS•+ scavenging activity, and FRAP, respectively, whereas red adzuki beans accounted for the remaining 43.62, 27.15, and 34.04%, respectively. For any of the antioxidant activities, no white adzuki bean exceeded the total mean values. Little research has been done on the effects of seed color on antioxidant activity in adzuki beans. In line with our findings, a recent investigation showed much lower DPPH• scavenging activity in white adzuki beans as compared to other colored genotypes, including black and red adzuki beans (Nagao et al., 2023). In another study, Kim et al. (2015) observed that black adzuki beans had higher DPPH• scavenging activity and ABTS•+ scavenging activity than red adzuki beans, further signifying the influence of seed color. In general, our findings demonstrated that seed coat color variation had a significant effect on adzuki bean antioxidant activities. As a result, it can be concluded that white adzuki beans do not have the same antioxidant content as gray and red adzuki beans.
Multivariate analysis
To gain a better understanding of the changes in total metabolite contents and antioxidant activity among the adzuki beans studied, hierarchical cluster analysis (HCA), principal component analysis (PCA), and Pearson’s correlation analysis were conducted. The HCA in Fig. 2A clearly shows the low levels of TPC, TSC, and antioxidant activities in white adzuki beans. This result was reinforced further by the PCA, which was computed along the first two principal components (PC1 and PC2), which together contributed more than 90% of the total variance. As shown in the score plot, white adzuki beans were differentiated from gray and red adzuki beans (Fig. 2B). The gray and red landraces, on the other hand, were widely scattered with one another. As indicated in Fig. 2C and Table 2, TPC (20.44%), DPPH• scavenging activity (20.67%), ABTS•+ scavenging activity (21.85%), and FRAP (21.03%) contributed the most to the variations observed along PC1, while TSC (74.12%) contributed the most along PC2. This was consistent with the HCA, which showed that TPC, ABTS•+ scavenging activity, DPPH• scavenging activity, and FRAP were all clustered together (Fig. 2A). In general, the PCA supported by HCA in our study clearly separated white adzuki beans from gray and red accessions. As a result, TSC, TPC, ABTS•+ scavenging activity, DPPH• scavenging activity, and FRAP could be important traits for distinguishing a diverse population of adzuki bean genetic materials with varying seed coat colors.
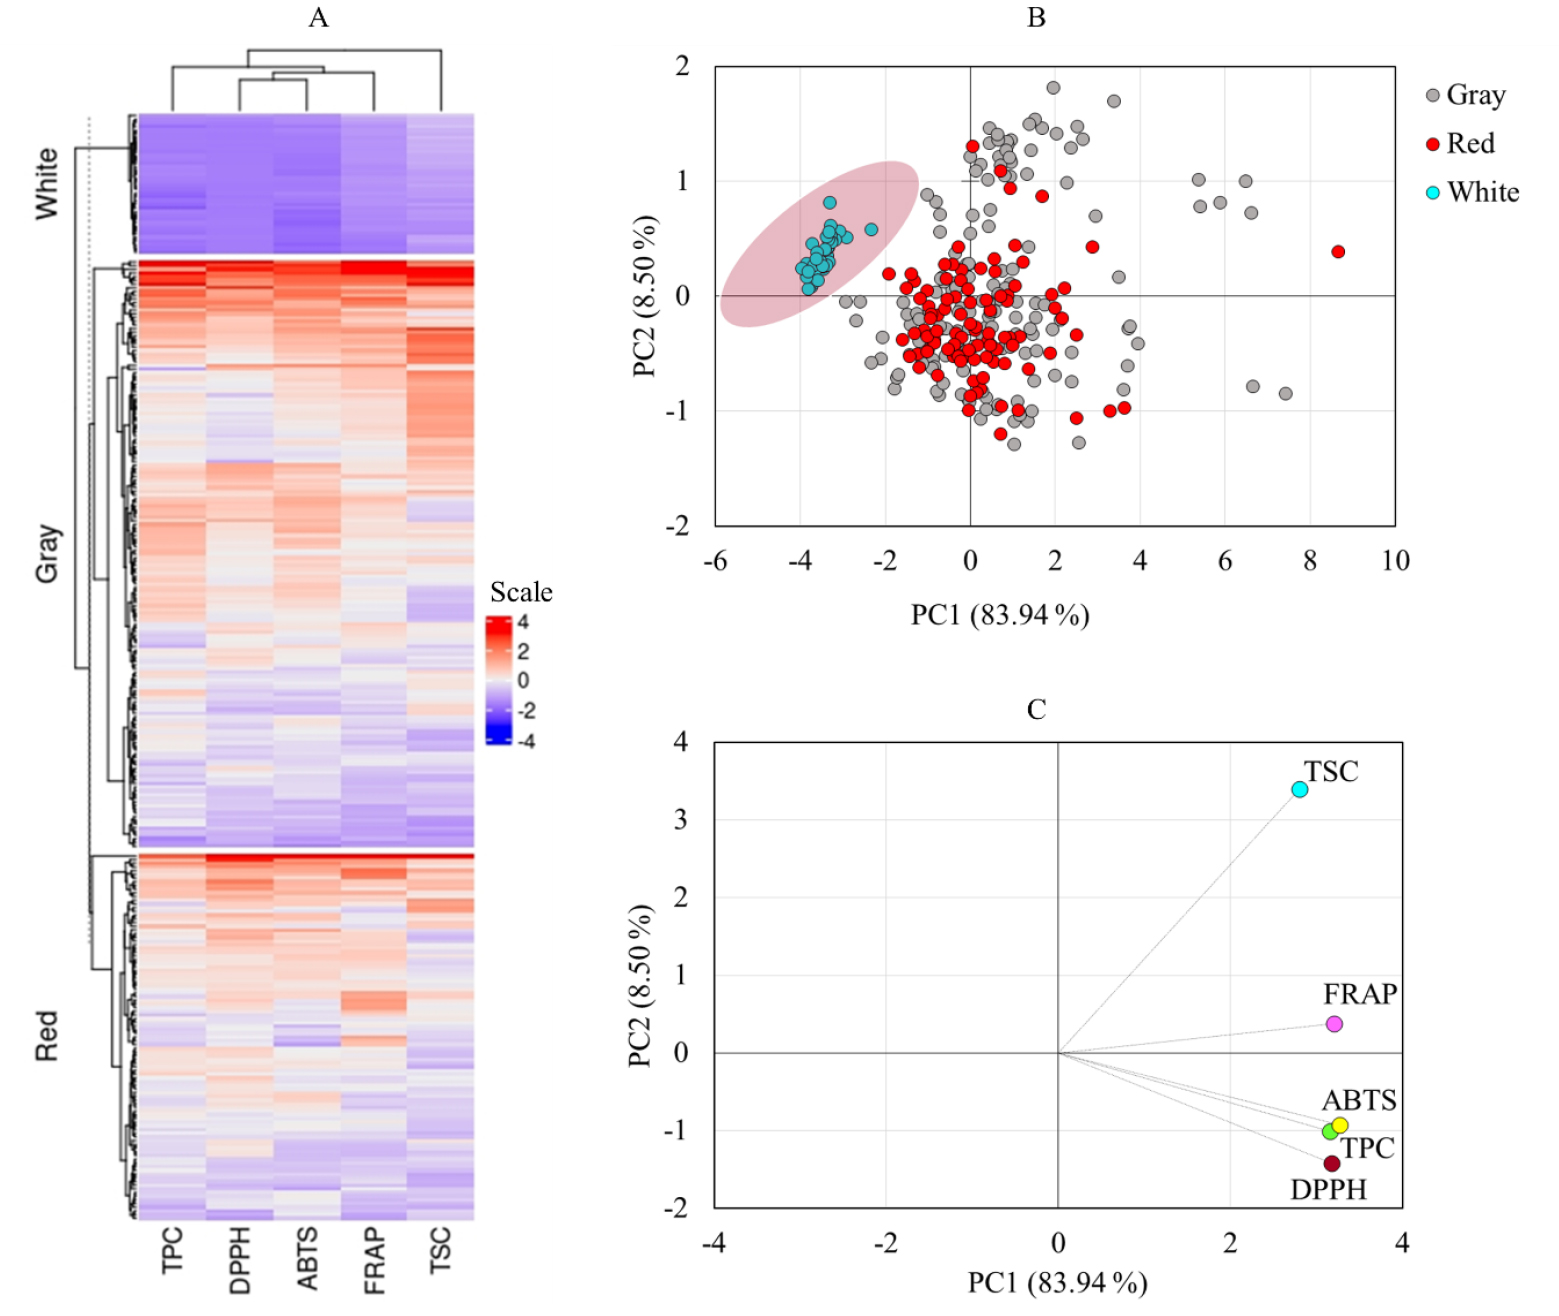
Fig. 2.
Hierarchical cluster analysis (A), score plot of adzuki beans (B), and loading plot of variables (C) from principal component analysis. ABTS, ABTS•+ scavenging activity; DPPH, DPPH• scavenging activity; FRAP: Ferric reducing antioxidant power; TPC: Total phenolic content; TSC: Total saponin content.
Table 2.
Total phenolic content, total saponin content, and antioxidant activity of top-performing adzuki bean accessions.
Pearson’s correlation analysis was performed to compute the correlation between the analyzed parameters. Positive and strong correlations were found between the examined variables in all the adzuki beans. However, the correlation coefficient (r) values were greater in gray (Fig. 3A) and red (Fig. 3B) adzuki beans than in white (Fig. 3C) adzuki beans. In gray adzuki beans, for example, TPC had r = 0.81 with DPPH• scavenging activity, r = 0.76 with ABTS•+ scavenging activity, and r = 0.63 with FRAP, all of which were significant at p < 0.001. However, in white adzuki beans, the correlation of TPC with DPPH• scavenging activity, ABTS•+ scavenging activity, and FRAP was considerably weaker, with r of 0.58, 0.26, and 0.48, respectively. TSC also correlated with antioxidant activities in a similar way as TPC, with r ≥ 0.61 in gray, r ≥ 0.52 in red, and r ≥ 0.47 in white adzuki beans. Generally, TSC and TPC demonstrated positive associations with all antioxidant activities and with each other regardless of seed coat color (Fig. 3D), with all except the TPC link with ABTS•+ scavenging activity in white adzuki beans being significant. The observed strong and positive correlations were consistent with several prior research (Han et al., 2022; Lee et al., 2017a).
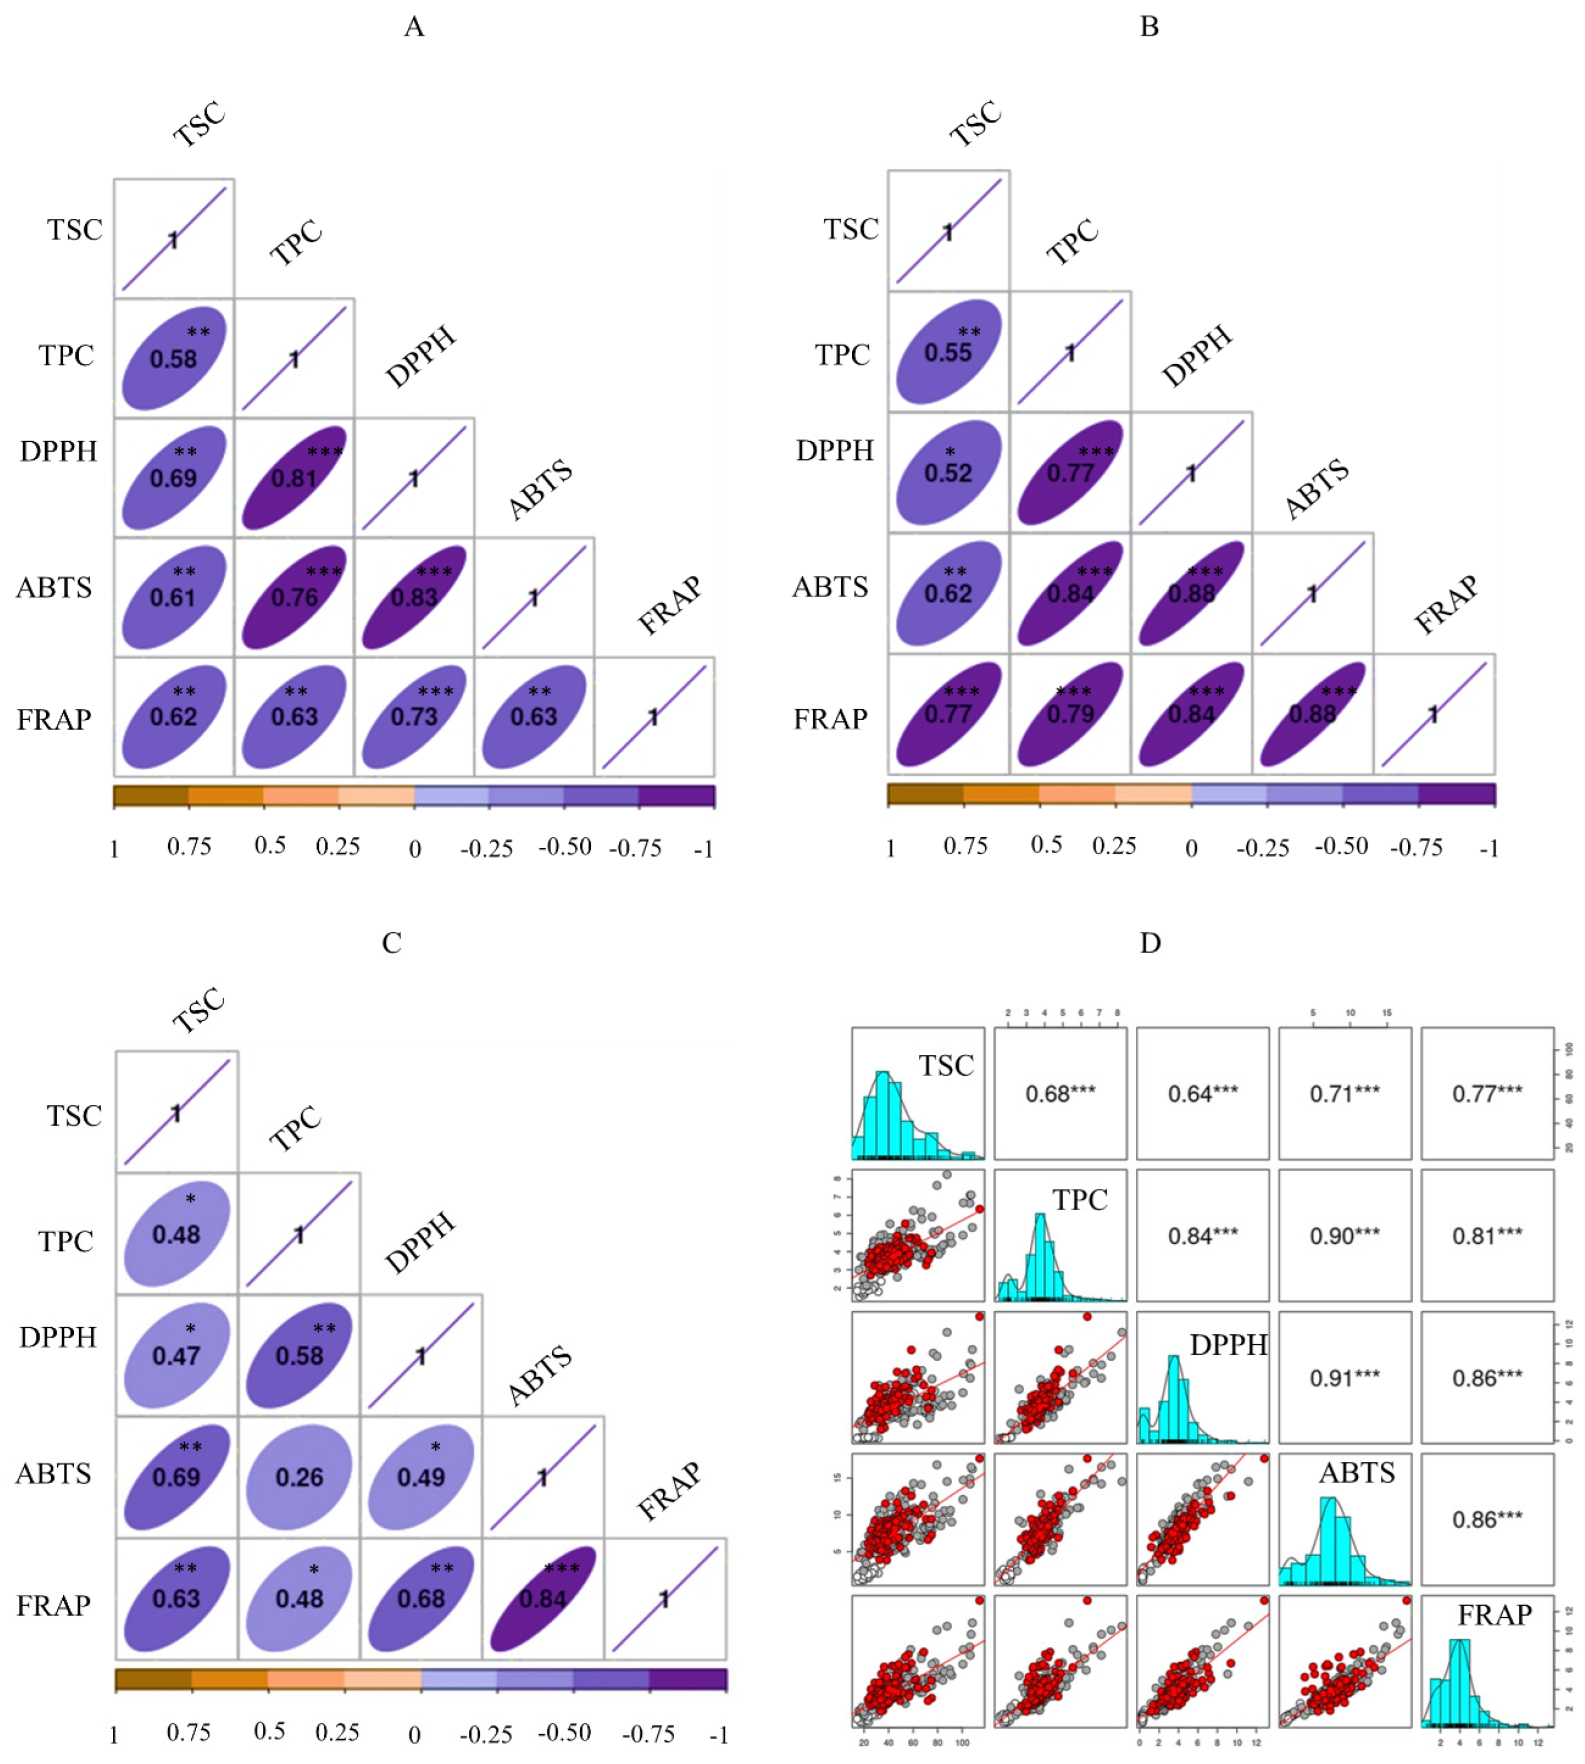
Fig. 3.
Pearson correlation matrix of metabolite contents and antioxidant activities in gray (A), red (B), and white (C) adzuki beans, and the entire dataset (D). ABTS, ABTS•+ scavenging activity; DPPH, DPPH• scavenging activity; FRAP: Ferric reducing antioxidant power; TPC: Total phenolic content; TSC: Total saponin content. *p < 0.05, **p < 0.01, ***p < 0.001.
To summarize, this study investigated the variations of total phenolic content, total saponin content and antioxidant activities among a large population of adzuki bean accessions cultivated in Korea. All the variables studied including total phenolic content, total saponin content, DPPH• scavenging activity, ABTS•+ scavenging activity, and ferric-reducing antioxidant power demonstrated a large range of variability among the adzuki beans. Furthermore, seed coat color variation had a significant effect on all of the parameters, with gray adzuki beans having the highest average values of all except DPPH• scavenging activity and white landraces having the lowest levels. As previously indicated, adzuki beans with high levels of TPC and TSC are useful due to their multiple health benefits (Li et al., 2022). This study also identified the top 15 superior adzuki beans showing the highest levels of each parameter (Table 3). In particular, accessions IT-194575, IT-216286, IT-216298, IT-216299, and IT-216305 contained high levels of total phenolic content, total saponin content, DPPH• scavenging activity, ABTS•+ scavenging activity, and ferric-reducing antioxidant power all at the same time. Accession IT-216303, on the other hand, showed high levels of all parameters except DPPH• scavenging activity, whereas accession IT-216306 showed high levels of all parameters except total saponin content. Accession IT-216300 likewise had high levels of all parameters except total saponin content and DPPH• scavenging activity. As a result, these accessions have the potential to be valuable sources of health-promoting metabolites. Furthermore, the findings of this study may inspire further molecular research in the future. Identifying specific saponins and polyphenol components in gray, red, and white adzuki beans, on the other hand, would also be a good future research endeavor.
Table 3.
Eigenvalues and individual and cumulative contributions of variables in the first five principal components.
ABTS, ABTS•+ scavenging activity; DPPH, DPPH• scavenging activity; FRAP: Ferric reducing antioxidant power; TPC: Total phenolic content; TSC: Total saponin content. PC1: First principal component; PC2: Second principal component; PC3: Third principal component; PC4: Fourth principal component; PC5: Fifth principal component.
