

INTRODUCTION
MATERIALS
Data acquisition
Augmentation
METHODS
VGGNet
GoogLeNet
NASNet
MobileNet
ResNet
ResNet50
Model performance evaluation
RESULTS
Confusion matrix analysis
Comparative performance evaluation
DISCUSSION
CONCLUSIONS
INTRODUCTION
Soybean (Glycine max) is a crucial economic crop, serving as a primary source of vegetable oil and plant-based protein (Specht et al., 2014). The growing global demand for soy-based products, driven by an increasing number of vegetarians and the need for sustainable protein sources, highlights the importance of improving soybean quality and yield. Leaves are essential in assessing plant health, as their color, shape, and texture provide vital diagnostic information for phenotypic analysis. Monitoring leaf characteristics effectively is fundamental for identifying plant traits, stress conditions, and overall crop performance. However, traditional monitoring methods depend on manual expert assessments, which are labor- intensive, time-consuming, and often damaging. To address these limitations, researchers have increasingly turned to machine learning techniques to automate plant identification and classification.
Leaf classification has been approached using various morphological features, including shape, color, texture, and vein structure. Du et al. (2013) utilized contour and vein fractal dimensions for leaf recognition, while Chaki et al. (2015) categorized plant leaves based on texture and shape. Similarly, Yigit et al. (2019) combined color, shape, and texture for plant identification, and Turkoglu & Hanbay (2019) proposed a classification method that incorporates color, shape, and vein characteristics. Despite promising experimental results, these feature-based methods lack generalizability due to their dependence on handcrafted feature extraction, which is inadequate for effectively distinguishing plant varieties in diverse environments (Yamaguchi et al., 2021).
Recent advancements in deep learning, particularly Convolutional Neural Networks (CNNs), have significantly improved plant classification accuracy. CNNs are highly effective in image analysis, enabling automatic feature extraction without manual intervention. These techniques also offer the advantage of non-destructive phenotypic assessment. Tiwari (2020) utilized a dataset from Silva et al. (2013) and achieved a classification accuracy of 95.58%. Yang et al. (2020) applied CNNs after background separation, obtaining classification accuracies of 91.5%, 92.4%, and 89.6% using VGG16, VGG19, and Inception-ResNetV2, respectively. However, intra-species cultivar classification remains a significant challenge due to subtle morphological differences between leaves. Wang et al. (2020) introduced a dataset containing 200 soybean cultivars with 10 images per class and developed a multiscale sliding code matching method for identification. Tavakoli et al. (2021) enhanced cultivar classification using a CNN-based discriminant loss function, achieving an accuracy of 91.37%. Nevertheless, most prior studies utilized images with simple, controlled backgrounds, whereas real-world field conditions involve complex backgrounds, including soil, weeds, and agricultural materials, which can negatively impact classification performance.
This study aims to develop an optimized CNN model for classifying soybean varieties in complex field environments. Training CNNs from scratch requires extensive data and computational resources; therefore, transfer learning is often used to fine-tune pre-trained models for specific tasks with limited datasets (Kamilaris & Prenafeta-Boldú, 2018). Given the limited dataset in this study, we fine-tuned the ResNet50 model, trained initially on ImageNet (Deng et al., 2009), to improve its ability to distinguish between soybean cultivars. Our research involved acquiring and processing field images, optimizing ResNet50 for enhanced classification accuracy, and comparing its performance with other models, including VGG, Inception, MobileNet, NASNet, and an optimized version of ResNet50. By addressing classification challenges in complex agricultural settings, this study contributes to the development of robust, automated crop monitoring solutions.
MATERIALS
Fig. 1 provides a diagrammatic overview of the soybean leaf classification process using a CNN model. The manually collected leaf dataset was divided into a training set (80%) and a test set (20%), comprising 3,862 and 965 images, respectively. Image preprocessing was applied to both datasets to enhance model performance. Since each pixel in an RGB image is represented by a three-dimensional matrix (RGB channels), we normalized pixel values by dividing by 255.0, thereby scaling them to a range of 0 to 1. Additionally, data augmentation techniques were used on the training set before it was fed into the pre-trained CNN model. The performance of the trained model was then evaluated using the test dataset.
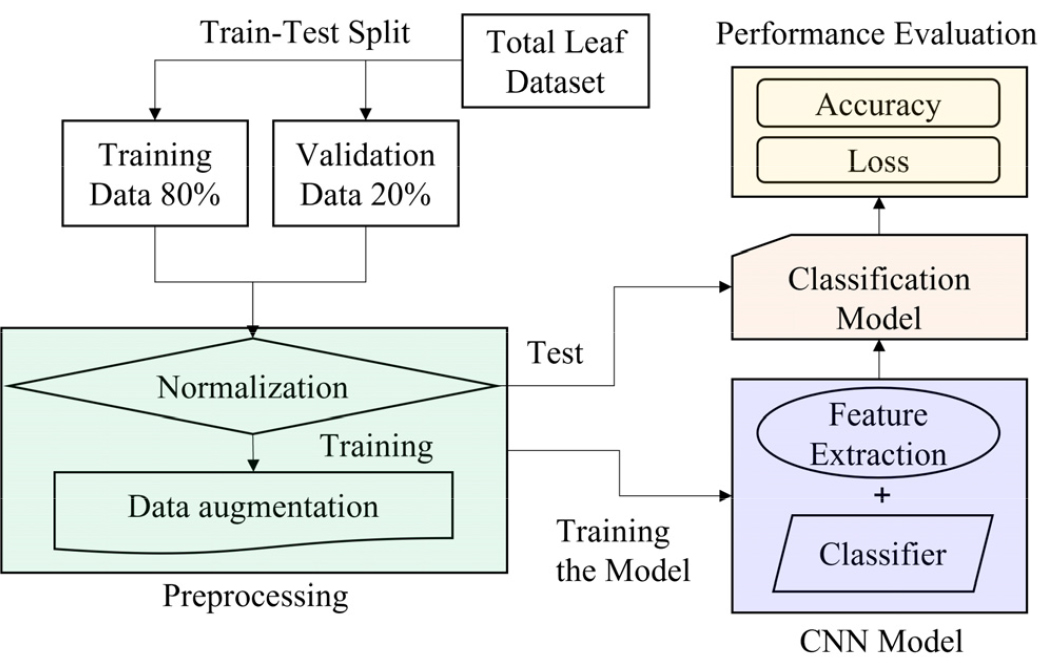
Fig. 1.
Diagrammatic representation of the soybean leaf classification process utilizing convolutional neural network (CNN) models. The complete dataset (total n = 4,827) was divided into training (n = 3,862) and validation (n = 965) subsets. The training set underwent normalization and data augmentation, followed by feature extraction and classification. Model performance was evaluated using accuracy and loss metrics based on the validation dataset.
Data acquisition
This study focused on two soybean cultivars, Daepung-2-ho and Pungsannamul, which are widely cultivated in Korea (Fig. 2). Image data were collected from experimental fields at Chonnam National University (CNU) and the National Institute of Crop Science (NICS) over two years (2021–2022). A total of 4,827 leaf images were manually gathered, consisting of 2,740 Daepung-2-ho samples and 2,087 Pungsannamul samples (Table 1).
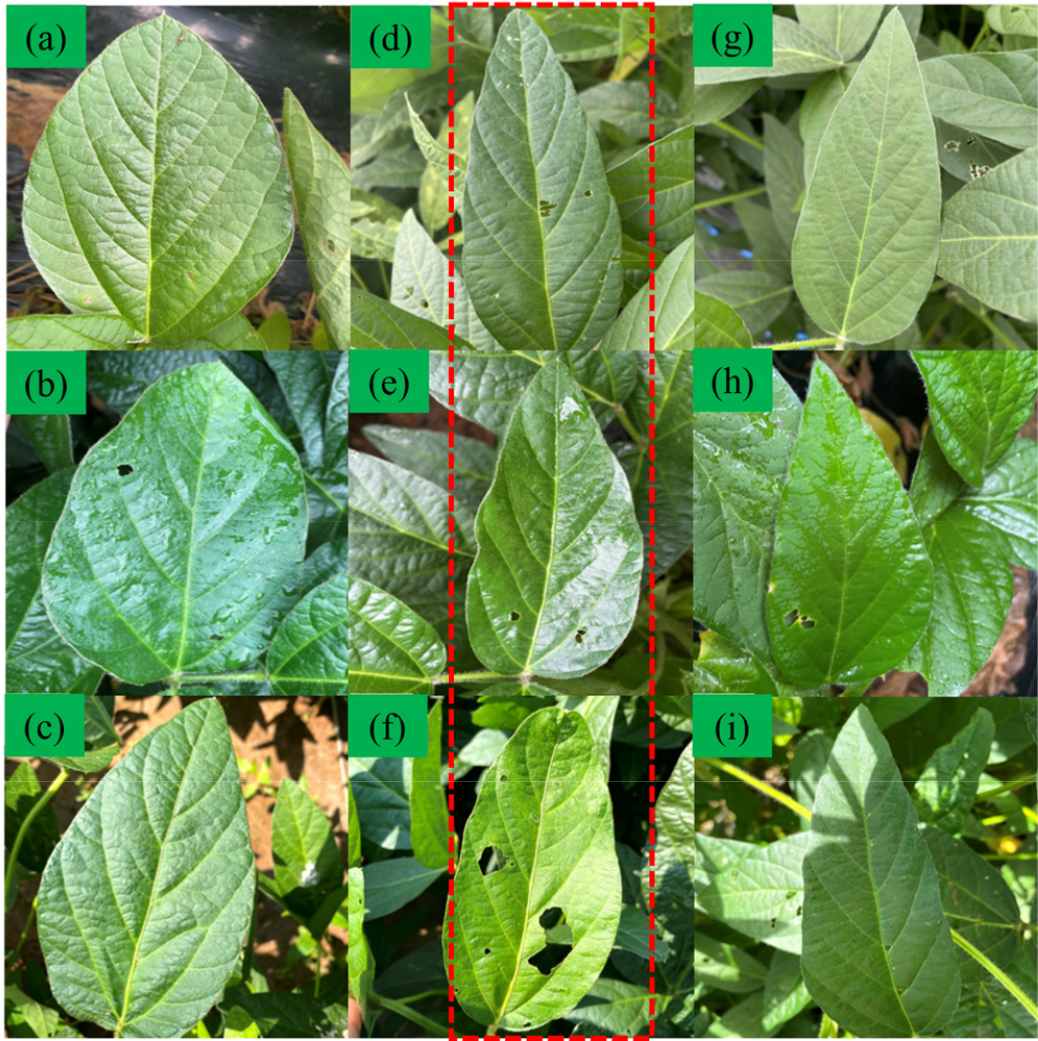
Fig. 2.
Photographs of soybean leaf images selected from Daepung (a–f) and Pungsannamul (g–i) included in the study dataset. Images within the red dotted box (d–f) highlight morphological variation observed within the Daepung variety, reflecting differences in leaf shape and demonstrating intra-variety variability relevant to model training and evaluation.
Table 1.
Information on the acquisition of the soybean leaf dataset.
|
Date (MM/DD/YY) | Site† | Weather condition |
Picture (EA) |
| 08/20/21 | CNU | Sunny | 629 |
| 08/30/21 | CNU | Cloudy | 798 |
| 09/08/21 | CNU | Cloudy | 638 |
| 07/26/22 | CNU | Sunny | 542 |
| 08/10/22 | CNU | Cloudy | 574 |
| 08/17/22 | CNU | Rainy | 599 |
| 08/18/22 | NICS | Sunny | 1,046 |
To standardize the dataset, all images were resized to 224 × 224 pixels. The dataset was then divided into three subsets: a training set with 3,090 images, a validation set with 772 photos, and a test set with 965 photos. Each class (Daepung-2-ho and Pungsannamul) was split into training (training + validation) and test data in an approximate 8:2 ratio.
Augmentation
CNN models typically require large and diverse training datasets to achieve high accuracy. However, manual data collection is expensive, labor-intensive, and time-consuming. To address this limitation, data augmentation techniques were employed to expand the training dataset artificially, enhancing model generalization and robustness (Waheed et al., 2020).
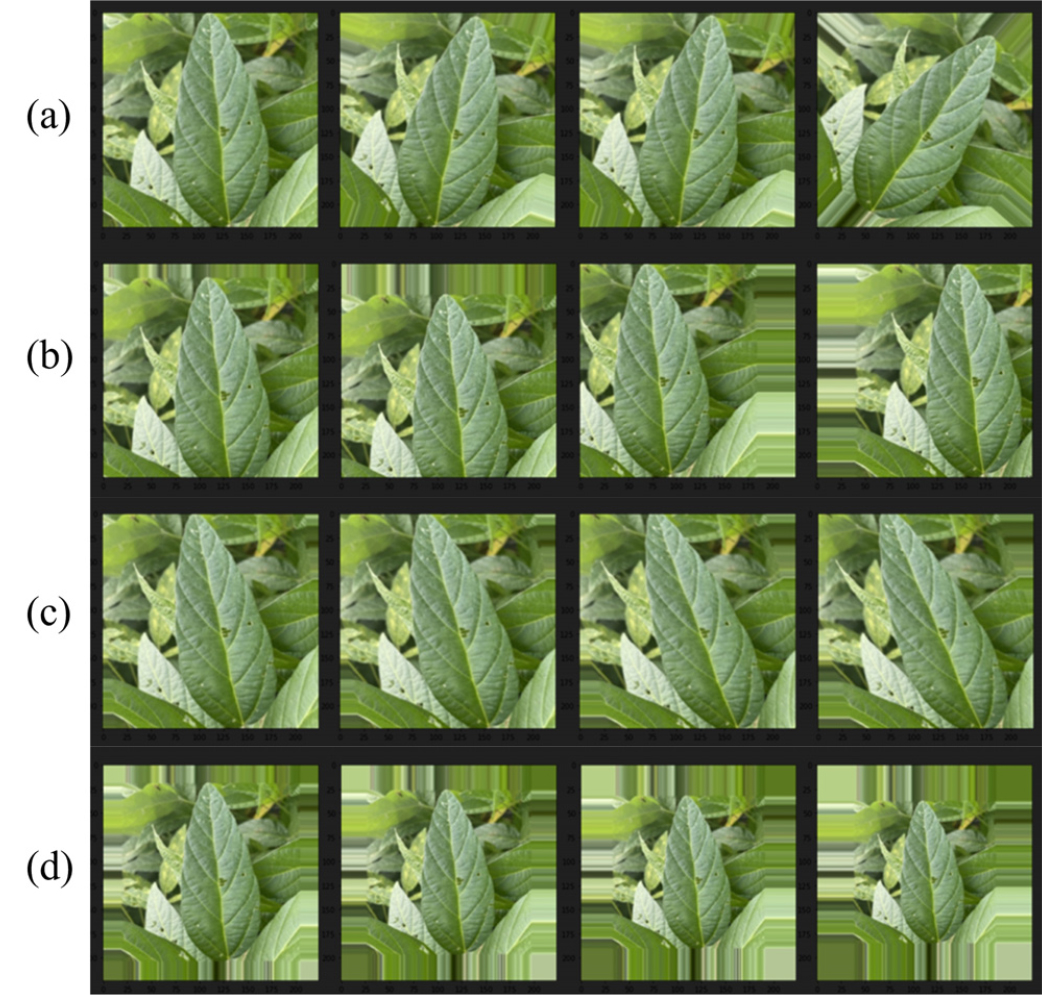
Augmentation was conducted by applying controlled distortions to existing images, thereby increasing data variability while preserving essential features. The applied augmentation techniques included rescaling, rotation, width shift, height shift, shear transformation, and zooming. The specific augmentation parameters used are detailed in Table 2. Fig. 3 illustrates an example of an augmented image. Augmentation improves classification performance by allowing the model to learn from slightly altered versions of the same image, boosting its ability to recognize soybean varieties under varying environmental conditions (Kang et al., 2021).
METHODS
Convolutional Neural Networks (CNNs) are commonly utilized for image classification by identifying patterns in pixel data and learning hierarchical features directly from images. The specific hyperparameter configurations employed during model training are detailed in Table 3. A CNN consists of two primary components:
a. Feature extraction – This stage includes multiple convolutional and pooling layers. Convolutional layers apply filters to the input image to detect features, while pooling layers reduce the spatial dimensions, enhancing computational efficiency and highlighting key features.
b. Classification – The extracted features are flattened into a one-dimensional vector and processed by a fully connected layer to produce the final classification output.
Table 3.
Hyperparameters for model training.
| Parameter | Value |
| Target size | 224×224×3 |
| Learning rate | 0.0001 |
| Batch size | 32 |
| Epoch | 50 |
| Weight | Initialized to ImageNet |
| Optimizer | Adam |
| Loss function | Binary cross entropy |
The development of CNNs gained traction with AlexNet (Krizhevsky et al., 2017), spurring rapid advancements in deep-learning models. This study evaluates five widely used CNN architectures—VGGNet, GoogLeNet, NASNet, MobileNet, and ResNet—as benchmarks.
VGGNet
VGGNet, developed by the Oxford Visual Geometry Group (VGG), extracts image features at low spatial resolutions (Simonyan, 2014). The architecture consists of stacked 3×3 convolutional filters with a stride of 1, enabling deeper networks while ensuring computational efficiency. Utilizing two 3×3 filters provides the same receptive field as a 5×5 filter, and three 3×3 filters approximate a 7×7 filter, which reduces the number of parameters and enhances learning efficiency.
VGGNet has two popular versions: VGG16 and VGG19, which vary in the number of convolutional layers. As shown in Fig. 4, VGG16 includes several convolutional layers, followed by three fully connected layers and a Softmax activation function for classification.
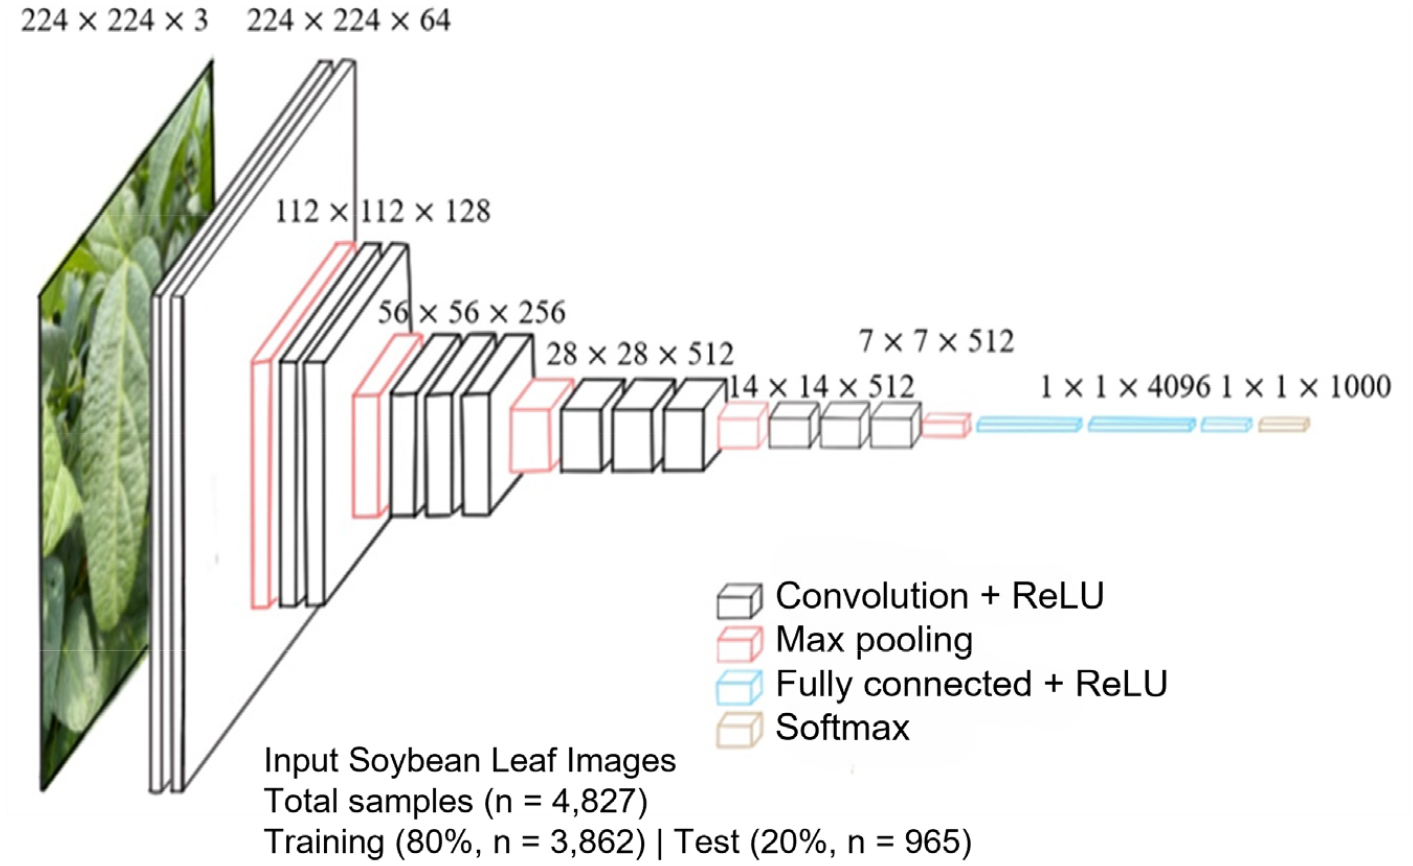
Fig. 4.
Architecture of VGGNet (VGG16) for soybean variety classification. Input images (n = 4,827) with dimensions of 224×224 pixels were fed into the convolutional neural network (CNN). The dataset was divided into training (n = 3,090), validation (n = 772), and test sets (n = 965). Each convolutional block (Convolution + ReLU) was followed by Max pooling operations, culminating in fully connected layers with ReLU activation and a final Softmax layer for classification into soybean varieties.
GoogLeNet
Deeper neural networks typically require more parameters, which increases computational complexity and leads to issues like overfitting and vanishing gradients. To tackle these challenges, Google introduced the Inception architecture, enabling deeper networks without excessive computational costs (Szegedy et al., 2015).
GoogLeNet uses Inception modules that apply multiple filters (1×1, 3×3, and 5×5) simultaneously, capturing multi-scale features. As shown in Fig. 5, an initial 1×1 convolution reduces dimensionality before executing 3×3 and 5×5 convolutions, significantly lowering the number of parameters while improving feature extraction.
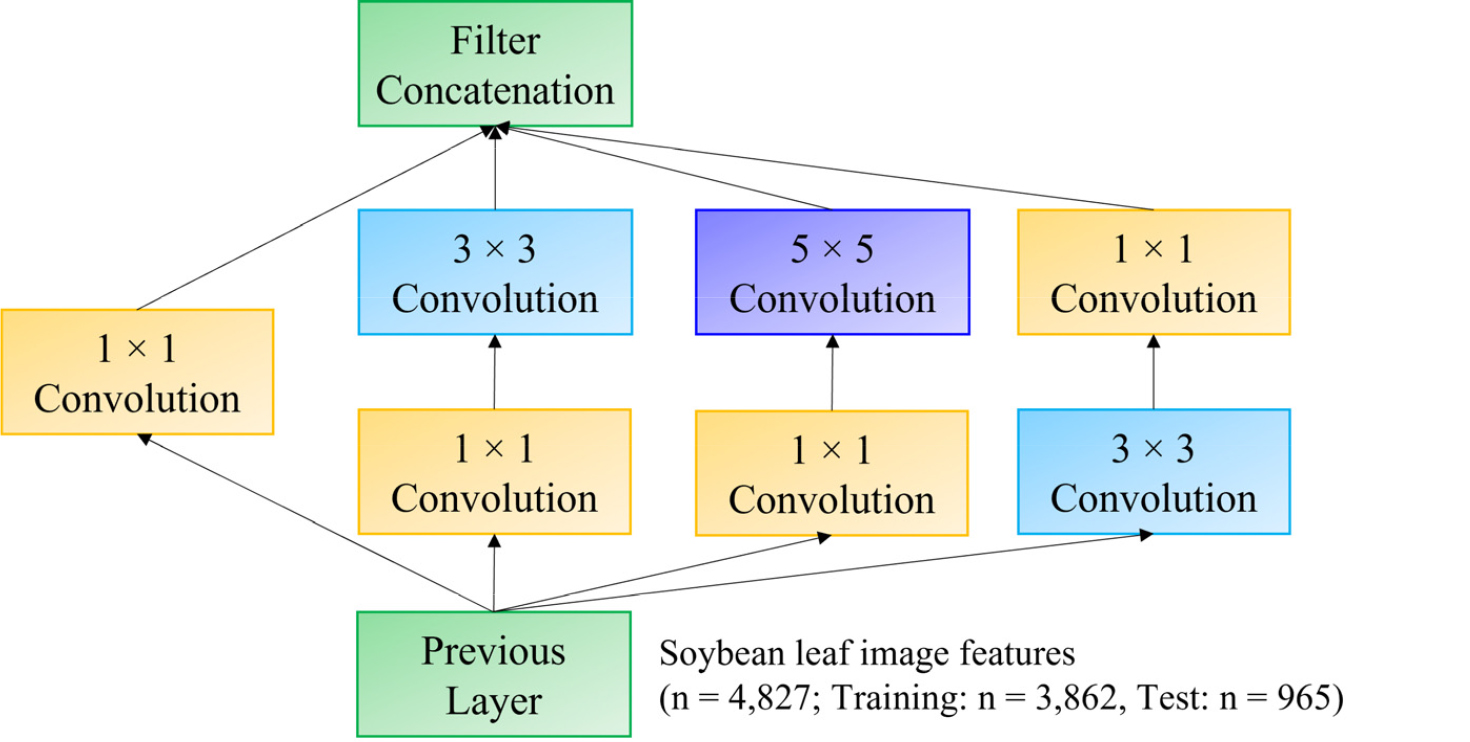
Fig. 5.
Inception module architecture with dimensionality reduction used in GoogLeNet for soybean variety classification. Input from the previous layer (image features extracted from soybean leaves; total samples n = 4.827) is processed through parallel convolutional pathways with filters of different sizes (1×1, 3×3, and 5×5), followed by dimensionality reduction via 1×1 convolutions. Feature maps from each convolutional pathway are concatenated (green boxes) to integrate multi-scale features, enhancing model robustness and classification accuracy.
NASNet
Unlike traditional CNNs, the Neural Architecture Search Network (NASNet) does not depend on manually designed architectures. Instead, it utilizes reinforcement learning and recurrent neural networks (RNNs) to discover optimal convolutional structures automatically (Zoph et al., 2018).
NASNet is first trained on a smaller dataset (CIFAR-10) to identify convolutional building blocks, which are subsequently applied to larger datasets such as ImageNet. As depicted in Figs 6a and 6b, NASNet includes reduction cells (which decrease feature map dimensions) and normal cells (which maintain feature size), both discovered through automated search algorithms. The number of stacked cells (N) and the number of channels per cell are adjustable hyperparameters.
MobileNet
MobileNet is designed for mobile and edge computing devices, emphasizing efficiency while maintaining competitive performance (Sandler et al., 2018). It utilizes depth-wise separable convolutions, which lower computational costs by separating spatial and depth-wise operations. Instead of applying convolutions across all RGB channels simultaneously, MobileNet performs the following:
a. Depth-wise convolutions – Applying a single filter per input channel significantly reduces computation.
b. Pointwise convolutions – Using 1×1 convolutions to merge features across channels.
As illustrated in Figs. 6c and 6d, MobileNetV2 enhances efficiency by first applying pointwise convolutions to expand channels before executing depth-wise convolutions, thereby reducing computational overhead.
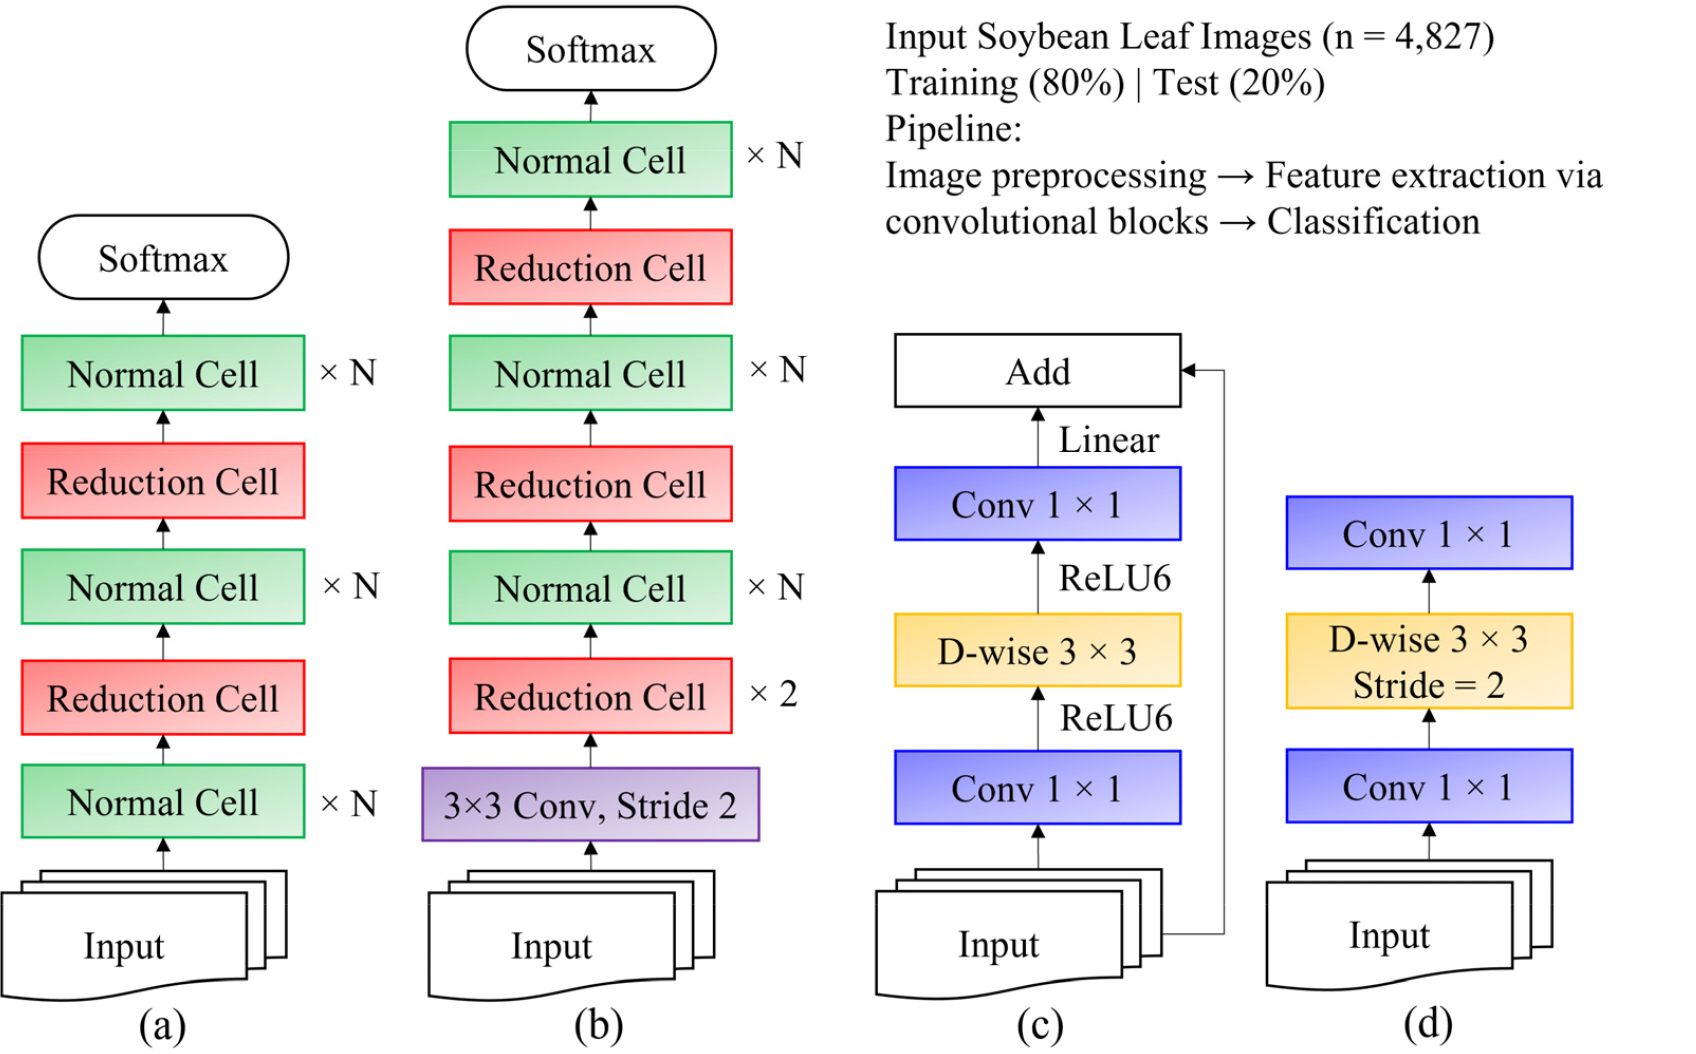
Fig. 6.
Scalable architectures utilized in this study, including architectures originally for CIFAR10 (a) and ImageNet (b), and the convolutional (Conv) blocks of MobileNet: residual block (c) and inverted residual block (d). The dataset of soybean leaf images (total n = 4,827; training: n = 3,090; validation: n = 772, test: n = 967) was processed through these architectures for variety classification. In MobileNet blocks (c, d), the blue boxes represent point-wise convolutions (1×1 Conv), and the yellow boxes denote depth-wise (D-wise) separable convolutions, optimizing computational efficiency.
ResNet
Residual Networks (ResNet) tackle the challenges of deep learning by introducing residual learning, as shown in Fig. 7 (He et al., 2016). Unlike traditional deep networks that struggle with vanishing gradients and degradation, ResNet incorporates shortcut connections that enable the network to retain information across layers. ResNet utilizes Residual Blocks, where the input bypasses intermediate layers and is added to the output, allowing the network to learn residual functions:
where H(x) denotes the desired transformation and F(x) is the residual function. By learning the residual instead of the entire transformation, the model preserves identity mappings, thereby mitigating vanishing gradients and accelerating convergence.
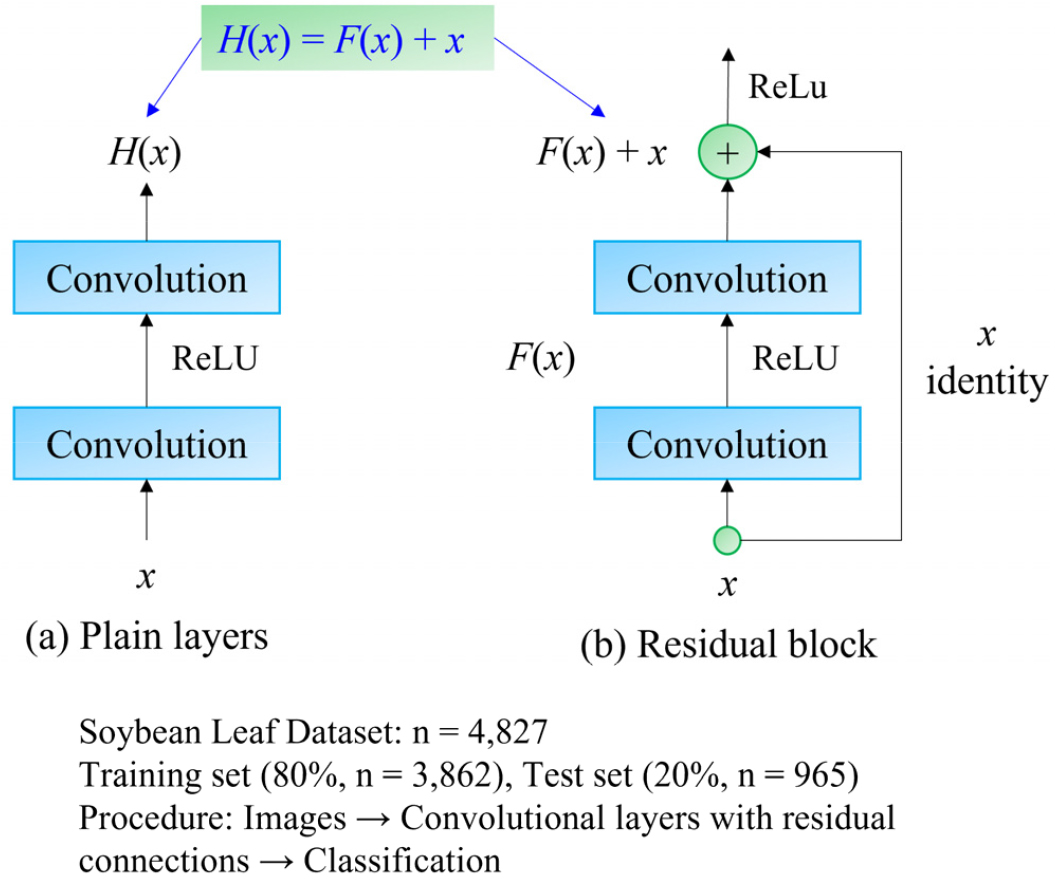
Fig. 7.
Bottleneck building blocks utilized in the ResNet architecture for soybean leaf variety classification. The figure illustrates the comparison between plain convolutional layers (a) and residual layers with skip connections (b), enabling improved gradient flow and model performance. A total of 4,827 soybean leaf images (training: n = 3,090; validation: n = 772, test: n = 967) were processed through these convolutional layers to classify soybean varieties.
Transfer learning was applied in this study to classify soybean leaves efficiently. Transfer learning utilizes pre-trained CNN models (Rawat & Wang, 2017), allowing for fast adaptation to new tasks. Since training CNNs from scratch requires large datasets, we fine-tuned ResNet50, which was pre-trained on ImageNet (Deng et al., 2009), to classify soybean leaves. Given the limited dataset size (<10,000 samples per class), training deep networks from scratch could lead to overfitting. To prevent this, we fine-tuned only the later layers while keeping the initial layers frozen (as they capture generic features). We adjusted the final layer to match the number of soybean classes, replacing the Softmax function with a sigmoid activation function for binary classification.
ResNet50
ResNet50, a 50-layer variant of ResNet, consists of identity blocks and convolution blocks (Fig. 8). Identity blocks utilize direct shortcut connections, while convolution blocks use 1×1 convolutions to align input and output dimensions when necessary. As illustrated in Fig. 3, ResNet50 adheres to a structured approach:
a. Multiple identity blocks process input features.
b.Skip connections and forward information directly to subsequent layers.
c.ReLU activation is applied following each residual addition.
d. Down-sampling is achieved by halving the kernel size and doubling the depth.
e. A final fully connected layer replaces Softmax with a sigmoid activation function for binary classification.
The key components of ResNet50 include:
a. Convolutional layers – Extract image features using learned filters.
b. Activation functions (ReLU) – Introduce non-linearity, enhancing gradient flow.
c. Pooling layers – Lower computational complexity and mitigate overfitting.
d. Batch normalization – Stabilizes learning and accelerates convergence.
By utilizing ResNet50 with transfer learning, we optimized classification performance while decreasing training time and risks of overfitting.
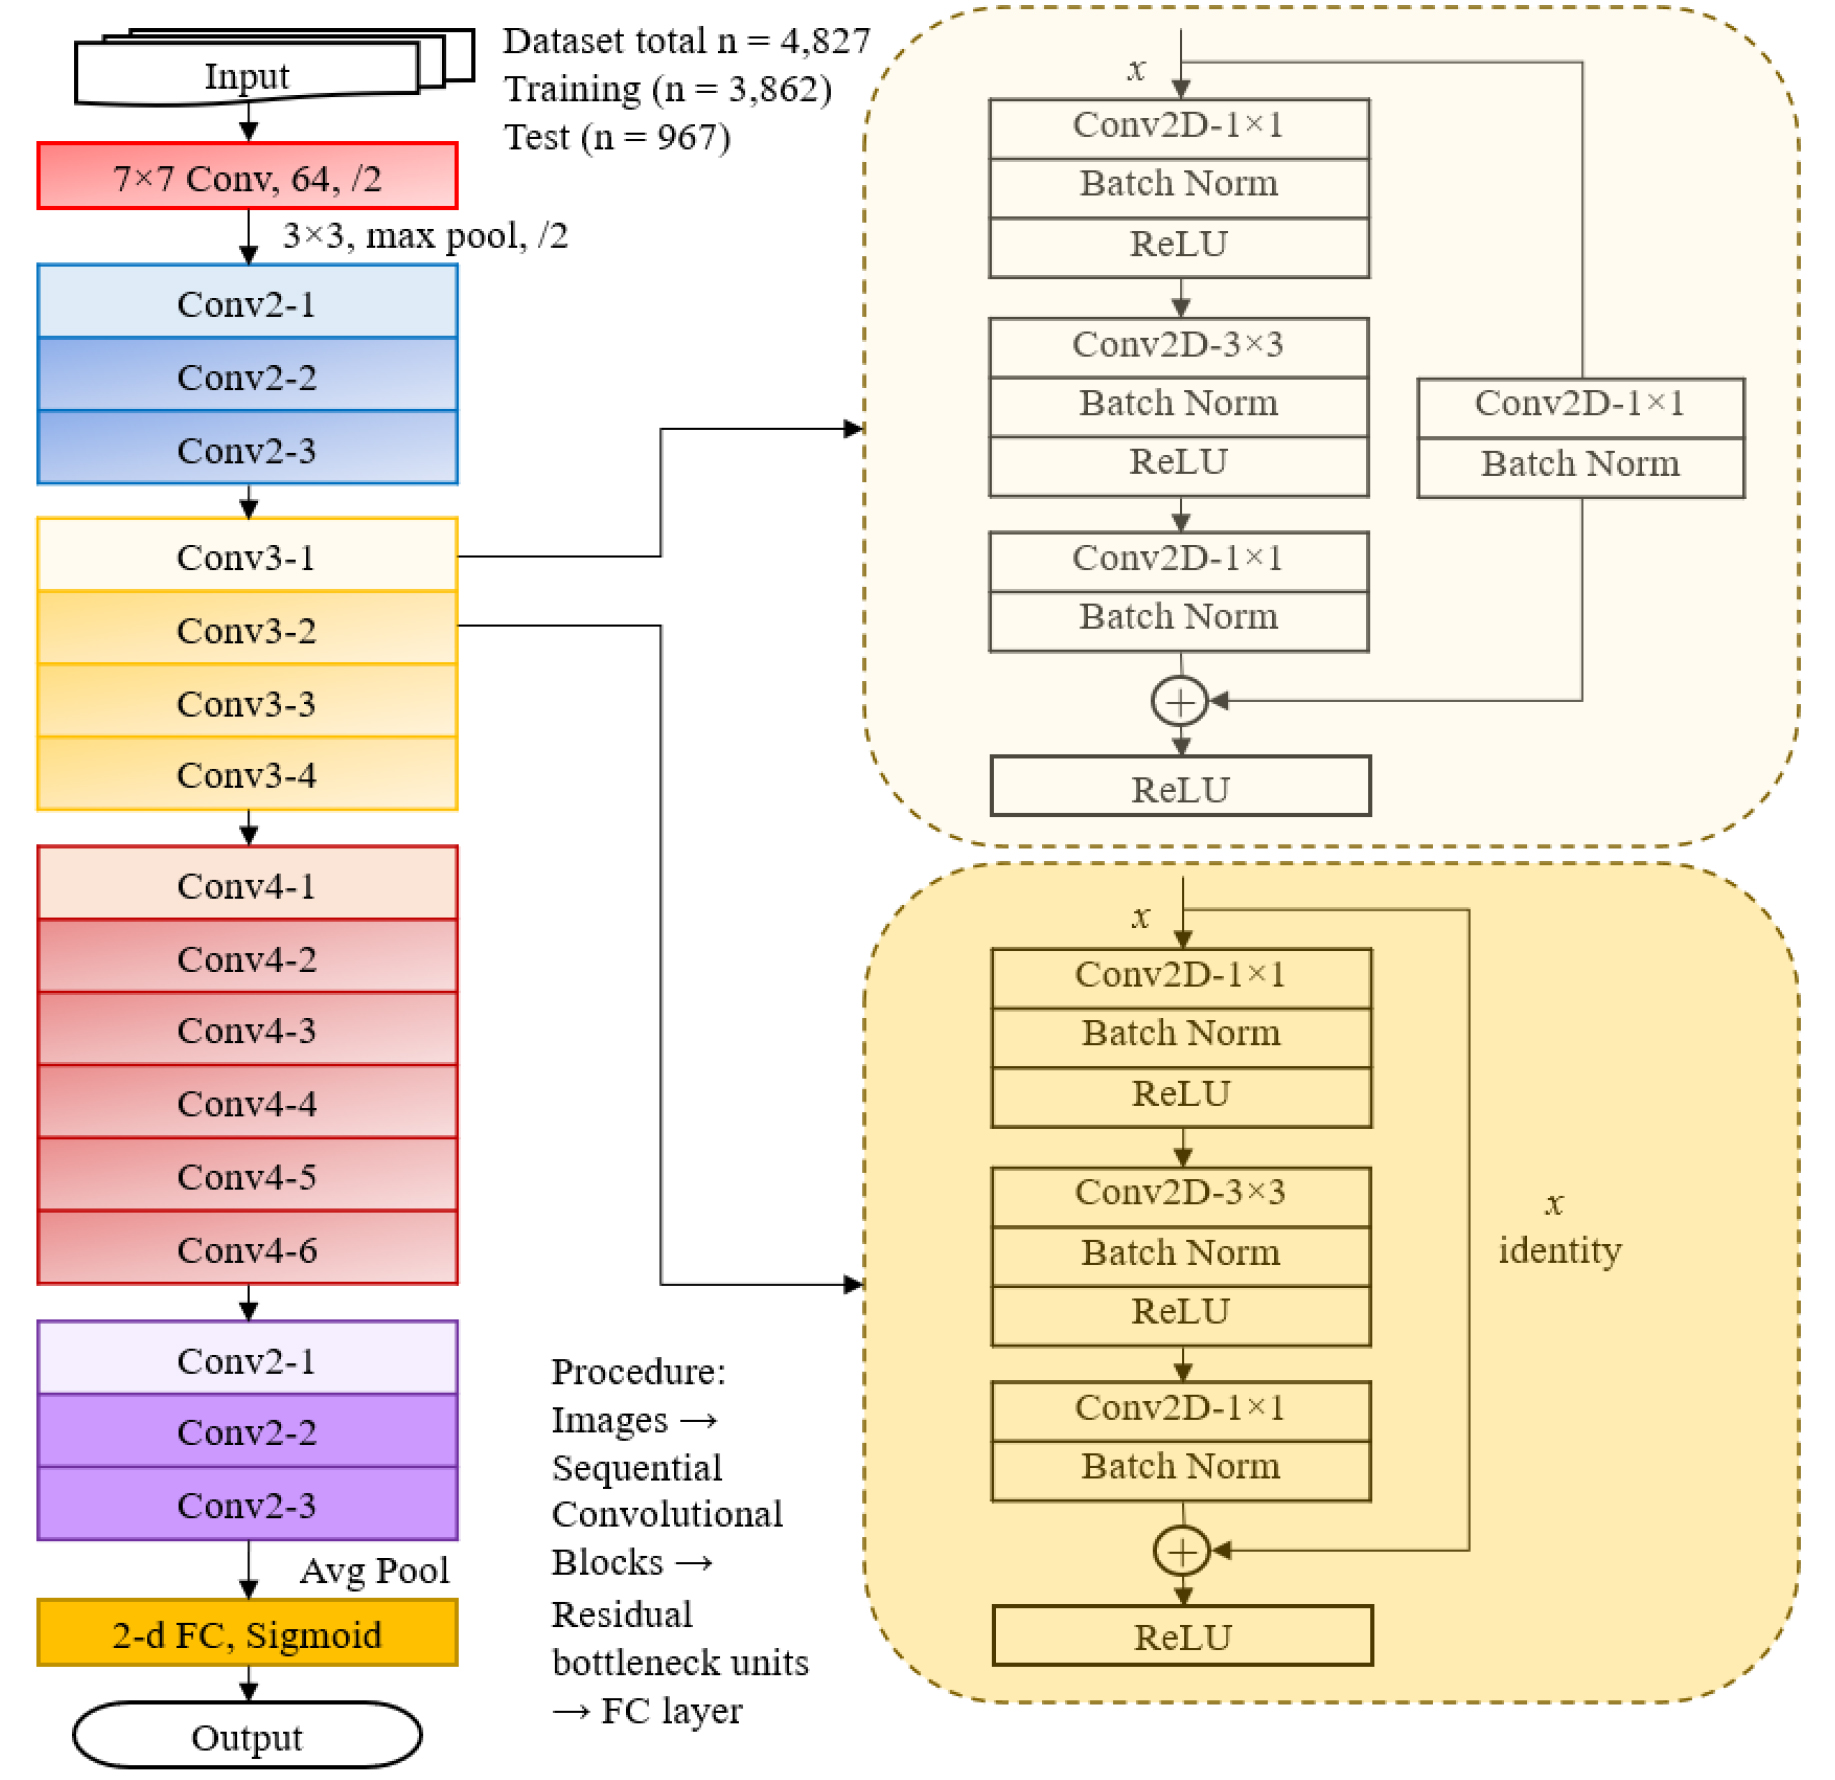
Fig. 8.
Architecture of ResNet-50 utilized for soybean variety classification in this study. Soybean leaf images (total n = 4,827; training: n = 3,090; validation: n = 772, test: n = 967) were processed through convolutional layers arranged in sequential convolutional blocks (Conv2, Conv3, Conv4, Conv5). Each block consists of repeated bottleneck units (example blocks shown in detail, right), including convolutional layers, batch normalization, ReLU activation, and residual connections to enhance training effectiveness. The final fully connected (FC) layer with sigmoid activation was employed for the binary classification of soybean varieties.
Model performance evaluation
The performance of a model trained on a test data set was evaluated using the F1 score, a metric commonly utilized in classification tasks, particularly when addressing imbalanced datasets. The F1 score represents the harmonic mean of precision and recall, thus offering a balance between the two. It is determined using a specific equation and ranges from zero to one, where one signifies perfect precision and recall, while zero indicates poor performance. This metric is advantageous when false positives and false negatives are considered equally significant. True Positives (TP) refer to accurately predicted positive samples, False Positives (FP) denote incorrectly predicted negative samples, and False Negatives (FN) refer to inaccurately predicted positive samples.
RESULTS
The dataset was divided into 3,862 images for training and validation and 965 images for testing. The initial model was trained with a learning rate of 0.0001 for 50 epochs. As shown in Fig. 9, prediction accuracy increased and converged as the number of iterations rose. The optimized model achieved a final classification accuracy of 94.5% and a loss of 17.64%. To benchmark performance, we trained four additional CNN architectures—VGG16, Inception-V3, MobileNetV3, and NASNet—for soybean leaf classification. A comparative analysis of classification accuracy and loss is presented in Table 4, demonstrating that the proposed model outperforms the other existing CNN models.
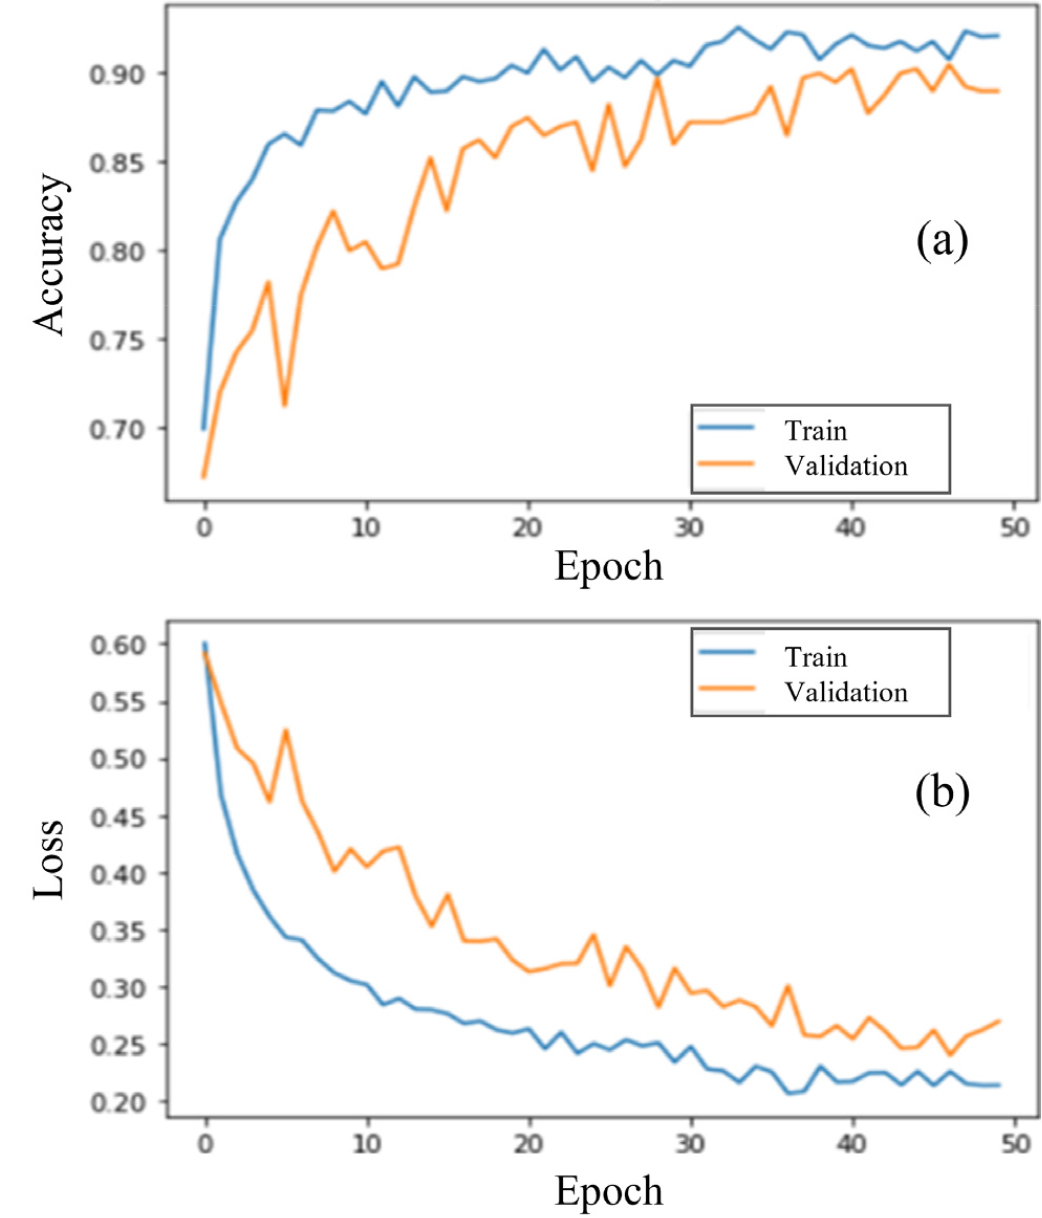
Fig. 9.
Training and validation performance curves for the convolutional neural network (CNN) model used in soybean variety classification. (a) Accuracy and (b) loss values for training and validation datasets across 50 epochs. The total dataset comprised 4,827 soybean leaf images (training: n = 3,090; validation: n = 772, test: n = 967).
Table 4.
Accuracy and loss rates of each model.
| Model |
Loss (%) |
Accuracy (%) |
| NasNet | 20.57 | 91.85 |
| Inception-V3 | 26.76 | 90.07 |
| MobileNet | 26.76 | 91.90 |
| VGG16 | 22.50 | 91.75 |
| ResNet50 | 17.64 | 94.50 |
Confusion matrix analysis
The proposed classification model’s performance was further assessed using a confusion matrix (Fig. 10). The green diagonal represents the correctly classified samples, while the off-diagonal values indicate misclassifications. The model accurately classified 906 out of 965 images, reinforcing its high predictive accuracy.
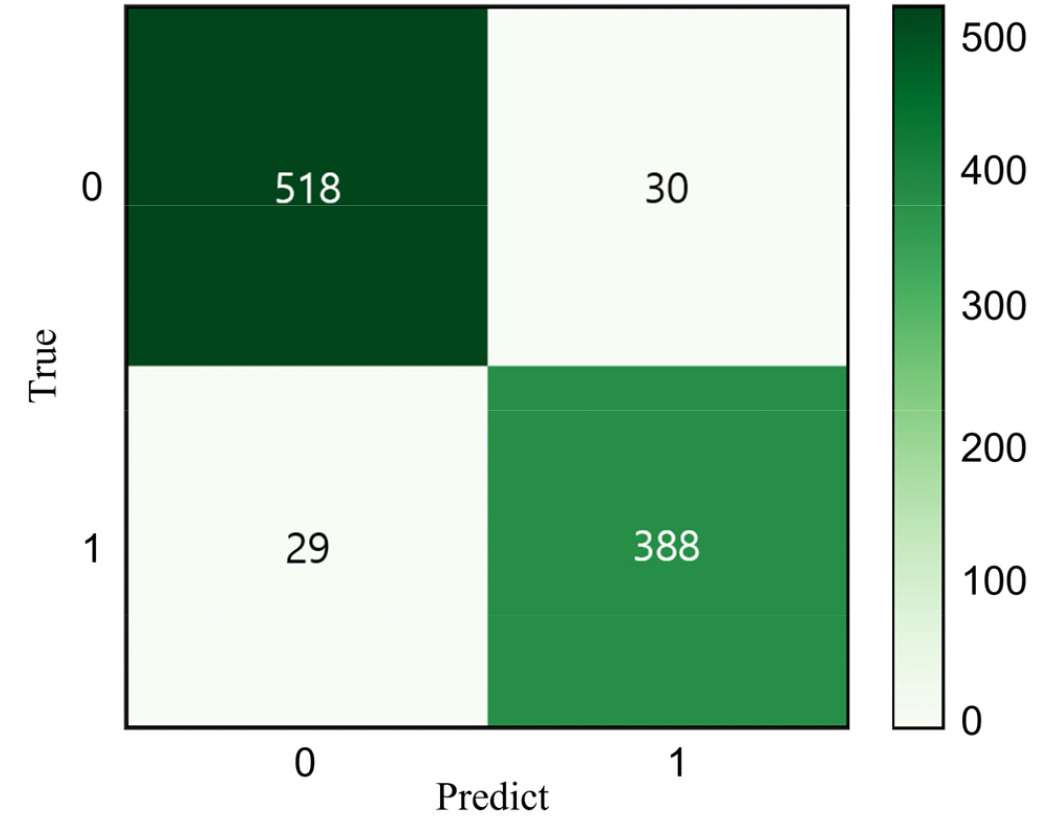
Fig. 10.
Confusion matrix illustrating classification results for soybean varieties Daepung (class 0) and Pungsannamul (class 1) based on the test dataset (n = 965). Values in each cell represent the number of correctly classified (diagonal) and misclassified (off-diagonal) leaf images, indicating model performance and classification accuracy.
Comparative performance evaluation
Table 5 presents a comparative analysis of model performance, including precision, recall, and F1 scores. The proposed model achieved the highest precision and recall among all evaluated architectures. The F1 scores closely align with the precision and recall values, indicating that the model is well-balanced and does not favor one class over another.
Table 5.
Evaluation results for each model based on the precision, recall, and F1-score metrics.
| Model | Precision | Recall | F1-score |
| NasNet | 0.88 | 0.88 | 0.88 |
| Inception | 0.89 | 0.87 | 0.87 |
| MobileNet | 0.90 | 0.90 | 0.90 |
| VGG | 0.91 | 0.93 | 0.91 |
| ResNet | 0.92 | 0.94 | 0.92 |
Among the models tested, ResNet50 showed the highest classification performance, greatly outperforming MobileNetV3 and NASNet, which had lower accuracy and higher misclassification rates. These results confirm that the optimized ResNet50 model is the most effective for classifying soybean leaves in complex field conditions.
DISCUSSION
Classifying varieties within the same species presents significant challenges due to their high morphological similarity in features such as leaf shape, color, and texture. Fine-grained image classification is complex because of high within-class variance and low inter-class differences (Yan et al., 2020). Although efforts have been made to classify intraspecies variations in agriculture, accurately distinguishing them continues to be a notable challenge (Hao et al, 2020). This study developed and fine-tuned an optimized ResNet50 model to improve the classification accuracy of soybean leaf varieties.
A key contribution of this study is the direct collection of field data, followed by data augmentation to enhance model generalization. Training a CNN model typically requires large-scale datasets and significant computational resources; however, by leveraging transfer learning, we effectively fine-tuned ResNet50 to enhance classification performance. The proposed model demonstrated higher accuracy than VGG16, Inception-V3, MobileNetV3, and NASNet, effectively distinguishing subtle intra-species variations in soybean leaves.
Despite the model’s strong performance, certain limitations remain. While the model achieved a high classification accuracy of 94.5%, the classification loss continues to be a concern, indicating potential for further improvement. The loss reflects the gap between predicted and actual values, and in fine-grained classification tasks, class ambiguity can impair accuracy. Increasing the volume and diversity of training data is a key strategy to reduce this error. Specifically, the observed imbalance and more significant morphological variation within the Daepung leaf dataset (illustrated clearly in Fig. 2) might have impacted the model’s accuracy. Future studies should aim for balanced data collection that thoroughly captures both inter and intra-cultivar morphological variation to ensure enhanced model performance and better generalizability. Additionally, conducting further sensitivity analyses on varying dataset compositions (e.g., 9:1 train-test splits) was difficult due to practical constraints such as the timing of the study and the limited number of available samples. This limitation should be addressed in future studies with more extensive and more diverse datasets.
Regarding the rationale behind the selection of soybean varieties Daepung and Pungsannamul, our goal was to initially demonstrate the effectiveness of our approach with morphologically distinguishable varieties before extending the method to subtler variations. Although farmers typically plant a single soybean variety per field rather than mixed varieties, our approach has practical implications beyond field-level scenarios. The developed CNN-based methodology could be beneficial for seed certification, varietal purity analysis, and breeding programs by facilitating rapid, non-destructive identification and verification of varieties.
To further enhance classification accuracy and address inter- class ambiguity, future research should consider the following:
a. Expanding the dataset by incorporating more soybean cultivars and diverse environmental conditions.
b. Exploring advanced augmentation techniques, such as generative adversarial networks (GANs), to synthetically enrich training data.
c. Implementing ensemble learning by combining various deep learning models to boost robustness.
d. Integrating hyperspectral or multispectral imaging to capture spectral signatures beyond the visible spectrum for better classification.
By addressing these factors, future studies can develop more robust and scalable CNN-based classification models, contributing to enhanced automated crop monitoring and precision agriculture techniques.
CONCLUSIONS
This study developed and optimized a ResNet50-based deep learning model for soybean leaf classification, addressing the challenges of fine-grained image recognition within the same species. The analysis of the confusion matrix demonstrated the model’s robustness, with 906 samples correctly classified out of 965, confirming its high predictive accuracy of 94.5%. By leveraging transfer learning and data augmentation, the model effectively distinguished subtle intra-species variations in soybean leaves despite their morphological similarities.
However, a classification loss of 17.64% remains a challenge, likely influenced by data imbalance and inter-class ambiguity. Future improvements should focus on expanding dataset diversity, applying advanced augmentation techniques, and ensuring balanced data representation to enhance model performance. Additionally, incorporating hyperspectral or multispectral imaging could provide more discriminative features for improved classification accuracy.
Further research should also explore ensemble learning strategies to enhance model robustness and adaptability. By addressing these aspects, future studies can contribute to the development of more accurate, scalable, and automated crop monitoring systems, supporting precision agriculture and sustainable soybean production.
