

INTRODUCTION
MATERIALS AND METHODS
Literature search and selection of relevant studies
Data analysis
RESULTS AND DISCUSSION
CONCLUSIONS
INTRODUCTION
Rice is a staple food for more than half the world’s population, and rice related industries are expanding. According to FAO (Food and Agriculture Organization) projections, global scale of rice-related industries is projected to increase to 1.7 percent (549.1 million ton) in 2025-2026 (FAO, 2025).
Nitrogen (N) is an essential nutrient required for the proper growth and development of rice during the growing season. Therefore, nitrogen fertilization is one of the most widely practiced agricultural inputs to enhance yield and quality of rice. Despite its benefits, excessive N application often results in lodging, poor grain quality, including increased protein content and reduced palatability (Kim et al., 2009; Song et al., 2006). Furthermore, it generates greenhouse gas (GHG) such as N2O, causes eutrophication through nitrate leaching into surrounding water bodies ecosystems (Henryson et al., 2020). Accordingly, it is necessary to determine the optimal N fertilization rate based on an understanding of nitrogen use efficiency (NUE). The effect of N fertilization in rice production have been evaluated not only in terms of yield but also NUE indices including agronomic nitrogen efficiency (AE). AE is defined as grain yield per unit of N applied, and is a key marker to assess how much the applied N contributes to grain yield. Therefore, a higher AE indicates more efficient use of nitrogen for grain production, whereas a lower AE suggests reduced efficiency or excessive N application.
Although numerous studies have examined nitrogen fertilization in rice, the outcomes are often inconsistent because experimental conditions, such as rice varieties, cultivation environments, and management practices, vary widely across studies. These methodological differences limit the ability to draw generalized conclusions, highlighting the need for a quantitative synthesis through meta-analysis. The meta-analysis provides comprehensive insights by synthesizing the results from studies with similar research objectives, and thus systematically interprets a complex set of characteristic factors that affect the variables in order to derive general results (Cheng et al., 2021). Chen et al. (2025) conducted a meta-analysis on fertilization and yield of rice in saline-alkali land. When controlled release urea (CRU) was applied, a comparison was made among three crops-wheat, maize, and rice, it was found that the NUE was higher than that of other crops, but the AE was low, so the efficiency of nitrogen absorption leading to an increase in quantity was lower than that of other crops. This illustrates that rice can absorb nitrogen efficiently, but its productivity response is comparatively weak (Zhu et al., 2020). Meta-analysis represented the results of each study as the numerical index of effect size and statistically combined these estimates across studies.
Despite the numerous applications of meta-analysis in studies on NUE, quantitative evaluations of AE remain limited. Therefore, in this study, we used a meta-analysis to systematically and quantitatively investigate the yield and AE responses by N fertilization rates, rice subspecies and predominant rice-producing countries.
MATERIALS AND METHODS
Meta-analysis is a widely used statistical approach that synthesizes a variety of studies and integrates the results, increasing sample size and thereby improving powerful analysis. We followed the Preferred Reporting Items for Systematic Reviews and Meta-Analyses (PRISMA) (Page et al., 2021) to conduct the systematic review and meta-analysis.
Literature search and selection of relevant studies
Data were compiled from the Web of Science database, including studies conducted in 11 Asian countries including South Korea from Jan., 2000 to August, 2024 using “Rice”, “Nitrogen application”, “AE”, and synonyms. From the raw data set, the duplication of results was firstly checked using EndNote software (version 21), the titles and abstracts were further filtered with the field tag, being served by the Web of Science searching function, the relevant studies were finally reviewed with full-text screening. In addition, the selection of articles was only confined with the results of field experiments, which showing AE and grain yield of rice in numerical.
Total 382 studies were identified from the data base, and the titles and abstracts of 227 studies were screened. Of those, 195 studies were excluded due to the out of the search criteria. From 32 case studies (Bo et al., 2016; Chen et al., 2022; Chen et al., 2015; Deng et al., 2022; Emran et al., 2019; Fei et al., 2023; Guang et al., 2018; Hou et al., 2021; Huang et al., 2008; Huang et al., 2016; Jian et al., 2014; Jiang et al., 2022; Le et al., 2023; Li et al., 2024; Luo et al., 2022; Mohanty et al., 2020; Rahman, 2013; Santiago-Arenas et al., 2021; Santiago-Arenas et al., 2022; Singh et al., 2009; Singh et al., 2023; Sun et al., 2020; Thind et al., 2012; Thind et al., 2010; Thind et al., 2018; Wang et al., 2022; Wei et al., 2018; Xue & Yang, 2008; Yu et al., 2023; Zhang et al., 2018; Zhao et al., 2009; Zhu et al., 2021), 8 studies were further excluded owing to the absence of the effect size, and 24 studies meeting the criteria were finally used to proceed a meta-analysis.
Data analysis
The meta-analysis was conducted using R (RStudio 4.3.2) and MetaWin 3.0 software (Rosenberg, 2024). Effect sizes were calculated as Hedges’ d (Hedges & Olkin, 2014) with corresponding 95% confidence intervals (CI). Hedges’ d was computed as follows (Eq. 1), including a small-sample bias correction factor J (Eq. 2). The variance of the effect size was estimated using Eq. (3):
A random-effects model was employed to account for biological and methodological variability across studies. Heterogeneity among studies was assessed using Cochran’s Q statistic and the I2 index. Initial effect-size calculations were performed in MetaWin 3.0, and additional analyses, including publication bias correction, were conducted in R. Publication bias was evaluated using funnel plots and Egger’s regression test. When funnel asymmetry suggested potential bias, the Trim-and-Fill method was applied to estimate the number of missing studies and obtain bias adjusted pooled effect sizes. A total of 32 studies were included in subgroup and moderator analyses (Fig. 1). Subgroup analyses were conducted for (i) N fertilization levels and (ii) rice subspecies. Although nitrogen rate was originally a continuous variable, it was categorized into eight classes at 50 kg ha-1 intervals to facilitate subgroup comparison and visualization. Rice subspecies were classified as indica, japonica, or hybrid. Variations in AE and grain yield among N levels and subspecies were evaluated using one-way ANOVA, followed by Tukey’s HSD test for multiple comparisons.

To estimate the optimal N application rate and N level with the greatest marginal efficiency for grain yield and AE, the second-order polynomial regression were fitted using the following quadratic equation:
Where ‘a, b, c’ are regression coefficients. The optimal N application rate(N*) was calculated using the vertex of the quadratic curve as:
For marginal-efficiency analysis, N levels were arranged in ascending order, and incremental responses (ΔAE/ΔN and ΔG/ΔN) were calculated. The N level corresponding to the highest incremental gain was identified as the point with the maxi-mum marginal efficiency (ΔY/ΔN). All analyses were conducted after removing missing observations using ‘na.omit()’ function to ensure complete-case analysis.
RESULTS AND DISCUSSION
We conducted a meta-analysis of 24 studies to quantify the effects of nitrogen application on AE and grain yield. By integrating multiple independent studies, the meta-analysis offers a more consistent quantitative estimate of nitrogen application effects and helps resolve inconsistencies among previous field experiments.
The overall mean effect sizes were 3.76 for AE (95% CI: 2.98 - 4.54) (Fig. S1-A), and 3.06 for grain yield (95% CI: 2.41 - 3.70) under a random-effects model (Fig. S1-B). Despite the variability among studies, the overall effect sizes indicated strong and significant positive responses in both AE and grain yield. These findings align with Cassman et al. (2003), which also reported substantial yield benefits from nitrogen fertilization. Heterogeneity was also observed in both AE and grain yield, and the Q statistic for AE was 93.13 (p < 0.0001) with an I2 of 75.3%, and, for grain yield, was 79.85 (p < 0.0001) with an I2 of 71.2%, indicating considerable variability among studies. Funnel plots showed noticeable asymmetry (Fig. S1-C and 1-D), and the Egger’s regression test confirmed significant publication bias for both AE (t = 4.53, p = 0.0002) and grain yield (t = 4.11, p = 0.0005). Using the trim-and-fill method, three imputed studies were added for AE, reducing the adjusted effect size for AE (Fig. 2C), reducing the adjusted effect size from 3.76 to 3.42 (95% CI: 2.48 - 4.36) (Fig. 2A). For grain yield, seven imputed studies (Fig. 2D) reduced the pooled effect size from 3.06 to 2.33 (95% CI: 1.44 - 3.22) (Fig. 2B).
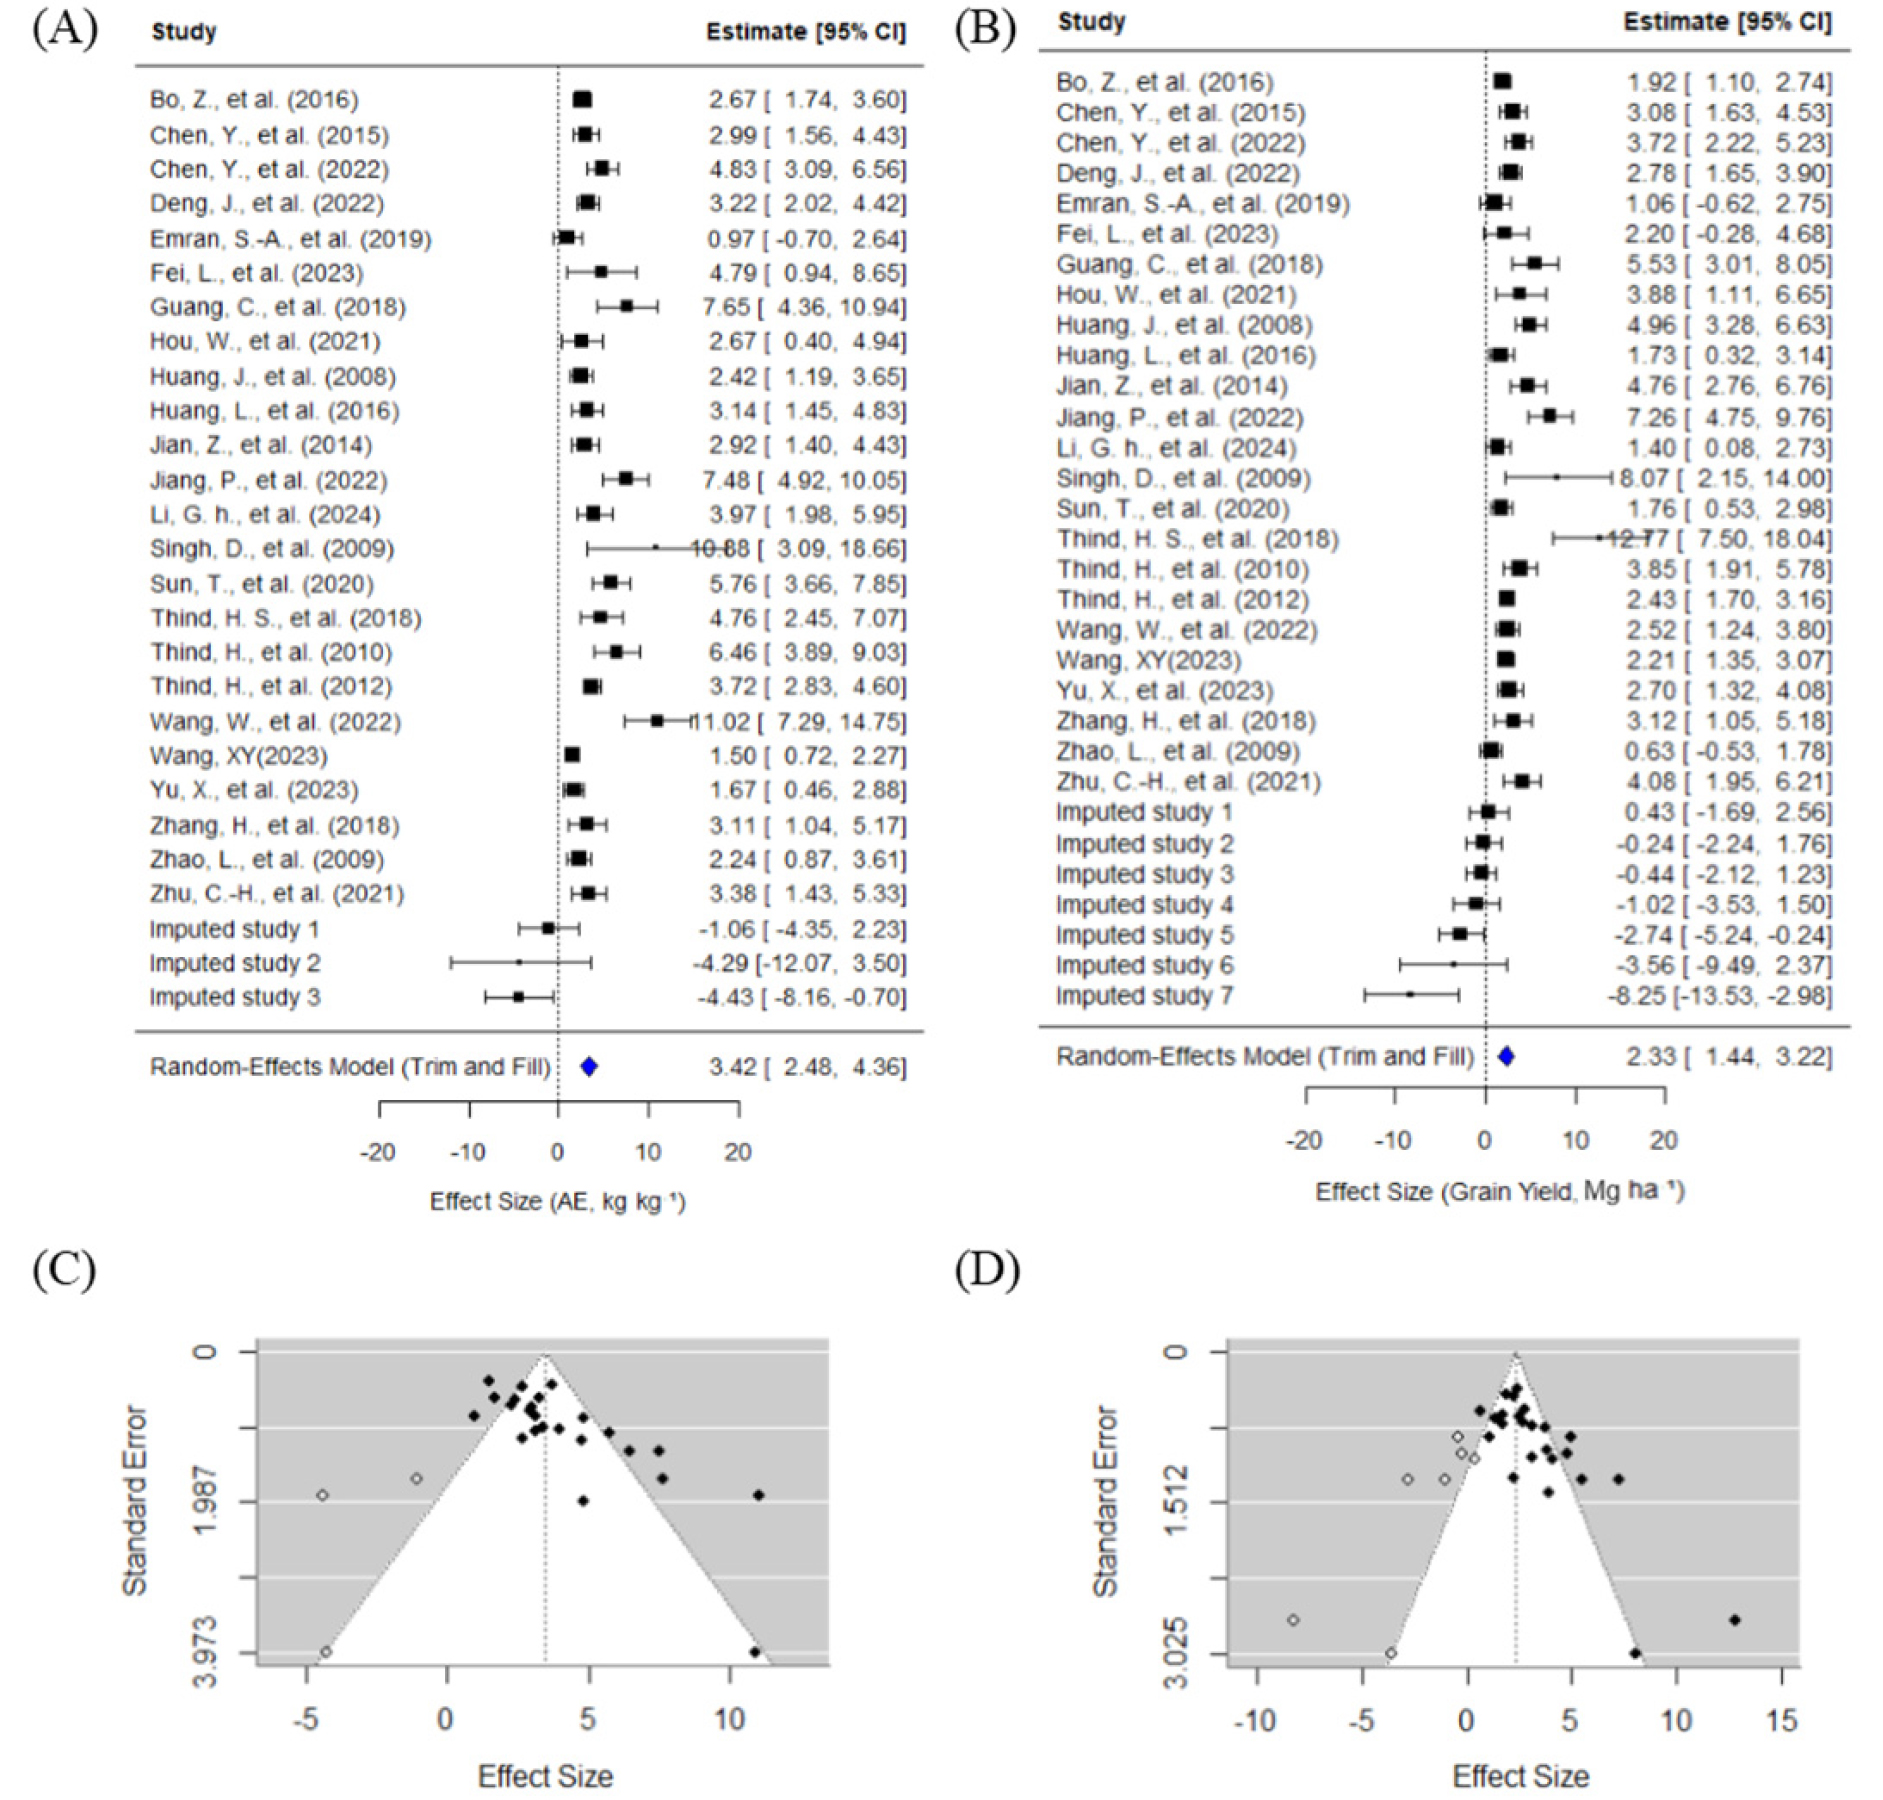
Fig. 2.
Forest plots and funnel plots for agronomic efficiency (AE, kg kg-1) (A, C) and grain yield (Mg ha-1) (B, D) using random-effects model with trim-and-fill adjustment. Black and gray squares represent observed and imputed studies, respectively; and horizontal line indicates 95% confidence interval. Diamonds indicate overall effect size. Funnel plots (C and D) illustrate potential publication bias.
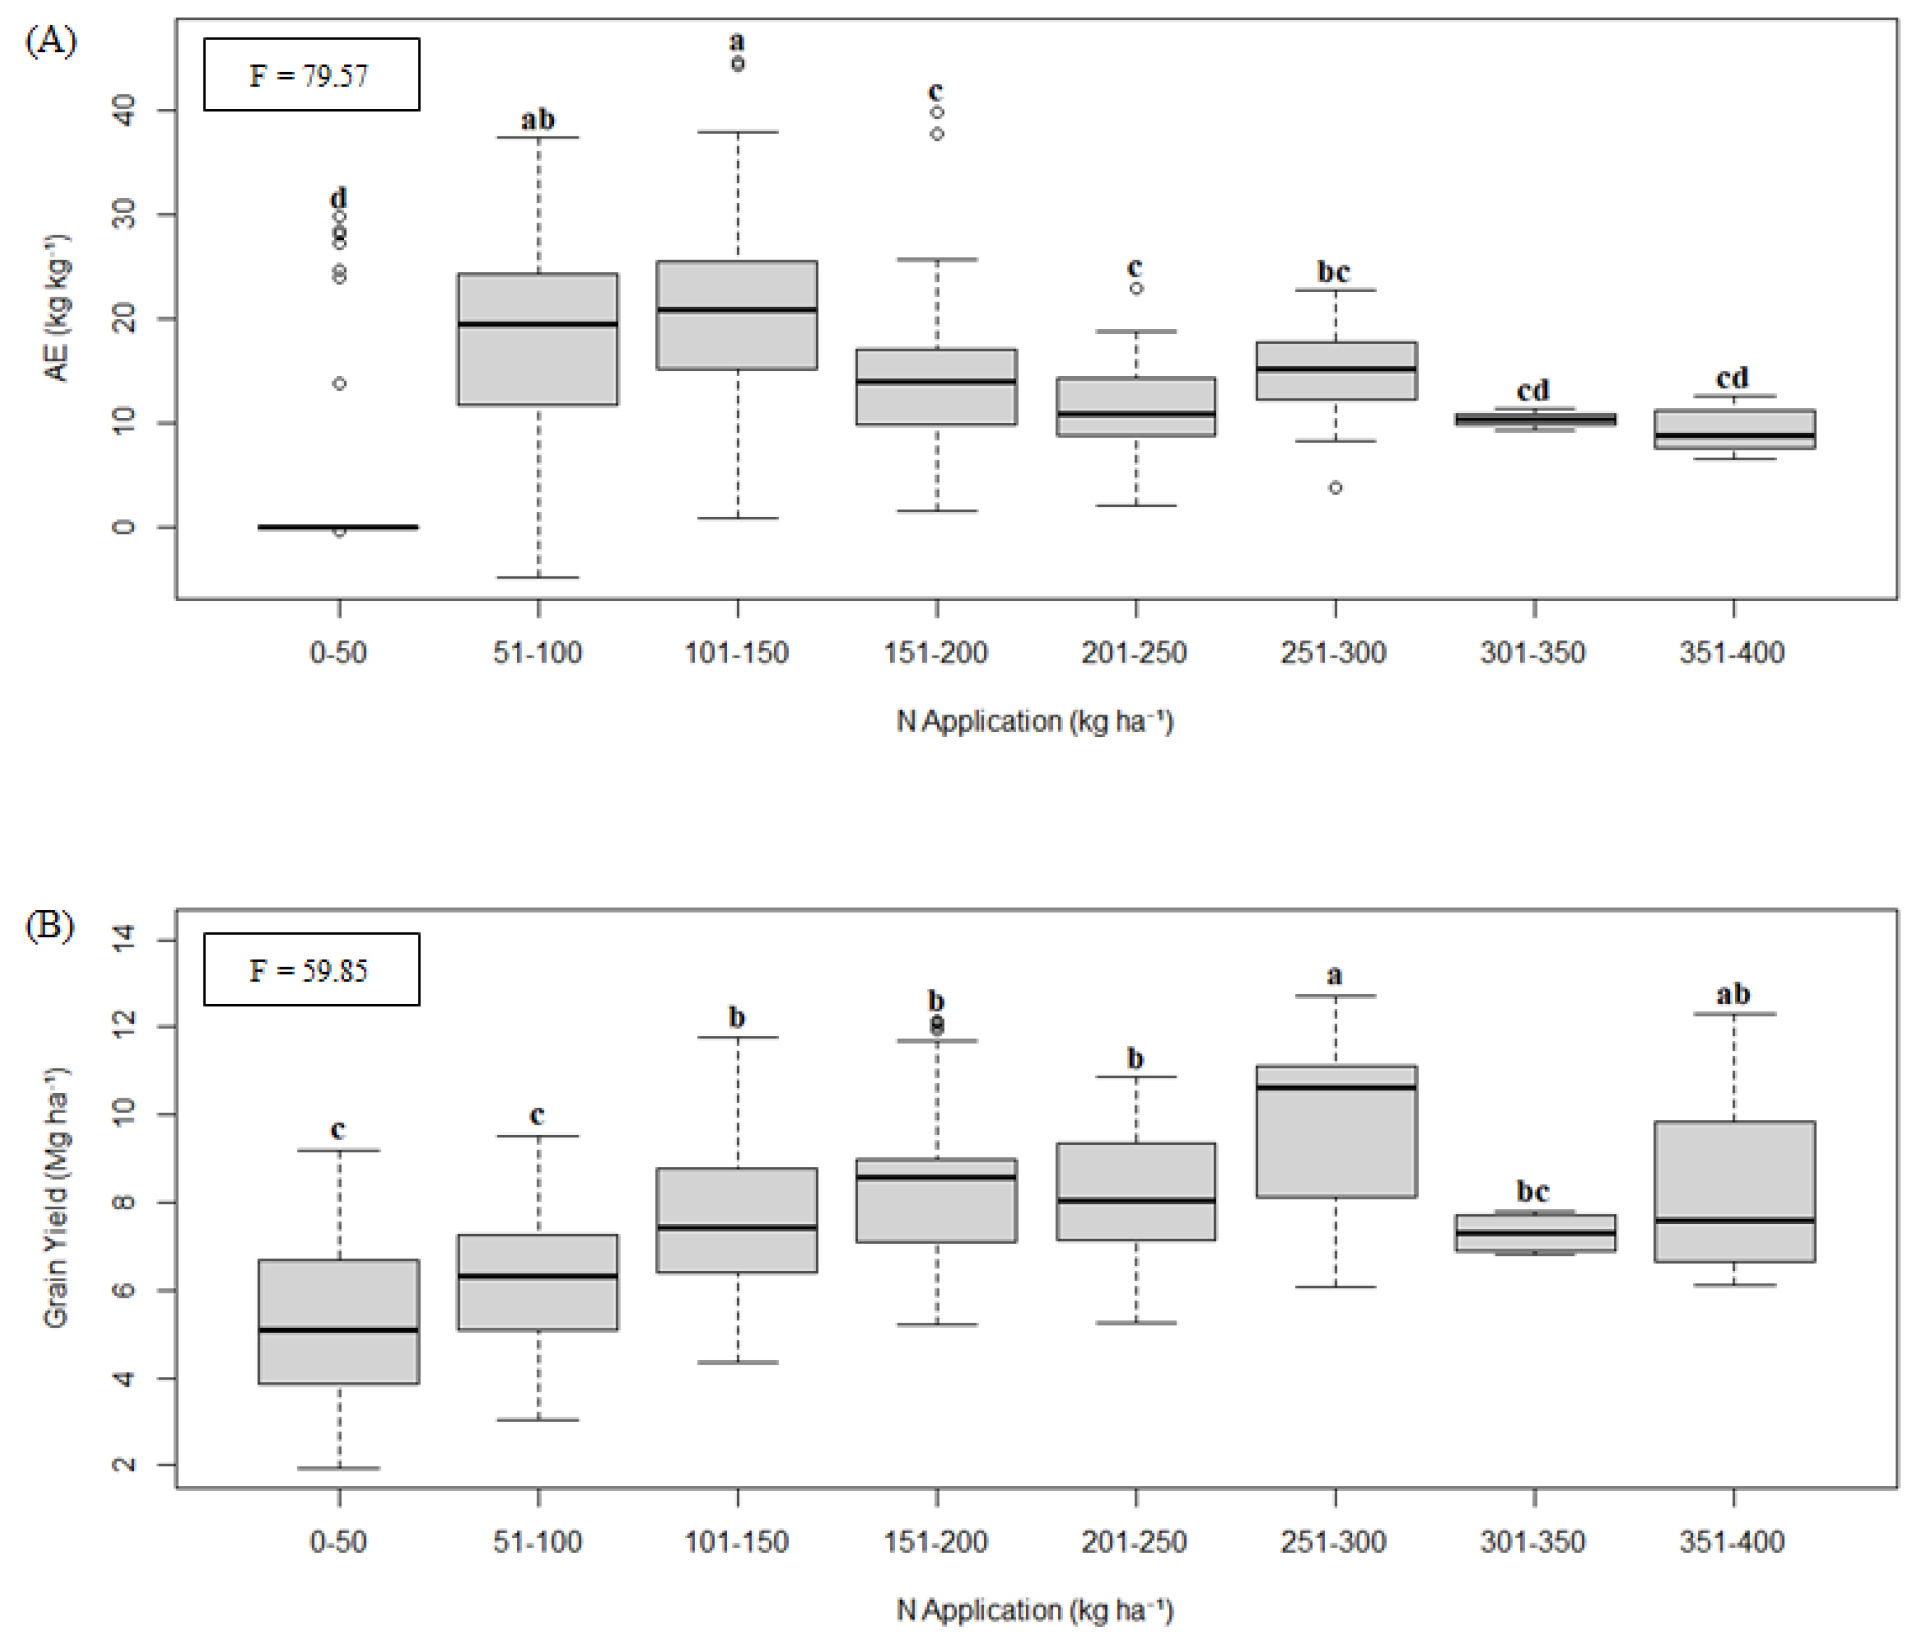
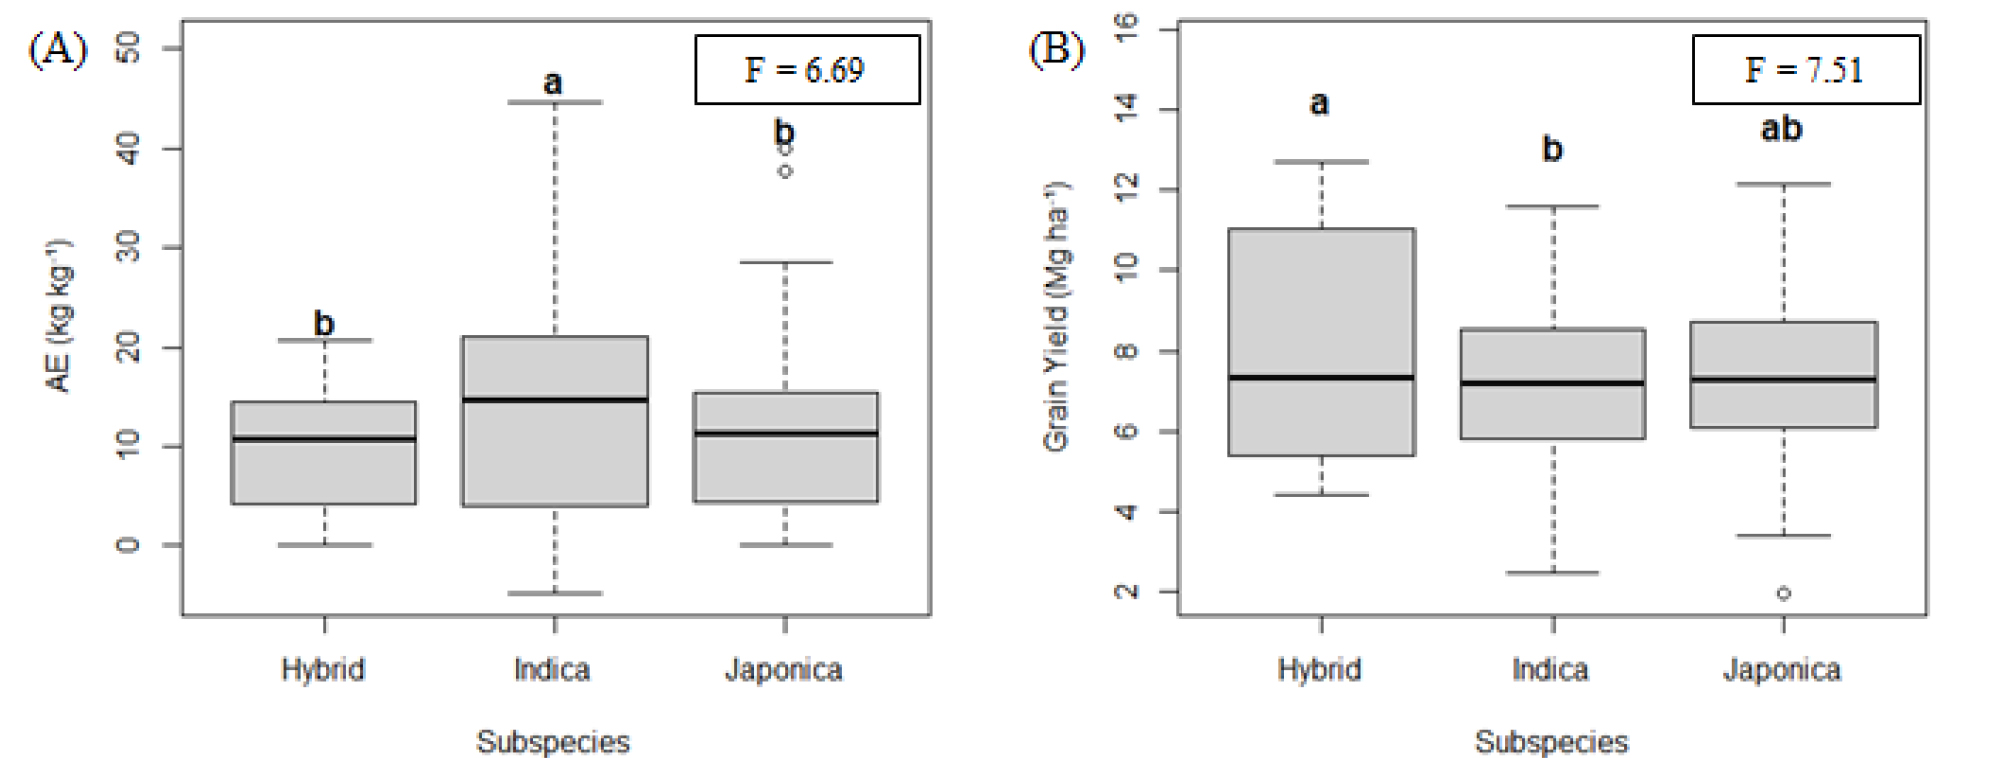
Both AE and grain yield tended to be greater with an increasing nitrogen application rate up to their peaks. AE was significant higher in the 101 - 150 kg ha-1 group (Fig. 3A), while grain yield showed the maximum at the 251 - 300 kg ha-1 group (Fig. 3B). Among the three subspecies, indica showed significantly higher AE than japonica and hybrid rice (p<0.05) (Fig. 4A), while Hybrid showed greater grain yield than Indica (p<0.05) (Fig. 4B). These trends are consistent with previous field studies reporting diminishing marginal yield responses under high nitrogen rates (Luo et al., 2022; Sun et al., 2020). The marginal increase in grain yield per unit of N became small at higher N levels (Xu et al., 2025), whereas excessive N application stimulated vegetative biomass accumulation (Huang et al., 2008). Therefore, nitrogen management decisions in rice production systems should incorporate NUE metrics such as AE.
CONCLUSIONS
The meta-analysis demonstrates that N fertilization significantly increases rice AE as well as grain yield in rice production system in east Asian countries. AE was maximized at moderate N rates (100 - 151 kg ha-1), whereas grain yield peaked at greater N inputs (251 - 300 kg ha-1), revealing a clear contrasting relationship between NUE and yield maximization. This result provides an importance on what is main concern between greater AE or yield in rice production.
