

Rice is one of the main cereal crops with wheat and corn in the world. For effective rice cultivation, enough nutrient condition is needed. However, level of plant-available phosphate (P) is very low in soils. Most of soils in the world are reported as P deficient condition, even available P content seldom exceeds 10 μm (Bieleski, 1973). Therefore, it is one of the main factors in reduction of rice production throughout the world. P deficient can be overcome by treating chemical fertilizer. When P fertilizer treated, plant could absorb just 20% of treated P fertilizer and about 80% of those is combined with other inorganic compounds then changed as unavailable P which plant cannot uptake. Around 90% of chemical P fertilizer was made using phosphate rocks (Brunner, 2010). The remaining amount of phosphate rock is expected to be extinguished within 50~100 years if used as these days (Steen, 1998; De Haes et al., 2009; Smit et al., 2009; Vaccari, 2009; Cordell, 2010.). Therefore, many scientists have been investigated to develop more P deficient tolerance rice (Kaeppler et al., 2000; Wissuwa et al., 2005; Beebe et al., 2006; Heuer et al., 2009). In P deficient condition, growth performances are changed. The leaf expansion, leaf surface area and leaf number are significantly reduced in P deficient condition. The process of carbohydrate utilization become slow so dark green leaf is easily discovered for buildup of carbohydrates in leaf. The shoot growth is also reduced in such a condition.
Hung et al. (1985) and Wissuwa et al. (1998) reported tillering ability and dry weight could be the best marker to monitor phosphate-deficient tolerance in experiment of using indica type rice. To develop more P deficient tolerance rice, selecting of elite line by screening with large population or genetic resources is essential. Even though dry weight and tiller number could be a marker for selecting P deficient tolerance rice, it is time and labor consumed work in rice breeding. Therefore, when screening P deficient tolerance rice using the huge of genetic resources, it could be more effective that selecting elite line by more elaborate and accurate screening method after reducing target genetic resources by rough screening method. In this study, we firstly investigated the change of agronomic characters in rice under P deficient condition to confirm the best marker in selecting P deficient tolerance japonica rice. Then we tried to develop more simple and effective method to rough screening of P deficient tolerance rice.
MATERIALS AND METHODS
The analysis of nutrient content in soil
The soil was collected before rice cultivation. Three samples of soil in each plot were collected and dried at 60~70°C for 3 days. Dried soil samples were crushed well and sieved using 2 mm sieve. 5 g of soil sample were measured and put in grass flask. 20 ml of extraction solution was added in each grass flask then shook for ten min at 200 rpm. Extraction solution was contained 0.33 M CH3CHOOH, 0.15 M lactic acid, 0.03 M NH4F and 0.05 M (NH4)2SO4. After shook ten min, extracted solution was filtered then available phosphorus was measured by Lancaster methods (NIAST, 2002), nitrogen and carbon content were measured by Kjeldahl method (Varley, 1966) and inorganic component were measured by inductively coupled plasma spectrometry.
Investigation of finding the best marker in selection P deficient tolerance rice
The Hwayeongbyeo is used as material and cultivated in paddy field which have be maintained various fertilizer conditions over twenty years. Fertilizer condition have been created like as– control (NPK), nitrogen deficient (-N), phosphate deficient (-P), potassium deficient (-K) and all fertilizer deficient (-NPK) treatment. The amount of fertilizer was treated as following the standard rice cultivation method of rice (RDA, 2001). The thirty days old plants were transplanted as three plants per hill at 20 th of May in 2013~2014. Agronomic traits were investigated 40 days after heading stage. Culm length, panicle length and tiller number of 10 plants were investigated in each plot. For analyzing the yield traits, 100 plants of each plot were cultivated. After dried and adjusted the water content of seed as 14%, seed weight of 100 plants were measured.
Plant materials and cultivation of rice in bed tray for rough screening
The 480 kinds of rice genetic resources were used as materials (Supplementary Table 1). Rice genetic resources was sowed after soaking 3 days in 30°C water after disinfection. The rice bed tray was divided into twenty spaces and filled with P deficient soils. Ten rice seed of each genetic resource was sowed in a space, covered with P deficient soils then incubated in green house for three days. Rice bed trays were put on tray with water (Fig. 1). After four week cultivation in green house, ten rice plant in each genetic resources was cleaned and dried for three days in 70°C dry oven. The dry weight of plant in each rice genetic resources was measured then fifty rice genetic resource were selected for further research.
Table 1.
Nutrient content in soil of paddy field and P deficient soil before rice cultivation.
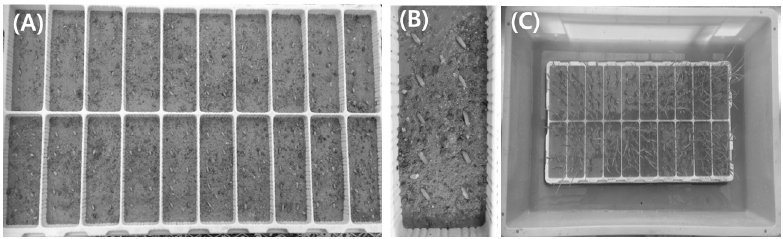
Fig. 1.
Sowing of rice genetic resources in bed tray (A)~(B) and growth of rice genetic resources in bed tray (C).Fifty of selected genetic resources were cultivated in paddy field with three fertilizer conditions. 9 kg of nitrogen, 4.5 kg of phosphate and 5.7 kg of potassium per were treated 10 are for control condition. For P deficient condition (no P), the 0 kg of P fertilizer were treated in field which filled with P deficient soil. For low P (low P) condition, the 4.5 kg of P fertilizer treated in field which filled with conventional cultivated soil. Nitrogen and potassium were treated like as control condition in both P deficient and low P condition. Agronomic characters like as tiller number, plant height and dry weight were investigated forty days after flowering date.
RESULTS
The nutrient contents of soil before rice cultivation
In analyzing the soil nutrient content in paddy field with various fertilizer conditions, all nutrient content were not significantly different except P2O5 (Table 1). P2O5 content in soil was 266 mg per 1 kg of soil in control condition. In –K condition, P2O5 content in soil was not significantly different compare to that in control condition. In –N condition, P2O5 content in soil was increased as 362 mg per 1 kg of soil. However P2O5 content in –P and –NPK soil were significantly decreased as 12 and 45 mg per 1 kg of soil, respectively.
The nutrient content of P deficient soil for rice bed tray experiment was also measured. The P2O5 was in P deficient soil was 4.7 ppm per kg. Other nutrient content like as K, Ca and Mg did not show significant difference compare to conventional cultivated soil.
P effect on rice growth
In ripening stage, culm length was 64 cm in control condition. That was about 62.3~63.5 cm in –N, -P and –K condition. Culm length was 55 cm in –NPK condition. Panicle length was 18 cm in control condition. In –P condition, panicle length was 20.4 cm. In –N, -K and –NPK condition, panicle length was about 18.4~ 19.8 cm. Tiller number was 11.5 in control condition. It was significantly decreased in –N, -P and –NPK condition as 8.8, 7.2 and 6.0 respectively. However, it was not different in –K condition a 11.1 (Table 2).
Table 2.
The growth characters of Hwayeongbyeo according to fertilizer condition.
Among agronomic characters, thousand grains weight did not show significant difference according to fertilizer treatment. Number of grain per spikelet was 85.1 in control condition. It was slightly decreased in –K condition as 81.6 but did not showed significant difference. In –N and –P condition, it was similar as 74.1 and 71.4 respectively. In –NPK condition, it was dramatically decreased as 65.3. Ripening rate was 83.9% in control condition. In –P and –K condition, it was similar with control condition as 83.1% and 84.4%. In –N condition, ripening rate was 72.3% and it was 77% in –NPK condition. Yield of milled rice showed the largest difference according to different fertilizer condition. In control condition, it was 456.1 kg per 10 are. In –K condition, it was slightly decreased as 445.4 but did not showed significant difference. In –N condition, yield of milled rice was 355 kg per 10 are and it was 214 and 257 kg per 10 are in –NPK and –P condition, respectively (Table 3).
Table 3.
The yield traits of Hwayeongbyeo according to different fertilizer treatments
Rough screening and cultivation in paddy field using selected materials
After cultivation in rice tray filled with P deficient soil for four weeks, plant dry weights of 480 genetic resources were measured. It was from 0.01 to 0.341 g. To further study, we selected fifty genetic resources among 480 genetic resources (Fig. 2).

Fig. 2.
Plant dry weight of (A) all rice genetic resources and (B) selected rice genetic resources cultivated under bed tray contained P deficient soil.In field experiment with different P condition, several agronomic characters were measured. Plant dry weight was showed significant difference according to P condition in soils. It was 17.2 g in no P condition. It was increased as 27.37 g and 34.24 g in low P and control condition, respectively. Plant height was 66.4 cm in no P condition. It also increased as 80.3 cm in low P condition. However it did not show significant difference in control condition as 81.6 cm compare to low P condition. Culm length was 22.1 cm in no P condition. It did not show significant difference in low P and control condition compare to no P condition as 23.5 cm and 23.7 cm, respectively. Tiller number was 5.4 in no P condition. It was increased as 8.7 and 10.7 in low P and control condition, respectively.
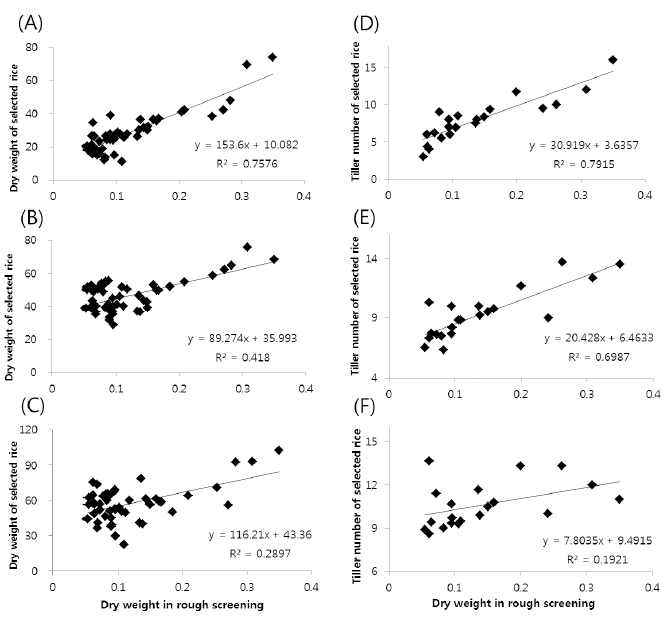
The correlation of plant dry weight per plant with tiller number in ripening stage was investigated. It was showed high degree correlation as 0.7638 in no P condition. Even though it was slightly decreased in low P condition, it was still high as 0.6274 (Fig 4). Plant dry weight in rough screening and those in paddy field was showed high degree correlation especially in no P condition as 0.7576. The correlation between those was decreased as 0.418 and 0.298 in low and control P condition, respectively (Fig. 5 (A)~(C)). Tiller number in ripening stage which cultivated in no P condition was showed significant correlation with dry weight in rough screening as 0.7915. It was decreased as 0.6987 in low P condition, and it was further decreased as 0.1921 in control P condition (Fig. 5 (D)~(F)).
DISCUSSION
In analyzing of phosphate fertilizer effect on rice growth characters, several characters were changed (Table 2, Table 3). Among yield traits, grain number per spikelet, ripening rate and tiller number were changed. As the change of yield traits, actual yield of milled rice was also changed. Khalid reported yield of rice was increased by treating phosphate fertilizer initially up to certain level due to increase of panicle number (Khalid, 2013). Aziz et al. (2006) also reported the phosphorus deficiency could reduce the crop yield by 10~15%. Yield of milled rice was significantly decreased in all condition except potassium deficient condition. In potassium deficient condition, even though grain number of spikelet was decreased about 10%, yield of milled rice did not show significant difference with control condition. However yield of milled rice was greatly influenced by nitrogen and phosphate condition. The 26% of tiller number, 20% of grain number and 14% of ripening rate were decreased by nitrogen deficiency. In phosphate deficient condition, the 32% of tiller number and 17% of grain number were decreased. Yield of milled rice was decreased about 32% by nitrogen deficiency, 54% by phosphate deficiency. These results might indicate decrease of tiller number is the main factor in decrease of yield in rice under phosphate deficient condition. Through this result, we would confirm phosphate is needed to get reliable tiller number and yield in rice. Thus tiller number could be the best marker in selection of phosphate deficient tolerance rice not only in indica type but also japonica type.
In analyzing nutrient content of soil, P content in P deficient soil which is used in rough screening was similar with P deficient paddy field. With these results, we could confirm the growth of rice in paddy field which contained low P could be replaced by cultivation of rice in P deficient soil because the nutrient condition of P deficient soil was similar as P deficient paddy field.
After measuring plant dry weight of rice genetic resources which cultivated in rice bed tray contained P deficient soil, we select fifty rice genetic resources then cultivated those in paddy field with three kinds of P condition (Fig. 2). Plant dry weight and tiller number per plant in ripening stage were shown significant difference under different P condition. Those were the lowest in no P condition, increased in low P condition and further increased in control condition. Plant height was also increased in low P condition compare to no P condition. However it did not showed difference in control condition compare to low P condition. Culm length did not show any difference under difference P condition (Fig. 3). Though these results, we could consider plant dry weight and tiller number could be increased by treated P nutrient. So we investigated the correlation of plant dry weight with tiller number under different P condition. It was 0.7638, 0.6274 and 0.5077 in no P, low P and control condition, respectively (Fig. 4). Even it was slightly decreased according to add P fertilizer, plant dry weight was still showed high degree correlation with tiller number in P deficient condition. Though these results, we confirmed that plant dry weight could be measured instead of tiller number under P deficient condition. Finally we checked the correlation of plant dry weight in rough screening with plant dry weight and tiller number in ripening stage in paddy. Plant dry weigh in rough screening was showed high degree correlation as 0.7576 with those in paddy field especially under no P condition (Fig. 5). We could expect that P deficient tolerance rice which was show high dry weight under P deficient condition could also get high dry weight under rice bed tray filled with P deficient soil. And P sensitive rice could not grow well not only in P deficient paddy field but also in rice bed tray filled with P deficient soil. In analyzing the correlation of plant dry weight in rough screening with tiller number in ripening stage, it showed high degree correlation as 0.7915 and 0.6987 under P deficient condition (Fig. 5). We could consider plant dry weight in rough screening was highly related with tiller number in ripening stage cultivated in P deficient condition. Although tiller number of rice under P deficient condition could not be expected clearly by measuring plant dry weight though rough screening, we could select P deficient tolerance rice which could get more tillers under P deficient condition by measuring plant dry weight after cultivated in P deficient soil. We expect that this rough screening method of P deficiency tolerance rice could help saving labor and time in rice breeding.

Fig. 3.
Change of plant dry weight (A), plant height (B), culm length (C) and tiller number per plant (D) according to P condition.
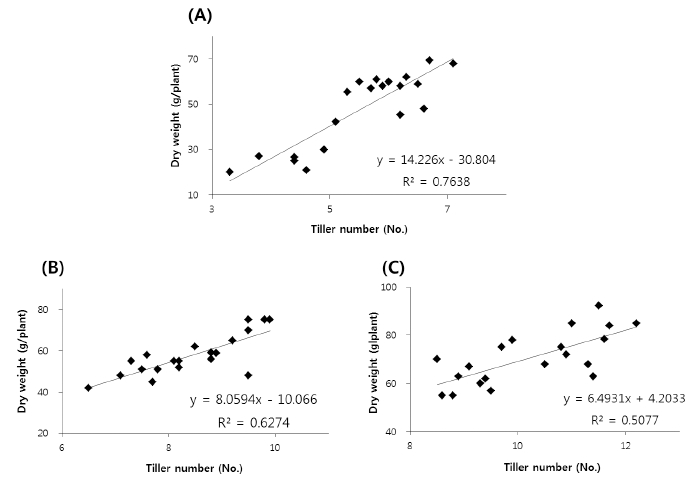
Fig. 4.
Correlation of dry weight with tiller number in ripening stage under (A) in no P, (B) in low P, (C) in control condition.