


Corn (Zea mays L.) is the number one cereal crop worldwide with 885.3 million tonnes produced in 2011 according to the FAO. In monsoon climate, persistent shade has become a troublesome weather event doing an impact on grain yield, particularly when accompanied by increasing plant density (Yuan et al., 2012).
Light impacts both photosynthetic activity and morphology of individual leaves and of plant canopies. The total amount of radiation received is a significant factor on plant growth. The response of corn plants to shade are variable depending on growth stages. Shade at flowering stages was more detrimental to grain production per plant than shade for longer periods during vegetative and maturation stages (Cui et al., 2012; Early et al., 1966; Mbewe and Hunter, 1986; Reed et al., 1988). The growth of vegetative organs such as stem and leaves was little or a little affected by shade from tasseling to maturity, showing little or a little change in plant height, stem width, whole plant biomass, and leaf area index (Mbewe and Hunter, 1986; Cui et al., 2012). Kernel number was reduced by shading treatments around silk emergence and its susceptibility to shade was maximal during the period of about 30 days around silking (Cerrudo et al., 2013). Reduction in grain yield resulting from shade during the vegetative, the reproductive, and the kernel filling stage reflected primarily a decrease in kernel number, since grain size changed very little with shade during the vegetative and the kernel filling stage, and actually increased with the shade during the reproductive stage (Cui et al., 2012; Mbewe and Hunter, 1986; Reed et al., 1988).
Relative growth rate (RGR) is a prominent indicator of plant strategy with respect to productivity as related to environmental stress and disturbance regimes. The RGR is the increase in size relative to the size of the plant present at the start of a given time interval. Expressed in this way, growth rates can be compared among species and individuals that differ widely in size (Medek et al., 2007; Pooter, 2013). The RGR is the product of leaf area ratio (LAR) and net assimilation rate (NAR). The LAR is the rate of leaf area to total dry matter and a measure of photosynthetic area relative to respiratory dry matter. The variation in the LAR is commonly the result of variation in specific leaf area (SLA), which is a measure of thickness of leaves relative to leaf area. The NAR is the rate of dry matter increase per unit leaf area, indicating the efficiency of leaves in generating biomass (Atkin et al., 1996; Medek et al., 2007; Poorter and Remkes, 1990; Atwell et al., 1999).
Dry matter partitioning is the end result of the flow of assimilates from source organs via a transport path to the sink organs. The activities of this process are not static and may change during plant development. A source and a sink are a net exporter of carbon assimilates, mainly produced by leaves, and a net importer of carbon assimilates from the source, respectively (Marcelis, 1996; White et al., 2016). During the kernel filling stages, leaves are principal source organs, and ear and kernel are sink organs (Seebauer et al., 2010; Tollenaar, 1997). Plant growth is limited by source- and/or sink-limited conditions, which usually refers to the term ‘source strength’ and ‘sink strength’, respectively (Uhart and Andrade, 1991; Seebauer et al., 2010; White et al., 2016). The strength of the source and the sink decomposes into size and activity, respectively (Marcelis, 1996; White et al., 2016).
Korea is of temperate monsoon climate with a wet monsoon from June to August. In Suwon, a city located in the central region of Korea, the longest consecutive poor sunshine days less than 1 hour per day was 7, 6, 11, 2, and 2 days in 2011, 2012, 2013, 2014, and 2015, respectively, which happened in July. Particularly, the 6 or longer consecutive poor sunshine days occurred in June, July, and August 2011, respectively (http://www.kma.go.kr). It may give rise to shade stress on summer crops.
Up to date, the effect of shade stress on corn plants has been studied only for the whole period of a developmental stage. There is few literature on the quantitative analysis of impact of shade stress on corn grain yield and its components during a corn developmental stage.
The objectives of this study were to find how the consecutive days of shade (hereafter, CS) at the beginning of kernel filling stages does an impact on corn grain yield and to elucidate its affect on the strength of source and sink.
Materials and methods
Plant material and growth conditions
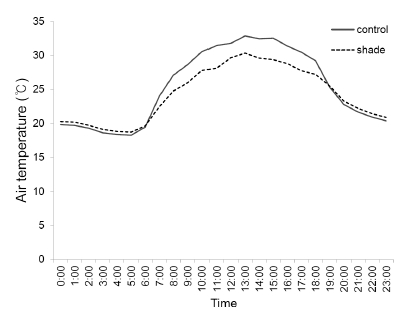
Corn hybrids of Gwangpyeongok (hereafter, GWPOK) and P3394, a popular Korean normal corn F1 hybrid were planted at the experimental field of National Institute of Crop Science in Suwon (37.2N, 126.9E) on 1 May 2015. Plants were grown at a density of 66,666 plants per ha with 60 cm row spacing. The plots were shaded using a black shade net at 10 days after silk emergence when kernels begin to fill on the cob (Tollenaar, 1977). The shade was removed every 7 days that days of CS was 7, 14, 21, and 28 ones. Control plots were not shaded. Shades intercepted 65.7% incident light. Air temperature was measured every hour in the control and the shade plot using a thermistor sensor (TR-71U, T&D Corp., Japan). Daily mean air temperature in the shade was lower by about 1.05°C than that in the control. Interestingly, air temperature during the day (7 a.m. to 6 p.m.) was much lower by about 2.55°C in the shade than in the control but that during the night (7 p.m. to 6 a.m.) was rather higher by about 0.43°C in the shade than in the control (Fig. 1). A poor sunshine day less than 1 hour happened three times intermittently during the 28 days of shade (data not shown), which was neglected. Every shading plots were paired with the control neighboring each other. A plot consisted of four rows of each corn hybrid. Fertilizers were applied at 72.5-30-60 kg ha-1 of N-P2O5-K2O as a basal fertilizer, respectively and was 72.5kg ha-1 of nitrogen was additionally applied at V6.
Plant growth measurement at removal of shade
For the uppermost ear leaf, the ratio of leaf length to width and the SPAD value were measured using a chlorophyll meter (SPAD-502 Plus, Konica Minolta, Inc., Japan) at every 7 day removal of shade. Stem length and width, number of leaves were also measured at every 7 day removal of shade. Four plants were sampled from the shade and the control at every 7 day removal of shade, respectively. Aerial parts of the plants were separated into organs such as stem including leaf sheath, leaves, ear, and tassel and oven-dried at 60°C for 4 days. The dry matter of each organ was weighed for every plant. Leaf area was measured with a leaf area meter (LI-3100C, Li-Cor, Inc., Nebraska, USA).
The ratio of ear dry matter to biomass and the ratio of ear dry matter to leaf area were calculated for determining dry matter partitioning between source and sink organs. The relative growth rate (hereafter, RGR), the net assimilation rate (hereafter, NAR), the specific leaf area (hereafter, SLA), and leaf area ratio (LAR) were calculated for plant growth analysis as described by Atwell et al. (1999).
where, W1 and W2 are total plant dry matter at t1 and t2 of given time, respectively. A1 and A2 are leaf area at t1 and t2 of given time, respectively. A, Wbiomass and Wleaf are leaf area, total plant dry matter, and leaf dry matter at given time, respectively.
Grain yield components measurement at maturity
Nine or ten of the uppermost ears at maturity were harvested and husked at each plot. The rows per ear and kernels per row were counted to determine the maximum number of kernels per ear. Tip-fill length was measured. All these measurements were performed before oven-dry. Grains were harvested from each oven-dried ear by hand. The filled kernels were counted and weighed for every plant. The 100-grain weight was calculated. The percentage of the filled kernels was calculated by dividing the number of the filled kernels by the maximum kernel number (rows per ear × kernels per row).
Plant yield and harvest index determination
Nine or ten corn plants were sampled at each plot at maturity. Plant yield for biomass (total aerial parts), ear, and grain was determined on the basis of dry weight, respectively. Harvest index on the basis of grains was calculated by dividing plant grain yield by plant biomass yield.
Statistical analysis
All data were expressed mean ± standard error calculated using SAS statistical software package (ver. 9.2, SAS Institute, USA). The ANOVA procedure was used to compare the differences among treatments. If F-test for interaction effect between hybrid and shading treatment was not significant (p>0.05), data were pooled over corn hybrids. Otherwise, data from each corn hybrid were presented separately. Means among treatments were compared by Duncan’s Multiple Range Test (α=0.05). Analysis of simple regression and simple correlation was performed. Grain yield components and plant yield were fitted using Sigma Plot (ver. 10.0, Systat Software, Inc., USA).
The probit analysis calculates maximum likelihood estimates of regression parameters and the natural response rate for quantal response data from biological assays (Bliss, 1934; SAS Institute Inc. 2008). Probit analysis was performed to estimate the effect of the consecutive days of shade on plant yield.
All statistical analyses were done using SAS statistical software package (ver. 9.2, SAS Institute, NC, USA).
Results
Effect of shading treatment on the growth of stem and leaf
Shading treatment at 10 days after tassel emergence, the beginning of kernel filling stages, was imposed for 7, 14, 21, and 28 days, respectively. When each shading treatment was removed, stem length and width, the ratio of length to width and SPAD value of the uppermost ear leaf, and the number of leaves and total leaf area per plant were measured, respectively (Fig. 2 and 3).
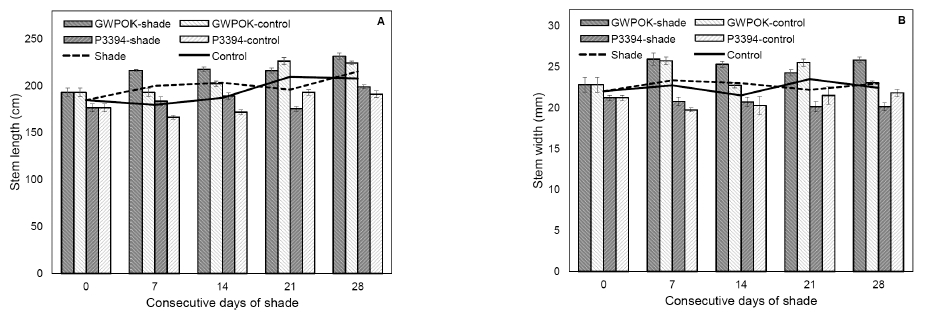
Fig. 2
Stem length (A) and width (B) in the control (0) and in plants receiving 7, 14, 21, and 28 days of consecutive shade. Error bar is standard error (n = 5 or 6).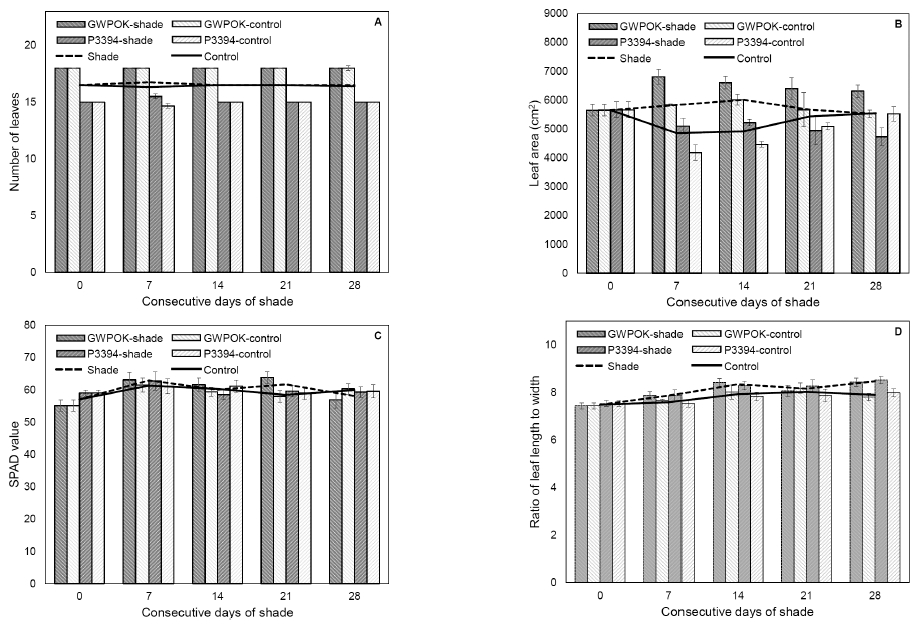
Fig. 3
Number of leaves (A), leaf area (B), and SPAD value and ratio of length to width of the uppermost leaf in the control (0) and in plants receiving 7, 14, 21, and 28 days of consecutive shade. Error bar is standard error (n = 5 or 6).For both corn hybrids, their stem length and width were not significantly changed by shade, even for consecutive 28 days of shade, compared to the control plants (Fig. 2). Like stem, shading treatment had no impact on the number of leaves and leaf area with variations (Fig. 3A and 3B). The SPAD value of the ear leaf was not also affected by shading treatment (Fig. 3C). Ratio of length to width of the ear leaf was not significantly different among all the shading treatments and the control (Fig. 3D). These results indicate that shading treatment at the beginning of kernel filling stages give rise to little impact on the growth of stem and leaves, the vegetative organs.
Effect of shading treatment on the dry matter accumulation
Dry weight of stem, leaves, ear, and the aboveground parts (hereafter, biomass) were measured when each shading treatment was removed, respectively (Fig. 4). There was no interaction effect between two factors, corn hybrid and shading treatment.
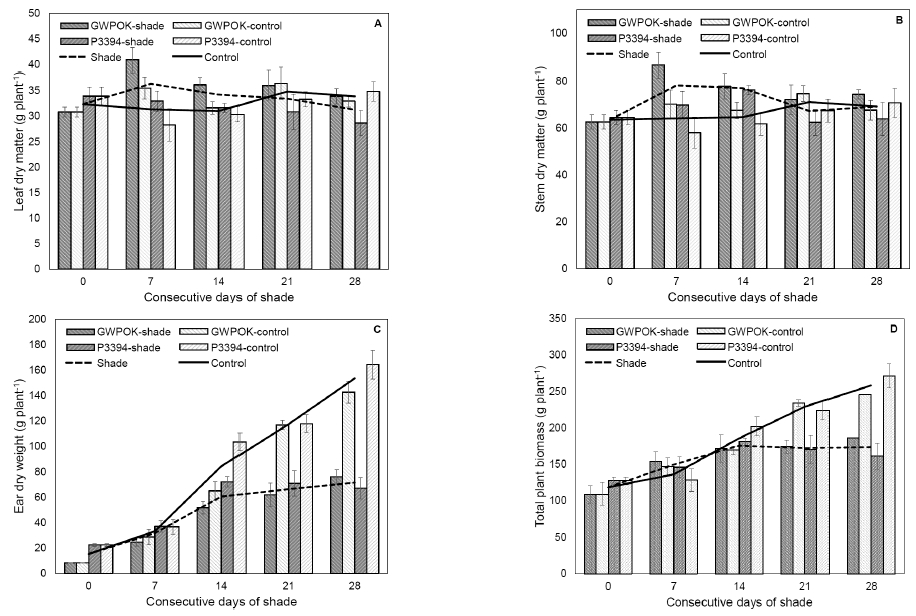
Fig. 4
Dry matter accumulation of leaf (A), stem (B), ear (C), and total plant biomass (D) in the control (0) and in plants receiving 7, 14, 21, and 28 days of consecutive shade. Error bar is standard error (n = 4).Shading treatment even for 28 days of CS didn't cause any significant change in dry weight of the leaves and the stem of both corn hybrids, Gwangpyeongok and P3394 (Fig. 4A and 4B), indicating that shade at the beginning of kernel filling stages has little effect on dry matter accumulation into stem and leaves.
However, dry matter accumulation in the ear was severely reduced by about 28, 44, and 53% at the 14-, 21-, and 28-day shading treatment, compared with the controls, respectively (Fig. 4C). Dry matter accumulation in the biomass was severely reduced by about 25 and 33% at the 21- and 28-day shading treatment, compared with the controls, respectively (Fig. 4D). These data showed that reduction in dry matter accumulation of the biomass by shade at the beginning of the kernel filling stages was due to reduction in that of the ear.
These results suggested that shade at the beginning of kernel filling stages have a stronger and faster effect on the dry matter accumulation in the ear than the biomass.
Effect of shading treatment on source-sink relations
The ratio of ear to biomass, and ratio of ear to leaf area, relative growth rate (RGR), net assimilation rate (NAR), specific leaf area (SLA), and leaf area ratio (LAR) were calculated (Fig. 5, Fig. 6, and Table 1), respectively.

Fig. 5
Ratio of ear dry matter to total plant biomass (A) and leaf area (B) in the control (0) and in plants receiving 7, 14, 21, and 28 days of consecutive shade. Error bar is standard error (n = 4).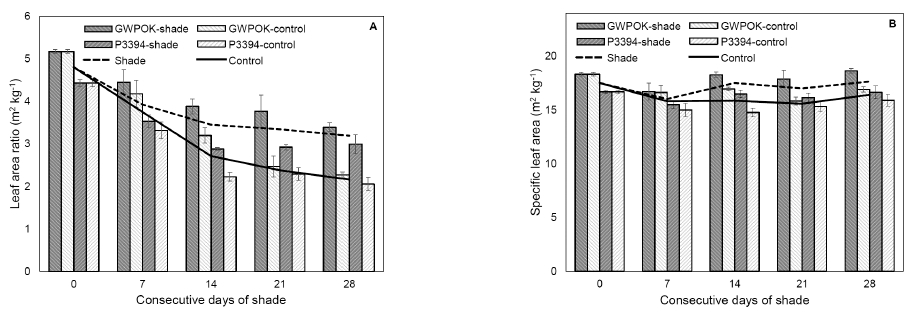
Fig. 6
Leaf area ratio (A) and specific leaf area (B) in the control (0) and in plants receiving 7, 14, 21, and 28 days of consecutive shade. Error bar is standard error (n = 4).Table 1
Relative growth rate (RGR) and net assimilation rate (NAR) of ear and biomass for the first 2 weeks and the second 2 weeks after shading initiation.
| Shade period | Treatment | RGR (g g-1 d-1) | NAR (g m-2 d-1) | ||
|---|---|---|---|---|---|
| Ear | Biomass | Ear | Biomass | ||
| The first 2 weeks | Control | 0.127 | 0.032 | 9.38 | 9.11 |
| Shade | 0.111 | 0.030 | 5.75 | 7.40 | |
| F-test† | ** | ns | ** | ns | |
| The second 2 weeks | Control | 0.045 | 0.024 | 9.44 | 10.02 |
| Shade | 0.016 | 0.004 | 1.54 | 1.05 | |
| F-test† | ** | ** | ** | ** | |
The ratio of ear to biomass represents a portion of total biomass taken by ear (Fig. 5A). It was significantly reduced by shading treatment even for 7 days. Shading treatment for 7, 14, 21, and 28 days caused about 11, 23, 26, and 31% decrease in the ratio of ear to biomass, respectively (Fig. 5A). The ratio of ear to leaf area is the dry matter accumulation in the ear per unit leaf area (Fig. 5B). Like the ratio of ear to biomass, shade led to the reduction in it by about 15% for 7 days, 41% for 14 days, 46% for 21 days, and 53% for 28 days, respectively (Fig. 5B). These results indicated that partitioning of photosynthate into the ear may decrease under shade.
The RGR is a prominent indicator of plant strategy with respect to productivity as related to environmental stress. By separate measurement of leaf, stem and ear mass as well as leaf area, good insight into the components underlying growth variation can be obtained. These underlying parameters are related to allocation of photosynthate into the corresponding organs (Pooter, 2013). The RGR is factored into the LAR and the NAR. The former is the amount of leaf area per unit total plant mass, and the latter is the rate of increase in plant mass per unit leaf area (Lambers et al., 2008).
For the first 2 weeks after shading initiation, the RGR of the ear and the biomass was 0.127 and 0.032 g g-1 d-1 at the control and 0.111 and 0.030 g d-1 at the shading treatment, respectively (Table 1). These results showed that the RGR of the ear was much greater than that of the biomass, particularly for the first 2 weeks after shading initiation (Table 1), indicating that ear growth is stronger than any other plant parts at the beginning of kernel filling stages when the shading initiation. For the first 2 weeks, shading treatment significantly reduced the RGR of the ear by about 13% and did that of the biomass by about 6% with no significance, compared with the control (Table 1). For the second 2 weeks, the RGR of the ear and the biomass was extremely lowered to 0.016 and 0.004 g g-1 d-1 by shade, respectively, causing about 65 and 84% decrease in the RGR of the ear and biomass, respectively, compared with the control (Table 1). These data suggested that the effect of shade at the beginning of kernel filling stages on the RGR of the ear and the biomass definitely appears for the second 2 weeks rather than the first 2 weeks.
The response of the NAR to shade was very similar to that of the RGR (Table 1). For the first 2 weeks after shading initiation, the NAR of the ear and the biomass was 9.38 and 9.11 g m-2 d-1 at the control and 5.75 and 7.40 g m-2 d-1 at the shading treatment. For the first 2 weeks, shading treatment significantly reduced the NAR of the ear by about 39% and did that of the biomass by about 19% with no significance, compared with the control (Table 1). For the second 2 weeks, the NAR of the ear and the biomass dramatically declined to 1.54 and 1.05 g m-2 d-1 by shade, respectively, causing about 84 and 90% reduction in the NAR of the ear and biomass, respectively, compared with the control (Table 1). These results showed that shade at the beginning of kernel filling stages similarly had an impact on the NAR of the ear and the biomass and did faster effect on the NAR of the ear than that of the biomass.
The SLA of the shaded plants for 14 days or longer was significantly higher by about 7~11% than that of the control ones (Fig. 6B), saying that leaf thickness decreased. It is in agreement with the previous report (Samarraie et al., 1990). They showed that 15 days shading treatment during flowering stage increased SLA by about 35%. Many authors have demonstrated a negative relationship between SLA and light intensity (Blackman et al., 1955; Cooper, 1966; Gmeling Meyling, 1973; Pears and Lee, 1969; Danalatos et al., 1994). At high light intensities, the thickness of the leaves increases and therefore SLA decreases, because carbon fixation exceeds translocation of photosynthate (Danalatos et al., 1994).
The LAR is the ratio of leaf area to the total biomass. The LAR of the shaded plants for 14 days or longer was significantly higher than the control ones like SLA (Fig. 6A). The shaded plants for 14, 21, and 28 days showed about 27, 40, and 48% higher LAR than the control ones, respectively (Fig. 6A), which is due to the biomass reduction (Fig. 4D) with no change in leaf area (Fig. 3B). Samarraie et al. (1990) also reported the similar results to our study that 15 days shading treatment during flowering stage increased LAR by about 36%. Blackman and Wilson (1951) demonstrated that NAR increased with daily irradiance and LAR was greatly decreased in sunflower. The LAR of shade grown soybean plants increased by over 40% than that of control ones (Wu et al., 2016).
According to these responses of RGR and NAR, shade at the beginning of kernel filling stages causes severe reduction in biomass and ear growth mainly due to decrease in the net gain of carbon assimilate per unit leaf area between photosynthesis and respiration, implying that it has an impact on source activity.
Effect of shading treatment on grain yield components
When the primary corn ear reached the physiological maturity after removal of shading treatment, it was harvested. corn grain yield components such as row number per ear, kernel number per ear row, percent of the filled kernels, the filled kernels per ear, and one hundred grain weight were measured (Fig. 7 and 8). There was no interaction effect between shading treatments and corn hybrids for the all measured variables except for row number per ear and 100-grain weight.
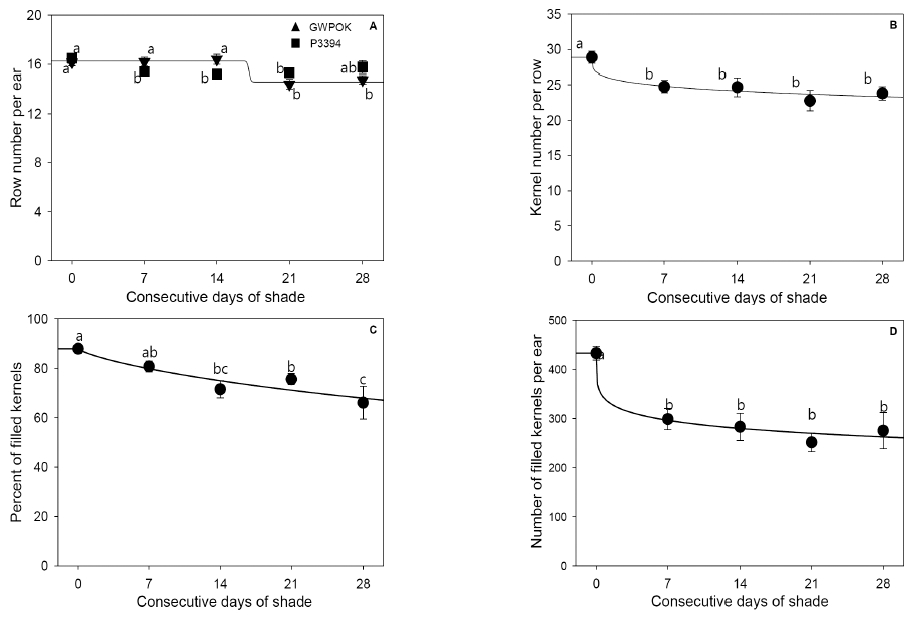
Fig. 7
Ear row number per ear (A), kernel number per ear row (B), percent of filled kernels (C), and number of filled kernels per ear (D) in the control (0) and in plants receiving 7, 14, 21, and 28 days of consecutive shade. Error bar is standard error (n = 20 and n = 38 for the shade and the control, respectively).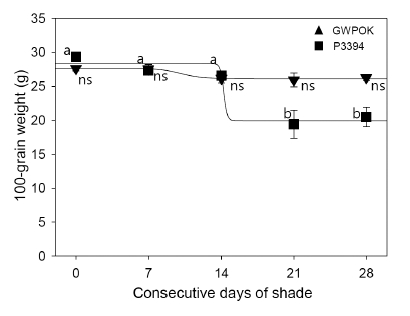
Fig. 8
One-hundred-grain weight in the control (0) and in plants receiving 7, 14, 21, and 28 days of consecutive shade. Error bar is standard error (n = 20 and n = 38 for the shade and the control, respectively).Shade at the beginning of kernel filling stages had little or a little impact on the row number per ear (Fig. 7A). The response of the row number per ear to the CS was a little different between two corn hybrids, P3394 and GWPOK. In GWPOK, it was slightly but consistently decreased by about 6 to 11% with statistical significance at the all shading treatments (Fig. 7A). In P3394, however, it was not significantly reduced even for 28 days of shade, compared with the control (Fig. 7A).
On the other hand, kernel number per ear row and the percent of the filled kernels logistically declined with the length of CS increased (Fig. 7B and 7C). The kernel number per ear row significantly decreased by about 14%, compared with that of the control for 7 days of shade. This decrease did not get any more with the length of CS increased (Fig. 7B). The percent of the filled kernels, however, was reduced by about 19 and 25% for 14 and 28 days of shade, respectively.
The number of the filled kernels is the function of the row number per ear, kernel number per ear row and the percent of the filled kernels. Thus it also declined logistically with the length of CS increased (Fig. 7D). For consecutive 7 days of shade, it was significantly reduced by about 31%, compared with that of the control. This reduction did not significantly get any more with the length of CS increased (Fig. 7D).
The response of 100-grain weight to the CS was definitely different between two corn hybrids (Fig. 8). In both hybrids, it was not affected by shade for the first 2 weeks after shading initiation, but for the second 2 weeks was reduced by about 30% only in P3394 (Fig. 8). Interestingly, the 100-grain weight of Gwangpyeongok was a little affected with no statistical significance even at the longest shading treatment. It is to be investigated further in the future study. Several authors (Reed et al., 1988; Uhart and Andrade, 1991) also demonstrated the similar results that shade during kernel filling stages reduced 100-grain weight. The shades intercepted 50% incident light throughout the kernel filling stages (onset of linear kernel dry matter accumulation to physiological maturity) reduced the 100-grain weight by about 12.8% (Reed et al., 1988).
In summary, the 7 or 14 days of shade did a substantial and irreparable damage to kernel number per ear row, percent of the filled kernels and number of filled kernels per ear but did a restorable effect on the 100-grain weight after removal of shading treatment. The row number per ear was not significantly affected by shade.
Effect of shading treatment on plant yield
Plant yield was measured based on biomass, grain, and ear, respectively. There was no interaction effect between shading treatment and corn hybrids. Plant yield data were pooled over corn hybrids. Plant yield of biomass, grain, and ear logistically declined with the length of the CS increased (Fig. 9A, 9B and 9C). Harvest index acted on the length of CS in similar manner to plant ear and grain yield (Fig. 9D).

Fig. 9
Plant yield of biomass (A), ear (B), and grain (C), and harvest index (D) in the control (0) and in plants receiving 7, 14, 21, and 28 days of consecutive shade. Error bar is standard error (n = 20 and n = 38 for the shade and the control, respectively).The corn plants shaded at the beginning of kernel filling stages got an irreversible damage on these all kinds of plant yield even for consecutive 7 days of shade (Fig. 9). Biomass yield gradually decreased with the CS increased, which was reduced by about 14 and 28% at the 14- and 28-day CS, respectively (Fig. 9A). The yield of ear and grain dramatically declined by about 32 and 34% at the 7-day CS, respectively (Fig. 9B and 9C). The ear and the grain yield at the 28-day CS were reduced by about 52 and 50%, respectively (Fig. 9B and 9C). Harvest index abruptly decreased by about 24 and 35% at the 7- and 28-day CS (Fig. 9D), respectively, indicating that dry matter partitioning into kernels is not to be recovered even for 7-day shade at the beginning of kernel filling stages.
Probit analysis was carried out to estimate how the length of consecutive days of shade has an impact on these three kinds of plant yield. The days of CS to cause 25 and 50% reduction in plant yield (hereafter, RD25 and RD50) was obtained from probit analysis, respectively. The results are summarized in Table 2.
Table 2
Estimated days to cause specific reductions in plant yield determined from probit analysis and average daily loss rate of plant yield.
| Plant yield | Days to cause | Average daily loss rate (% d-1) † | ||
|---|---|---|---|---|
| 25% reduction (RD25) ‡ | 50% reduction (RD50) ‡ | From beginning to RD25‡ | From RD252) to RD50‡ | |
| Biomass | 22.5 | N/A* | 1.1 | N/A* |
| Ear | 4.0 | 21.6 | 5.9 | 1.4 |
| Grain | 3.7 | 23.1 | 6.3 | 1.3 |
‡ RD25 and RD50 are the consecutive days of shading to cause 25% and 50% reductions in plant yield, respectively, as determined by probit analysis.
* N/A, not available.
The RD25 for the plant yield of biomass, ear, and grain was 22.5, 4.0, 3.7 days of CS, respectively (Table 2). During these corresponding periods, every single day of the shade at the beginning of kernel filling stages caused about 1.1, 5.9, and 6.3% loss in plant yield of biomass, ear, and grain, respectively (Table 2). The RD50 for the plant yield of biomass was not to be estimated because it escaped from the given sample period of 28 days of CS (Table 2). The RD50 for the plant yield of ear and grain was 21.6 and 23.1 days of CS, respectively (Table 2). During these corresponding periods, every single day of the shade caused about 1.4 and 1.3% loss in plant yield of ear and grain, respectively (Table 2). These results suggested that shade during kernel filling stages have a severer impact on ear and grain yield than biomass and the plant yield loss may be achieved mainly for the first week of CS.
Discussion
In this study shading treatment was imposed at 10 days after silk emergence, known as the time when the kernel filling stage starts (Abendroth et al., 2011). Our results showed that shade at this time did not affect the vegetative dry matter such as stem and leaf. It was accordance with the previous report that at 10 to 12 days after silk emergence plants have reached maximum height and maximum vegetative dry matter (Abendroth et al., 2011). However, ear dry matter accumulation was significantly reduced for 14 days or longer shading treatment but not for 7 days of shade. It may be because the first 7 days of shade is a lag period of grain dry matter accumulation and after that time grain dry matter is linearly accumulated (Abendroth et al., 2011; Tollenaar, 1977).
Whole plant growth rate is a function of source and sink strength, divided into size and activity, respectively (Acton, 2012; Krieg, 1983; Tollenaar, 1977; White et al., 2016). Source strength is factored into leaf area as size and photosynthetic rate as activity and sink strength is factored into the number of growing sinks as size and the rate of incorporation of dry matter as activity (Krieg, 1983; Marcelis, 1996; Tollenaar, 1977).
In this study, ear and leaf are the main sink organ and the principal source one as a photosynthetic apparatus of corn plant at the beginning of kernel filling stages, respectively, when the shading treatment was imposed.
The leaf area was not changed by shade, indicating that the source size was not limited by the shade during the kernel filling stages. The SLA of the shaded plants for 14 or longer days, however, was higher by about 7~10% than that of the control ones. In corn, a negative relationship between SLA and carbon exchange rate (hereafter, CER) was found for three tropical and three temperate inbred lines in the field (Verheul et al., 1996). Hund et al. (2005) demonstrated that SLA is negatively correlated with CER whenever the variation in the CER, due to environmental or genetic influences, is large. For the first and the second 2 weeks, the NAR of the shaded corn plants was much lower by about 19 and 90% than that of the control ones, respectively, indicating that efficiency of leaves in generating photoassimilate. Reed et al. (1988) showed that the shaded plants during kernel filling decreased photosynthesis by approximately 50%. These results suggested that the source activity is limited by the shade during the kernel filling stages unlike source size.
In this study, the kernel number per ear row at maturity was reduced by about 14 and 17% at the 7- and 28-day CS, respectively, indicating that kernel abortion occurred. Kernel abortion occurs primarily during the beginning of kernel filling stages (called as stage of blister and milk) and is a related to an inadequate carbohydrate supply from the plant. The kernels fertilized las are those aborted first resulting in the tip kernels most often aborted (Abendroth et al., 2011) as observed in this study that tip-fill length was reduced by about 16% at the 7-day CS (data not shown). The number of the filled kernels at maturity decreased by about 31 and 36% at 7- and 28-day shade, respectively. Several authors (Reed et al., 1988; Uhart and Andrade, 1991) also demonstrated the similar results that shade during kernel filling stages reduced the kernel number. The shades intercepted 50% incident light throughout the kernel filling stages (onset of linear grain dry matter accumulation to physiological maturity) reduced the kernel number per ear row by about 4.7%, respectively (Reed et al., 1988). These data suggested that sink size is inhibited by the shade during the kernel filling stages.
The RGR is a measure of sink activity (Atwell et al., 1999; Cooper, 1975; Marcelis, 1996). The RGR of the ear was reduced by about 13 and 65% for the first and the second 2 weeks, respectively, indicating that the sink activity was inhibited by shade. The response of the RGR of the ear to shade was similar to that of the NAR, implying that the inhibition of the source activity led to the decrease in the sink activity. The RGR and the NAR of sunflower decreased with irradiance decreased (Blackman and Wilson, 1951). The RGR was positively correlated with the NAR (Medek et al., 2007). These data indicated that sink activity is inhibited by the shade during the kernel filling stages. According to the results, the shade during the kernel filling stages limited sink activity more than sink size.
To recap briefly, the shade at the beginning of kernel filling stages was a source activity limited condition with no limitation to source size and led to the feedback inhibition on sink activity and size.
In this study, plant yield exhibited logistic decline with the length of the CS. Only the 7 days of shade at the beginning of kernel filling stages did an irreparable loss to plant yield of biomass, ear and grain and caused steeper reduction in the grain and the ear yield than in the biomass. The RD2525 and RD50 of the grain yield was about 3.7 and 23.1 days of CS, respectively. The average daily loss rate of the grain yield was 6.3% for the first 4 days of shade and 1.3% for the rest of 23 days of shade, respectively.
In conclusion, shade at the beginning of kernel filling stages had little impact on the source size such as dry matter accumulation in leaves and stem and leaf area but severe impact on the source activity such as NAR, LAR, and SLA. This limitation on source activity inhibited sink activity and even sink size. The corn plants shaded at the beginning of kernel filling stages for 7 days got an irreversible damage on kernel number per ear row, percent of the filled kernels and the number of filled kernels per ear but a reversible damage on the 100-grain weight after removal of shade. Consequently, corn yield decreased logistically with the length of the CS increased and its loss occurred largely for the first week of CS at the beginning of kernel filling stages. Analysis of genetic difference in response to shade is ongoing. It is to be investigated in the future what genes in leaves and kernels respond to shade to understand source-sink relations on the molecular basis.