

Soybean (Glycine max L.) is cultivated over the world and especially has been a crucial legume crop in eastern Asia region including Korea, China, and Japan because this crop has been important source of high quality vegetable protein and oil for food products. Recently, the usage of soybean for biodiesel has made this crop more economically important, and the whole-genome sequencing of Williams 82 (G. max) and IT182932 (G. soja) have been completed accordingly (Hisano et al., 2007; Kim et al., 2010; Schmutz et al., 2010). Yu & Kiang (1993) reported that Korea might be one of the major center of soybean origins based on electrophoretic assays of wild soybean (G. soja) and cultivated soybeans (G. max). Lee et al. (2008) also suggested that Korea is a major center of diversity for wild soybean and potentially could serve useful alleles not found in other parts of the world while Dong et al. (2004) regarded northeastern region of China as major center of soybean origin. Furthermore, the collection of Korea and China revealed divergent genotypes while accessions of Japan was genetically similar to Korean accessions (Lee et al., 2011; Li & Nelson, 2001).
The soybean cultivars, derived from a few accessions, show narrow genetic background, and this means cultivated varieties might be vulnerable to new biotic and abiotic stress along with global environmental changes (Hyten et al., 2006; Mulato et al., 2010). The genetic diversity of soybean including landraces and wild relatives is needed for breeding program and bioindustry as a valuable allele source. Especially, landraces collected in center of origins are useful for genetic improvement of cultivars in that wild relatives generally reveal many unwanted traits and show low introgression rate (Song et al., 2013). Genetic analysis using molecular markers have been consistently studied to understand the genetic variability of soybeans, and have revealed the genetic structure and diversity of various soybean collections (Choi et al., 1999; Dong et al., 2004; Guan et al., 2010; Lee et al., 2008; Li et al., 2008; Wang et al., 2006; Yoon et al., 2009).
Microsatellite or simple sequence repeats (SSRs) markers has been used for genetic diversity analysis because microsatellites are plentiful variations over the genome and highly reproducible and easy for genotyping as a codominant markers. The high level of polymorphism was detected in several soybean collections; 18.3 alleles (6 microsatellite loci) in Korean soybean accessions (Yoon et al., 2009), 25.5 alleles (46 microsatellite loci) in wild soybean collection (Lee et al., 2008), 12.2 alleles (60 microsatellite loci) in Chinese soybean accessions (Wang et al., 2006), 19.7 alleles (59 microsatellite loci) in soybean landraces of China (Li et al., 2008). Using microsatellite markers, Choi et al. (1999) analyzed the collection acquired from five major rivers in Korea and they supported that SSR markers are useful tool to classify cultivated soybeans and wild soybeans, and Dong et al. (2004) analyzed genetic diversity of cultivated soybean accessions collected from several provinces of China and proposed one possible diversity center.
In this paper, we analyzed the genetic diversity of soybean collection mainly introduced Korean accession from USDA National Plant Germplasm System of USA using genome-wide 75 microsatellite markers.
Materials and Methods
Plant materials and DNA extraction
A total of 644 soybean and wild soybean accessions were used in this study; 619 soybean (G. max) accessions (507 - Korea, 57 - China, 19 - Japan, 36 - Southeastern Asia) and 25 wild soybean (G. soja) accessions (6 - Korea, 9 - China, 10 – Japan) were included for diversity analysis (Table 1, supplementary Table S1). The majority of Korean soybean accessions were re-introduced from USDA National Plant Germplasm System of USA because these accessions were not conserved in Korean National Agrobiodiversity Center before.
Table 1.
Summary information on soybean (Glycine max & G. soja) accessions used in this study.
| Species | Origin | Accession number |
|---|---|---|
| Soybean (Glycine max) | Korea | 507 |
| China | 57 | |
| Japan | 19 | |
| Southeastern Asia | 36 | |
| Sub total | 619 | |
| Wild soybean (Glycine soja) | Korea | 6 |
| China | 9 | |
| Japan | 10 | |
| Sub total | 25 | |
| Total | 644 | |
All plant materials were distributed from the National Agrobiodiverstiy Center, National Academy of Agricultural Science (NAAS), Rural Development Administration (RDA), Republic of Korea. Total genomic DNA was extracted by modified cetyltrimethylammonium bromide (CTAB) method (Dellaporta et al., 1983) using young leaf tissue after grinding in liquid nitrogen. DNA concentration and quality were determined with a NanoDrop ND-1000 spectrometer (NanoDrop Technologies, Wilmington, DE, USA), and DNA stocks were finally diluted to working solutions of of 20 ng/μl.
Genotyping with microsatellite markers
Genome-wide 75 microsatellite markers were chosen along the soybean genetic linkage map. The reproducibility of PCR product size was evaluated by performing three replications using two different samples for each SSR primer. The M13Ftail PCR method of Schuelke (2000) was used to measure the size of PCR products, as described previously (Lee et al., 2014). The PCR master mix was prepared as follows: Each 20 μl reaction mixture contained 20 ng template gDNA, 1X PCR buffer, 2 uM specific primer, 200 uM dNTPs, 4 uM M13 universal primer, 6 uM normal reverse primer, and 0.5 U Taq-polymerase (SolGent, Korea). PCR was performed as follows: denaturation at 94°C (3 min) then 30 cycles each of 94°C (30 s), 55°C (45 s), and 72°C (1 min), followed by 10 cycles of 94°C (30 s), 53°C (45 s), and 72°C (1 min), and a final extension at 72°C for 10 min with a PTC-200 thermocycler (MJ Research, Waltham, MA, USA). Amplified PCR products were resolved using an ABI PRISM 3130xl Genetic Analyzer (Applied Biosystems, Foster City, CA, USA) with GeneScan 500 ROX (6-carboxy-rhodamine) as molecular size standard (35–500 bp).
Data analysis
As a indicator of genetic diversity, the major allele frequency (MAF), number of alleles (NA), observed heterozygosity (HO), expected heterozygosity (He) and polymorphism information content (PIC), were calculated using the genetic analysis package PowerMarker V3.25 (Liu & Muse, 2005). Phylogenetic dendrogram was constructed with an unweighted pair-group method of the arithmetic average (UPGMA) based on genetic distance matrix using the same software. The Structure software (V2.2) (Pritchard et al., 2007) was utilized to detect possible subpopulations (K=1 to K=10) with a model allowing for admixture and correlated allele frequencies using a burn-in period of 50,000 and MCMC repeats of 50,000 followed by 3 iterations. The optimal number of populations corresponds to the highest peak in the ΔK graph (Evanno et al., 2005), and the accessions with membership probabilities ≥ 70% were assigned to each subpopulation. The molecular variance for geographical regions was calculated by molecular variance (AMOVA) approach using the GenALEx software (ver. 6.1) (Peakall & Smouse, 2006).
Genetic variability of soybeans
To reveal the genetic diversity of retained Korean soybean accessions in 75 SSR loci, major allele frequency (MAF), number of alleles (NA), expected heterozygosity (HE), observed heterozygosity (HO) and polymorphic information content (PIC) are analyzed and presented in Table 2 and supplementary Tabel S2. The mean value of MAF was 0.476 (satt276; 0.111~ satt328; 0.913) and 0.278 (satt316 and satt157; 0.091~satt229; 0.833) in soybean and wild soybean accessions, respectively. A total of 1,503 alleles (soybean; 1,200 alleles, wild soybean; 835 alleles) with an average value of 20.0 alleles (soybean; 16.0 mean alleles, wild soybean; 11.4 mean alleles) were detected in 75 SSR loci. Among the tested soybean samples, The Korean accessions revealed average allele number of 13.4 (2~39) while Chinese, Japanese and Southeast Asian accessions showed 9.0, 5.4 and 6.5 mean alleles, respectively. Interestingly, the mean private allele number of Korean group was 3.4 contrary to other soybean geographical groups ranged from 0.2 to 0.7 mean alleles (Fig. 1). The mean expected heterozygosity (HE) and polymorphic information content (PIC) among soybean accessions was ranged from a 0.162 on satt328 to 0.954 on satt276 (mean = 0.654) and from 0.156 on satt328 to 0.952 on satt323 (mean = 0.616), respectively. The average HE values were not significantly distinguished according to the geographical group as Korea of 0.628, China of 0.637, Japan of 0.638 and Southeast Asia of 0.600 while wild soybeans revealed higher mean HE values of 0.826 ranged from 0.299 to 0.941.
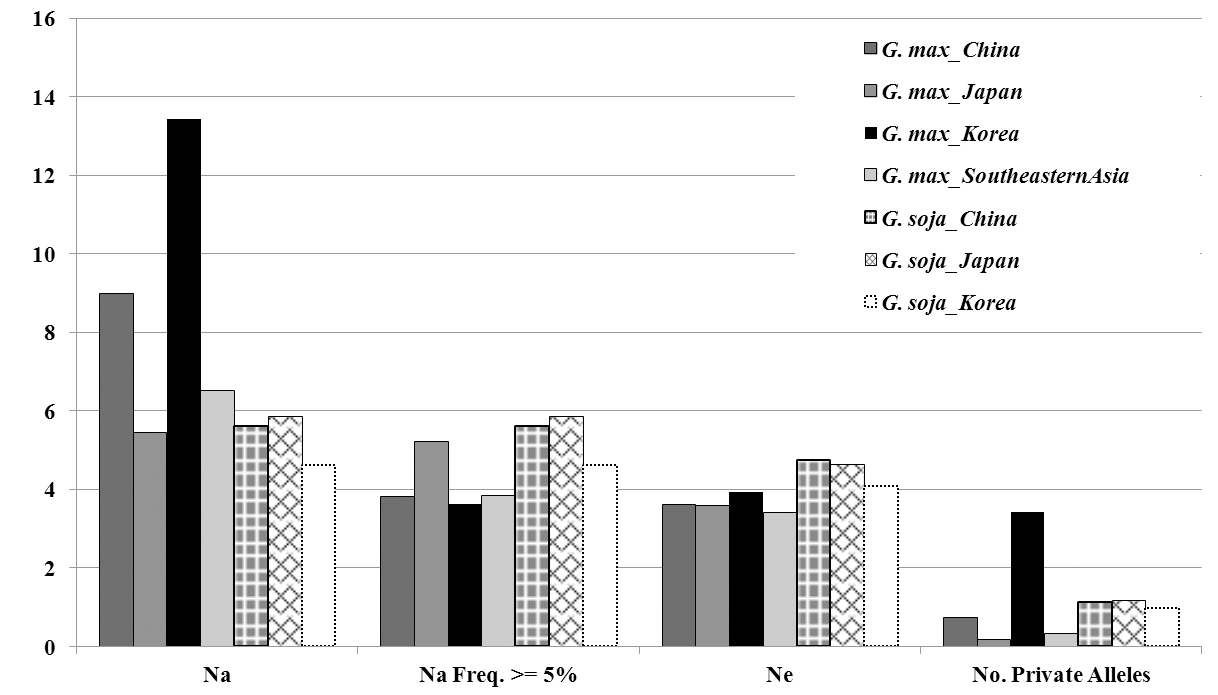
Table 2.
Summary of genetic diversity indices in 644 soybean accessions using 75 microsatellite markers.
Genetic relationship and population structure
To reveal genetic relationship of tested 644 accessions, we constructed the phylogenetic dendrogram based on DNA profiles of 75 SSR loci (Fig. 2). The soybean and wild soybean were critically divergent, and soybean accessions could be divided into three groups in a genetic distance value of 0.72; Group-1 was mainly composed of Korean and Japanese soybean accessions, main Chinese accessions were appertained into Gropu-2 and Group-3 inculded mainly Southeast Asian accessions. According to the phylogenetic analysis Korean and Chinese soybean gene pools were divergent, and Japanese accessions tied into Korean gene pool while Southeast Asian accessions showed near genetic relationship to Chinese accessions.
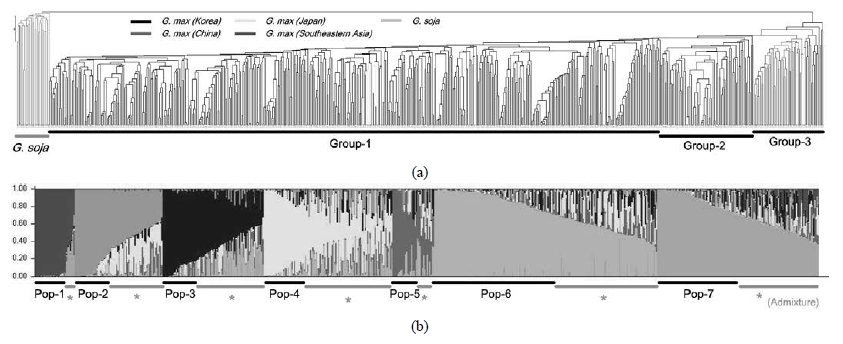
Fig. 2.
Phylogenetic dendrogram (a) and model-based population structure based on SSR profiles of 644 soybean accessions.The model-based Bayesian clustering method was used to detect the possible subpopulations along the tested soybean gene pools, and we could find significant population structure. For each K value (K = 1 to 10), we determined the optimal value of K by calculating ΔK. As we used soybean and wild soybean accessions in this study, we surveyed the highest ΔK value over “K=3”. The seven subpopulations, referred to as Pop-1~ Pop-7, were observed with the highest ΔK value (data not shown), and 331 accessions were admixture type with an membership probability < 70% (Fig. 2). Most accessions were distinguished according to the geographical origin; soybean accessions could be divided into six subpopulations (Pop-2~ Pop-7) while wild soybean accessions were tied into Pop-1 group. Korean accessions were sub-divided into five subpopulations (Pop-2~Pop-6), and the Pop-3 included three Japanese accessions. Chinese and Southeast Asian accessions were located in Pop-7, and some Korean accessions were included in this group. The AMOVA analysis showed that the molecular variance between the geographical groups accounted for 13% and the remaining 87% were due to the differences within the geographical groups.
Discussion
Soybean is important legume crop for protein and oil source, but the recent cultivated varieties reveals narrow genetic background and weak adaptability to global environment changes (Hyten et al., 2006; Mulato et al., 2010). As Korea is one of the center of soybean origins, we analyzed the genetic diversity of Korean soybean collection using 75 microsatellite markers for a sustainable conservation and utilization.
In this study, Korean soybean accessions revealed average allele number (NA) of 13.4, HE of 0.628 and PIC of 0.589, and the NA of Korean accession was higher than other regional groups (China – 9.0, Japan – 5.4, Southeast Asia - 6.5). As we analyzed the more Korean samples than other geographical regions, detection of more alleles in Korean collection is expectable results, but the average private allele number of Korean accessions was 3.4 contrary to other soybean geographical groups ranged from 0.2 to 0.7 mean private alleles. This means that the Korean accessions conserve distinct alleles and might be valuable sources for breeding program and bio-industry with the regional specific alleles. In previous studies, (Li et al., 2011) reported average 14.2 alleles and 0.806 genetic diversity in Chinese core soybean collection at 55 microsatellite loci, and (Guan et al., 2010) reported 16.2 alleles with a mean gene diversity of 0.84 in Chinese and Japanese soybean collection at 46 SSR loci. Our results showed a little low allele numbers and genetic diversity values, but determining the diversity level is inappropriate because of different microsatellite loci and collection. The wild soybean (G. soja) revealed higher mean HE values of 0.826 than soybean (G. max) of 0.654, and this is reasonable in that wild relative generally conserve more genetic diversity than domesticated landraces.
The phylogenetic dendrogram and deduced population structure based on DNA profiles of 75 SSR loci showed that Korean and Chinese soybean accessions formed divergent gene pools. The AMOVA for geographical groups revealed that 13% and 87% of total variation were due to the differences between and within geographical groups, respectively, and this indicated that the significant geographical differentiation was present. Japanese accessions showed high genetic relationship to Korean soybean gene pools, whereas Southeast Asian accessions were similar to Chinese accessions. As previous studies (Lee et al., 2011; Lee et al., 2008; Li & Nelson, 2001; Yu & Kiang, 1993), soybean germplasm of Korea region conserve distinct genetic diversity compared to Chinese accessions, and Japanese and Korean accessions were more similar to each other. By model-based bayesian clustering method showed that Korean soybean accessions could be subdivided into five subpopulation (Pop-2~Pop6). The results in this study indicate that Korean soybean accessions have specific genetic diversity and might be serve the valuable alleles for bio-industry as a part of the center of soybean origin.
Continuous utilization of limited elite cultivars reduces the genetic background of cultivated soybean, and the adaptability against rapidly changing circumstance might decline accordingly. This study serves that Korean soybean accessions show distinct genetic diversity and is composed of several subpopulations. The detected specific alleles and population structures could elevate the utilization Korean soybean genetic resources.