

INTRODUCTION
MATERIAL AND METHOD
Sample preparation and experimental design
Milled rice quality
Starch isolation
Granule size distribution and damaged starch contents
Gelatinization properties
Statistical analysis
RESULT AND DISCUSSION
Growth, yield and milled rice quality
Granule size distribution and damaged starch content
Gelatinization properties
Correlation between amylose content and pasting properties
CONCLUSION
INTRODUCTION
The rice protein, amylose, Mg, and K content is known as chemical factor affecting the taste of rice. The content of amylose and protein is widely used as a criterion for determining the rice taste. The lower the amylose and protein content, the better the rice tastes (Kim et al., 1991). However, among rice varieties with similar amylose and protein content, there are varieties that show differences in rice taste, especially Tongil-type rice varieties. Although the Tongil-type rice varieties have similar or lower amylose content than general Japonica-type rice varieties, the panel’s taste valuation results are not good (Lee et al., 2014). Since there are limitations in explaining the taste of rice only with amylose or protein content, various attempts have been to interpret the factors related to rice taste, such as starch studies using electron microscopy (Kum et al., 2004; Kim et al., 2005), fat content of rice endosperm (Yoon et al., 2012), and storage protein characteristics (Kwak et al., 2016). As a result of previous studies, the proteins surrounding starch granules is directly involved in water permeability, starch gelatinization, and suppression of swelling during the cooking process, and affects the elasticity and viscosity of rice (Son et al., 2002; Choi, 2002). In addition, α-1, which are subunits of acidic glutelin, albumin, and globulin affects the rice taste of Tongil-type rice varieties (Kwak et al., 2016).
Starch is the main source of energy stored in cereal grains. The amount of starch in grains varies, but typically accounts for 60-75% of grain weight and provides 70-80% of calories consumed by humans worldwide (Thomas & Atwell, 1999). Starch is the most abundant component in rice grains, making up approximately 90% of the dry weight of milled rice grains (Fitzerald et al., 2004). Starch determines the eating and cooking quality of rice grains, at least contributes to them through interactions with other components in the rice endosperm (proteins, lipids, water) or through interactions with other ingredients used to process the rice (Fitzerald et al., 2004). The content and structure of amylose and amylopectin affect the architecture of the starch granule, gelatinization and pasting profiles, and textural attributes.
The physicochemical properties of rice starches are highly dependent on the rice variety, environment, cultural practices, and extraction conditions. Many studies have revealed that the physicochemical characteristics such as the amylose/amylopectin ratio and granule size are responsible for the properties of starch (Singh et al., 2003). Cereals high in amylose content and resistant starch offer potential health benefits. Resistant starch is kind of starch or starch products that are not digestible and absorbed in the stomach or small intestine and passed on directly to the large intestine (Asp, 1992). A cereal grain higher in amylose content is always a good source of resistant starch (Jiang et al., 2010). Cereals high in resistant starch are benefit to improve human health and to reduce the risk of those serious non-infectious disease (Regina et al., 2006).
In this study, the starch characteristics and pasting properties of Tongil-type rice varieties with different amylose content were compared with Boramchan, a Japonica-type rice variety, and analyzed.
MATERIAL AND METHOD
Sample preparation and experimental design
The varieties used in the experiments includes three Tongil-type rice variety (Dasanbyeo, Hanarum2, Amimyeon) and one Japonica-type rice variety (Boramchan). In 2020~2022, these varieties were transplanted after puddling a designated experimental plot in May 30th at a paddy field of Gyeongsangbuk -do agricultural Research & Extension Services. The planting distance was 30×12 cm, the amount of the fertilizer applied was N-P2O5-K2O=18-9-11 kg 10a-1, and the N fertilizer was split applied as a basal, tillering, panicle initiation application with a ratio of 50-25-25. When the grain moisture lowered to 15%, after removing the rice husks with a laboratory milling machine (SY94+RTA2+2400, Ssangyong, Korea), pulverizing them using a food grinder (HMF-2100S, Hanil Electronics, Korea). Then, flour from all varieties was passed through a 100 mesh sieve and used as test sample.
Milled rice quality
The husked grain was milled by uniformly placing pressure (SY21-NSART1003, Ssangyong, Korea), achieving 90% milled rice per brown rice ratio. Milled rice quality such as head rice and crushed rice ratio were measured in a Grain Analyzer (Cervitec Grain Inspector 1625, Foss, Sweden). Rice endosperm protein and amylose contents were measured using Near-Infrared Grain Tester (Infratec 1241, Foss, Sweden).
Starch isolation
Starch was isolated through alkaline treatment after soaking the rice grains in water (Yamamoto & Shirakawa, 1999). After drying the soaked rice, it was dried and pulverized using a blender, and steeped repeatedly in 0.2% NaOH solution. Thereafter, the precipitate was collected, thoroughly washed with deionized water, neutralized with 1N HCl, and centrifuged at room temperature at 1,300 × g for 10 min (VS-21SMT, Vision Scientific Co., Ltd, Korea). The isolated starch was dried at room temperature and sieved with 100 mesh screen.
Granule size distribution and damaged starch contents
A laser diffraction particle size analyzer (Malvern Mastersizer 2000, Malvern Instruments Ltd., UK) was used to measure the granule size distribution of flour from four different rice varieties. Powder samples were then immersed in ethyl alcohol for 30 s after sonication.
Damaged starch content was measured using the Megazyme kit (Megazyme International Ireland, Wicklow Ireland) according to the American Association of Cereal Chemists (AACC) method 76-31 (AACC, 76-31).
Gelatinization properties
Starch pasting properties
Starch pasting properties of rice flours were measured with a Rapid Visco Analyzer (RVA, Model 4, Newport Scientific, Australia). RVA characterization included initial pasting temperature, peak viscosity, though viscosity, final viscosity, breakdown (BD), and setback (SB) from the RVA viscogram.
Differential scanning calorimetry (DSC)
The gelatinization properties of starch were evaluated using Differential scanning calorimetry (DSC). Briefly, 3.0 mg of rice flour and deionized water (1:2, v/v) were left for 1 h and then heated from 30℃ to 100℃ at a rate of 10℃/min using a DSC (DSC 8500, Perkin Elmer, Waltham, MA, USA). From this peak, the gelatinization onset temperature (To), gelatinization peak temperature (Tp), gelatinization conclusion temperature (Tc), and gelatinization enthalpy (⊿H) were measured in triplicate.
Statistical analysis
One-way ANOVA of the average values was performed to identify significant differences between-groups (P<0.05). Duncan’s multiple range test was also performed to identify differences between treatment using R statistical software (version 3.6.2). All tests were performed in triplicate.
RESULT AND DISCUSSION
Growth, yield and milled rice quality
Tongil-type rice varieties had longer panicles and higher rice yields (721-765 kg 10a-1) than Boramchan, a high-quantity Japonica-type rice variety (Table 1, and Fig. 1). The protein content of Tongil-type rice varieties was relatively higher than that of Boramchan, a Japonica-type rice variety, and the head rice ratio was low. Tongil-type rice varieties, except Amimyeon (Milyang355), had lower amylose content than Boramchan (Table 2). Amimyeon had higher protein content than the other varieties, and its amylose content was particularly high at 39.2%. Amimyeon is a new rice variety developed by Rural Development Administration in 2022. In general, Tongil-type rice varieties have higher yield than Japonica-type rice varieties and are characterized by long grains (Sim et al., 2018).
Table 1.
Growth and yield components of Tongil-type rice varieties.
| Variety |
Heading date (M.D) |
Culm length (cm) |
Panicle length (cm) |
Panicle number (No/plant) |
Spikelet number (No/panicle) |
Grain ripening (%) |
1,000 grain weight of brown rice (g) |
| Dasanbyeo | 8. 6. ± 2.7† | 75 ± 5.1 | 23 ± 1.0 | 13 ± 0.5 | 112 ± 16.8 | 80.3 ± 5.40 | 25.8 ± 0.40 |
| Hanarum2 | 8. 8. ± 0.0 | 76 ± 3.5 | 23 ± 1.0 | 14 ± 0.9 | 98 ± 7.8 | 83.0 ± 2.34 | 24.5 ± 0.00 |
| Amimyeon | 8.13. ± 2.7 | 72 ± 1.5 | 22 ± 1.0 | 14 ± 1.0 | 111 ± 6.5 | 91.2 ± 1.70 | 21.2 ± 0.12 |
| Boramchan†† | 8.15. ± 4.6 | 71 ± 4.6 | 21 ± 0.6 | 15 ± 0.5 | 93 ± 7.8 | 83.1 ± 9.12 | 22.9 ± 1.33 |
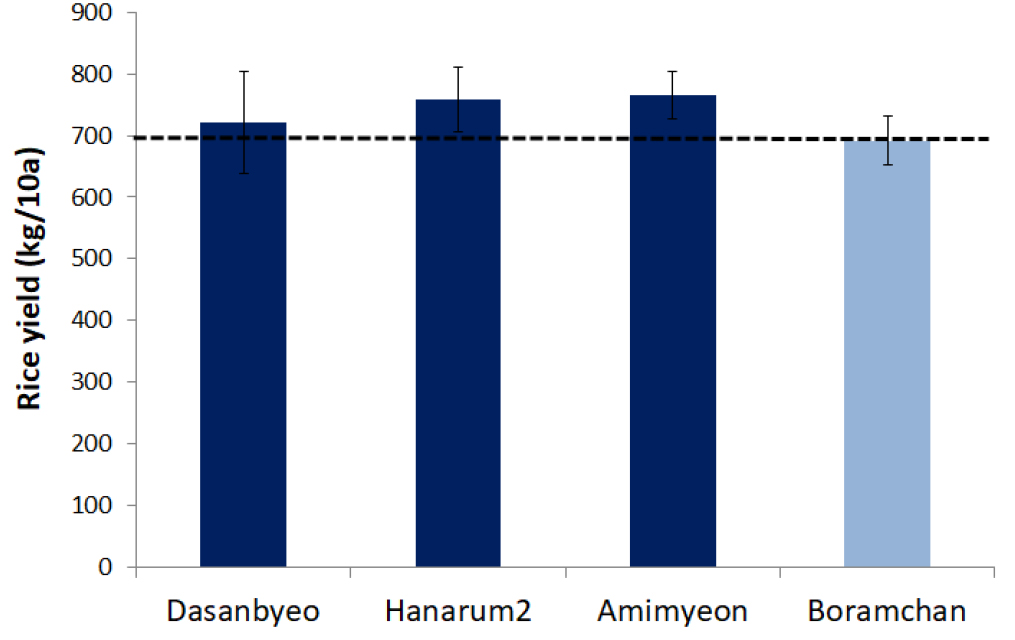
Table 2.
Protein, amylose contents, and milled rice quality of Tongil-type rice varieties.
| Variety | Protein (%) | Amylose (%) | Head rice (%) | Crushed rice (%) |
| Dasanbyeo | 7.5 ± 0.02b† | 17.6 ± 0.18c | 30.1 ± 8.43c | 66.5 ± 9.08a |
| Hanarum2 | 7.6 ± 0.06b | 17.8 ± 0.16c | 55.3 ± 1.79b | 41.3 ± 1.67b |
| Amimyeon | 8.7 ± 0.06a | 39.2 ± 0.52a | 29.2 ± 5.08c | 62.0 ± 6.60a |
| Boramchan†† | 6.8 ± 0.05c | 19.0 ± 0.04b | 81.2 ± 1.82a | 13.6 ± 1.53c |
Granule size distribution and damaged starch content
The size distribution of rice flour granules directly affects the quality of final products, including bread and noodles, due to changes in the gelatinization properties (Hallick & Kelly, 1992) and gel consistency (Cagampang et al., 1973) of rice flours (Evers & Stevens, 1985). The particle size distribution and damaged starch contents of each variety is reported in Table 3. The distribution of starch granule size of four varieties used in the experiment was similar, and the particle size corresponding to D50 was approximately 87.8-81.9 μm. The damaged starch content was 3.2-4.5%. Dasanbyeo had a relatively small amount of 3.2% damaged starch. Damaged starch can be used as a substrate for starch hydrolases, but excessive proportions of damaged starch can affect dough quality negatively.
Table 3.
Particle size distribution (D10, D50, and D90) of Tongil-type rice varieties.
| Variety | Particle size (μm) | Damaged starch (%) | ||
| D10† | D50 | D90 | ||
| Dasanbyeo | 21.6 ± 1.33ns†† | 88.3 ± 2.48ns | 180.8 ± 2.88ns | 3.2b |
| Hanarum2 | 22.7 ± 2.45 | 91.9 ± 4.83 | 185.1 ± 6.45 | 4.5a |
| Amimyeon | 21.6 ± 1.13 | 88.1 ± 2.51 | 179.3 ± 3.41 | 4.0a |
| Boramchan†† | 21.1 ± 1.74 | 87.8 ± 2.47 | 178.2 ± 2.21 | 3.9a |
†D10, D50, and D90 represent 10%, 50%, and 90% of the cumulative particle size distribution, respectively.
Gelatinization properties
Pasting properties
The pasting properties of rice flour varied among varieties (Fig. 2, and Table 4). Pasting is the phenomenon following gelatinization in the dissolution of a starch and involves granular swelling, exudation of molecular components from the granules, and eventually, total disruption of the granules (Thomas & Atwell, 1999). In general, Japonica-type varieties with a high taste value are known to have low pasting temperatures, HPV and BD, and low final viscosity (Choi et al., 2006). The Dasanbyeo and Hanarum2 amylogram patterns were similar. These two varieties had a higher PV, and lower SB than Boramchan, a Japonica-type rice variety. In the case of Amimyeon, the HPV, CPV, and SB were significantly higher than those of the other Toingil-type varieties, and the BD was very low, showing pasting properties significantly different from that of the other varieties. This result was similar to the report of Sim et al. (2018) comparing the pasting properties of Tongil-type rice and Japonica-type rice flour for rice porridge and found that the Tongil-type rice varieties had relatively high BD. In the case of Amimyeon with high amylose content, the pasting pattern was markedly different from other rice varieties.
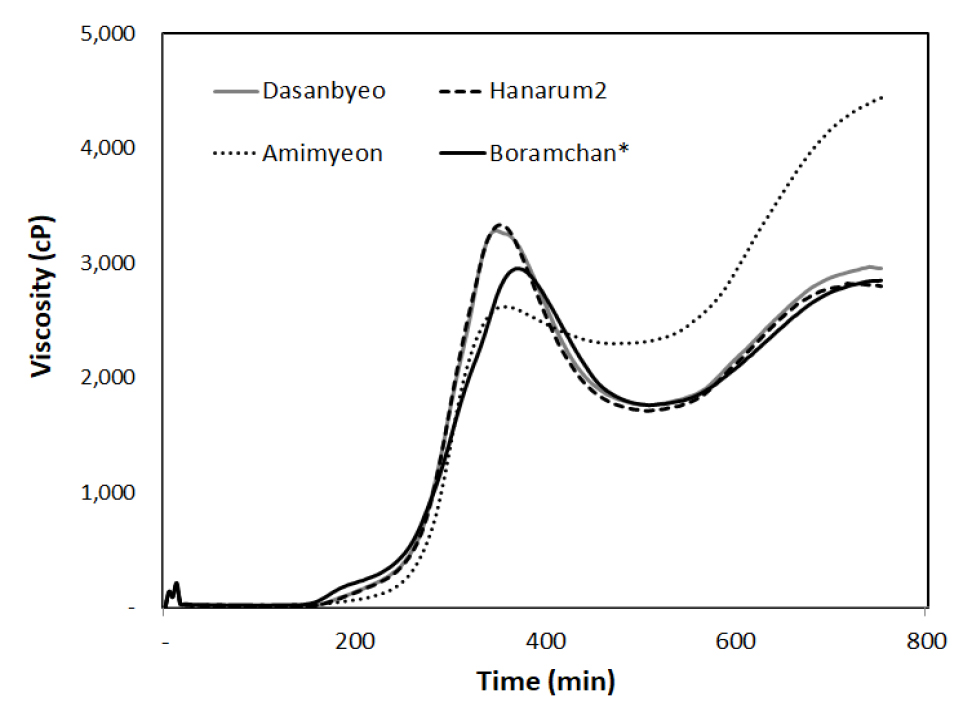
Table 4.
RVA pasting parameters of Tongil-type rice varieties.
| Variety |
Pasting time (min) |
Pasting temp. (°C) | Viscosity (cP) | ||||
| PV†† | HPV | CPV | BD | SB | |||
| Dasanbyeo | 4.0 ± 0.08a† | 85.1 ± 0.97ab | 3,285 ± 91.9a | 1,760 ± 47.7b | 2,953 ± 46b | 1,525 ± 51b | -332 ± 69c |
| Hanarum2 | 3.9 ± 0.00b | 84.5 ± 0.00b | 3,368 ± 23.7a | 1,711 ± 93.5b | 2,798 ± 118b | 1,657 ± 71a | -571 ± 96d |
| Amimyeon | 4.1 ± 0.04a | 85.9 ± 0.49a | 2,621 ± 35.5c | 2,296 ± 24.7a | 4,439 ± 99a | 325 ± 11d | 1,818 ± 115a |
| Boramchan††† | 3.5 ± 0.64c | 84.2 ± 1.63b | 2,961 ± 8.6b | 1,760 ± 64.8b | 2,849 ± 60b | 1,201 ± 56c | -112 ± 52b |
†All data represent the mean ± SD of three measurements. Different letters in the same column of each variety indicate significant differences among the samples according to Duncan’s multiple range test (P < 0.05).
††PV, HPV, and CPV are the peak viscosity, hot paste viscosity, and cool paste viscosity, respectively. BD and SB are the breakdown and setback, respectively. BD is equal to the difference between PV and HPV, consistency is equal to the difference between the final viscosity and HPV, and SB is equal to the difference between the CPV, and PV.
Thermal properties
Differential scanning calorimetry (DSC) was used for real-time heat flow analysis to determine how transplanting time affected the thermal properties of three different Tongil-type rice varieties (Fig. 3, and Table 5). The To, and Tp of gelatinization of rice flour of Amimyeon were lower than those of the other tested varieties. In addition, the gelatinization temperature, measured by DSC and BD in RVA were low in Amimyeon. DSC is a thermal analysis that can thermodynamically describe the gelatinization process by measuring enthalpy from an endothermic reaction of gelatinization pasting because it can measure heat absorption or release by chemical reactions during phase changes, such as melting (Lee et al., 1993). In the case of Dasanbyeo the lowest gelatinization enthalpy was shown among tested varieties, indicating that lower gelatinization enthalpy required less energy to disrupt (i.e., melt) starch crystallinity.
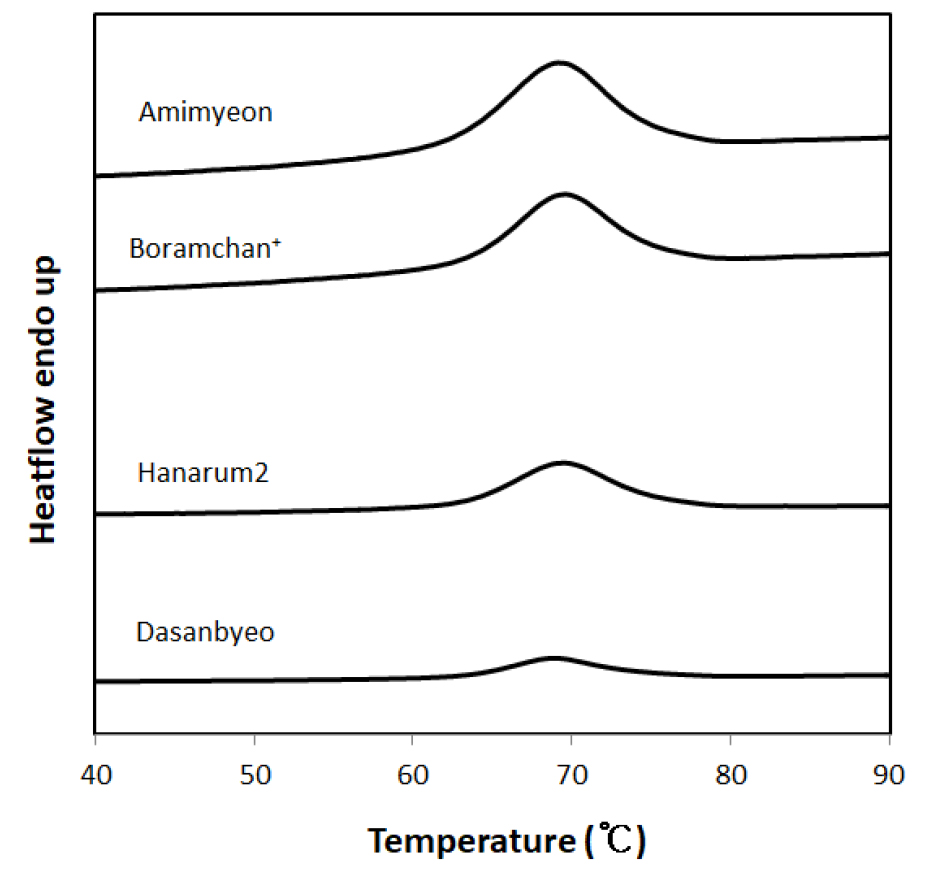
Table 5.
DSC parameters of Tongil-type rice varieties.
| Variety | To† (°C) | Tp (°C) | Tc (°C) | ⊿T (Tc-To) | ⊿H (J/g) |
| Dasanbyeo | 63.2 ± 0.14†† | 68.4 ± 0.42 | 73.8 ± 0.99 | 10.6 ± 1.06 | 5.7 ± 2.94 |
| Hanarum2 | 62.8 ± 0.14 | 69.8 ± 0.32 | 75.3 ± 0.48 | 12.4 ± 0.34 | 8.7 ± 0.91 |
| Amimyeon | 59.7 ± 0.07 | 66.9 ± 0.23 | 73.3 ± 0.56 | 13.6 ± 0.53 | 7.1 ± 0.35 |
| Boramchan††† | 63.5 ± 0.33 | 69.3 ± 0.02 | 75.0 ± 0.38 | 11.6 ± 0.71 | 8.0 ± 1.39 |
Correlation between amylose content and pasting properties
The amylose content in milled rice had a significant effect on rice starch characteristics (Table 6). The correlation between amylose content and pasting properties of Tongil-type rice varieties was analyzed. The amylose content showed a high positive correlation with pasting time (PTi), HPV, and SB and a negative correlation with PV and BD. The amylose content also showed a negative correlation with the starch granule size with a correlation coefficient of 0.53. It is known that the higher the amylose content of rice flour, the lower the PV and the higher the SB (Rho & Ahn, 1989; Yoon et al., 2011).
Table 6.
Correlation between rice starch properties and amylose content of three Tongil-type rice varieties.
|
Starch granule size (D50) | RVA pasting parameters | ||||||
| PTi† | PTe | PV | HPV | CPV | BD | SB | |
| -0.53*†† | 0.86* | 0.90** | -0.99** | 1.00* | 0.99 | -1.00* | 0.99 |
CONCLUSION
Tongil-type rice varieties had higher protein and lower amylose content than Japonica-type rice variety. except Amimyeon (Milyang355). Amimyeon had higher protein content than the other varieties, and the amylose content was particularly high at 39.2%. Dasanbyeo and Hanarum2 have higher PV and lower SB than Japonica-type rice variety. These are properties that adversely affect the taste of Japonica-type rice variety (Choi et al., 2006). In the case of Amimyeon with high amylose content, the pasting pattern was markedly different from other rice varieties. Tongil-type rice varieties that have high yields and high amylose content are recognized as proper processing varieties due to their suitable starch properties.
