

INTRODUCTION
MATERIALS AND METHODS
Experimental setup
Nitrogen (N) treatment
Nitrogen use efficiency (NUE)
Soluble sugar and starch analysis
RNA extraction and quantitative real-time PCR analysis
Statistical analysis
RESULTS AND DISCUSSION
Growth responses to different N fertilizations
Nitrogen use efficiency
Carbohydrate metabolism
Principal component analysis (PCA)
CONCLUSIONS
INTRODUCTION
Increasing global temperature by climate change has been primarily attributed to greenhouse gas (GHG) emissions from various anthropogenic activities (Oertel et al., 2016). Of those, the agriculture contributes approximately 12 % of total global GHG emissions including carbon dioxide (CO2), methane (CH4), and nitrous oxide (N2O) (Linquist et al., 2012). In particular, N₂O is a potent GHG predominantly emitted from paddy fields due to excessive nitrogen (N) fertilization and inappropriate N managements.
Rice (Oryza sativa L.) is a staple crop supporting nearly half of the global population, accounting for more than 21 % of human caloric intake worldwide (Mohidem et al., 2022). In general, N fertilization is largely responsible for grain yield, and rice yield is dominantly determined by panicle development and grain filling quality. Sucrose is the principal carbohydrate translocated from the source (active leaves) to the sink (grain) via the phloem, following either the symplastic or apoplastic pathway, during grain filling stage (Smith et al., 2018). Sugars Will Eventually be Exported Transporter (SWEET) gene family mediates the efflux of sucrose into the apoplast, while sucrose transporter (SUT) genes actively import sucrose into companion cells for efficient phloem loading (Chen, 2014). Efficient nitrogen management is essential not only for optimizing crop productivity but also for minimizing environmental vulnerability due to fertilizer use. Thus, improving nitrogen use efficiency (NUE) in rice is important to reduce CH₄ and N₂O emissions without yield loss (Banger et al., 2012).
Therefore, this study evaluated carbohydrate translocation and NUE under two modified nitrogen application regimes compared to the conventional level, focusing on the early stages of heading through to harvest. Based on these findings, the effects of nitrogen application on carbohydrate assimilation in leaves and stems, sugar export from leaves, and starch accumulation in panicles were investigated. The ultimate aim is to improve NUE through optimized nitrogen fertilization.
MATERIALS AND METHODS
Experimental setup
The experiment was carried out in a greenhouse at Chungbuk National University, Cheongju, Republic of Korea in 2024. Seeds of Ungwang (Oryza sativa L.), early–maturing rice variety, were employed in an incubator for 48 hours for uniform germination, and the selected seedlings (3– to 4–leaf stage) were transplanted into containers. Soil (2 kg) was packed into a Wagner pot (diameter 16 cm, height 8.7 cm, soil volume ≈ 1.45 L, surface area 1/5000 a ≈ 0.02 m²) at a bulk density of 1.25 g cm-3. All treatments were transplanted on April 9 and reached heading on May 30. The grain–filling period was 42 days for all treatments. During this period, greenhouse temperature (19–33°C) and relative humidity (67 %) were consistent across treatments. The experimental soil was classified as a sandy loam, with a pH of 5.6 (1:5, soil:water) and an electrical conductivity (EC) of 0.3 dS/m (1:5). The soil contained 8.3 g kg-1 of organic matter, 22 mg kg-1 of available P₂O₅, 0.2 cmolc kg-1 of exchangeable potassium (K), 3.8 cmolc kg-1 of exchangeable calcium (Ca), and 1.2 cmolc kg-1 of exchangeable magnesium (Mg).
Nitrogen (N) treatment
Standard fertilization rate by Rural Development Administration (RDA) recommendation was 90 kg N, 45 kg P2O5 and 57 kg K2O ha-1 for rice cultivation. N (Urea) application was split with three times as a rate of 50 (basal), 30 (tillering) and 20% (panicle initiation). P2O5 (Fused superphosphate) was fully applied before transplanting, and K2O (potassium chloride) was split with 70 % at basal and 30 % at panicle initiation. Rice plants were employed in different N fertilizations; 50 (basal) – 30 (tillering) – 20 (panicle initiation) as N1 (Conventional dose), 0 (basal) – 30 (tillering) – 20 (panicle initiation) as N2 (Top- dressing only), and 50 (basal) – 0 (tillering) – 0 (panicle initiation) as N3 (Basal only). Water and other cultivation management were followed by the standard manual of National Institute of Crop Science (NICS).
Nitrogen use efficiency (NUE)
Rice plants were taken at the harvest stage and separated into Stem and leaf sheath and grains. The samples were oven–dried at 80°C for 72 hours and total N content was analyzed using a C/N analyzer (VarioMax CN Analyzer, Elementar, Germany). Based on total N content and biomass (dry weight), the selected NUE indices were calculated with following equations (Shaobing et al., 2002).
N uptake (g) = Dry biomass of Stem and leaf sheath (g) × N concentration of shoot (g) + Dry biomass of grain (g) × N content of grain (g)
Nitrogen use efficiency (NUE) = Total biomass (shoot + grain) (g)/N applied (g)
Nitrogen uptake efficiency (NUpE) = N uptake (g)/N applied (g)
Nitrogen utilization efficiency (NUtE) = Total biomass (shoot + grain) (g)/ N uptake (g)
Nitrogen use efficiency of grain (gNUE) = Grain biomass (g) /Applied N (g)
Nitrogen harvest index (NHI, %) = grain N uptake (g)/ (grain + stem and leaf sheath) N uptake (g) × 100
Soluble sugar and starch analysis
Soluble sugar and starch were measured from shoots and grains taken at the heading, 10 days after heading (DAH) and 20 DAH (Roe, 1955). Dried samples were ground prior to weighing. And powdered samples (0.2 g DW) were extracted with 10 mL of 80 % ethanol and evaporated. Residues were dissolved in distilled water, mixed with 2 volumes of 0.2 % anthrone in a concentrated H2SO4, and carbohydrate content was estimated spectrophotometrically at 630 nm (UV–1900i, SHIMADZU, Japan). Glucose was used as a standard.
RNA extraction and quantitative real-time PCR analysis
Total RNA extraction using TRIzol reagent (Invitrogen, Carlsbad, CA) according to the manufacturer’s instructions was extracted from leaf blades and roots of rice treated with different form and rate of N fertilization at the heading time. The purity and concentration of the extracted RNA were estimated using NanoDrop (Thermo Fisher Scientific, Madison, WI, USA), and checked on 1.0 % agarose gel. Total RNA (1 μg) and RT PreMix Kit (iNtRON Biotechnology, Inc., Seongnam, Korea) with Oligo (dT) primers were used to synthesize first-strand cDNA using the following PCR conditions; 60 min at 45°C to cDNA synthesis and 5 min at 95°C to Rtase inactivation step. Quantitative real-time PCR was performed by using a Real- Time PCR machine (CFX Opus 96, Bio-Rad, Hercules, CA, USA) with technical triplicates with the manufacturer’s instructions. The reaction mixture consisted of 1 μL of cDNA template, 2 μL each of 10 mM forward and reverse primer (Table 1), and 5 μL SYBR Green Q Master mix (Labopass, Cosmo Genetech, Seoul, South Korea). The PCR conditions consisted of pre- denaturation step at 95°C for 3 min, followed by 40 cycles of denaturation at 95 for 15 s, annealing temperature of each primer (Table 1) for 15 s, and elongation (72°C, 15 s). This step was followed by a melting curve, ranging from 65 to 95°C at a heating rate of 0.5°C/s. A quantification method (2–∆∆Ct) was used (Livak & Schmittgen, 2001) and the variation in expression was estimated using triplicate for each cDNA sample. The rice actin gene was used as a reference in the qRT-PCR. Primer sequences used for qRT-PCR were designed by Primer 3 software (Rozen & Skaletsky, 2000).
Table 1.
Primer sequences of target genes (OsSWEET11 and OsSUT1) used for qRT–PCR analysis.
Statistical analysis
Data were analyzed using one–way ANOVA, and, if p < 0.05, were subjected to Tukey’s HSD test to detect significant differences among the means (R Studio VER. 4.2.2). Principal component analysis (PCA) was performed to assess the relationship between NUE and NSC.
RESULTS AND DISCUSSION
Growth responses to different N fertilizations
Plant height, grain number and dry weight of rice plants grown under different N fertilizations were measured at the heading, 10 DAH and 20 DAH (Fig. 1). Plant height was significantly decreased in T3 (basal only), on the other hand, T2 (top dressing only) was entirely responsible for the reduction in grain number, with indicating 55% less compared to N1 and N3 (Fig. 1A). This result was in line with previous studies (Feng et al., 2024; Wu et al., 2024), which demonstrated that the amount and time of nitrogen fertilization directly contributed to tiller development and stem elongation. Different N fertilizations clearly affected the biomass of panicles (Fig. 1B) and Stem and leaf sheath (Fig. 1C). Biomass of panicles from 20 DAH showed a continuous decrease in 52% in N2 and 35% in N3 compared to N1, respectively, by contrast, Stem and leaf sheath biomass was significantly reduced in N2. Overall, total plant biomass (panicle + stem and leaf sheath) resulted in an evident difference among treatment groups at harvest stage, and N2 (top dressing only) negatively contributed to biomass production. Many studies reported that nitrogen availability during the grain-filling stage played a crucial role in panicle development and final yield (Alcantara et al., 1996; Kamiji et al., 2011; Singh et al., 2011). Therefore, our result suggests that basal application might be an important practice to determine not only productive panicles but also biomass production.
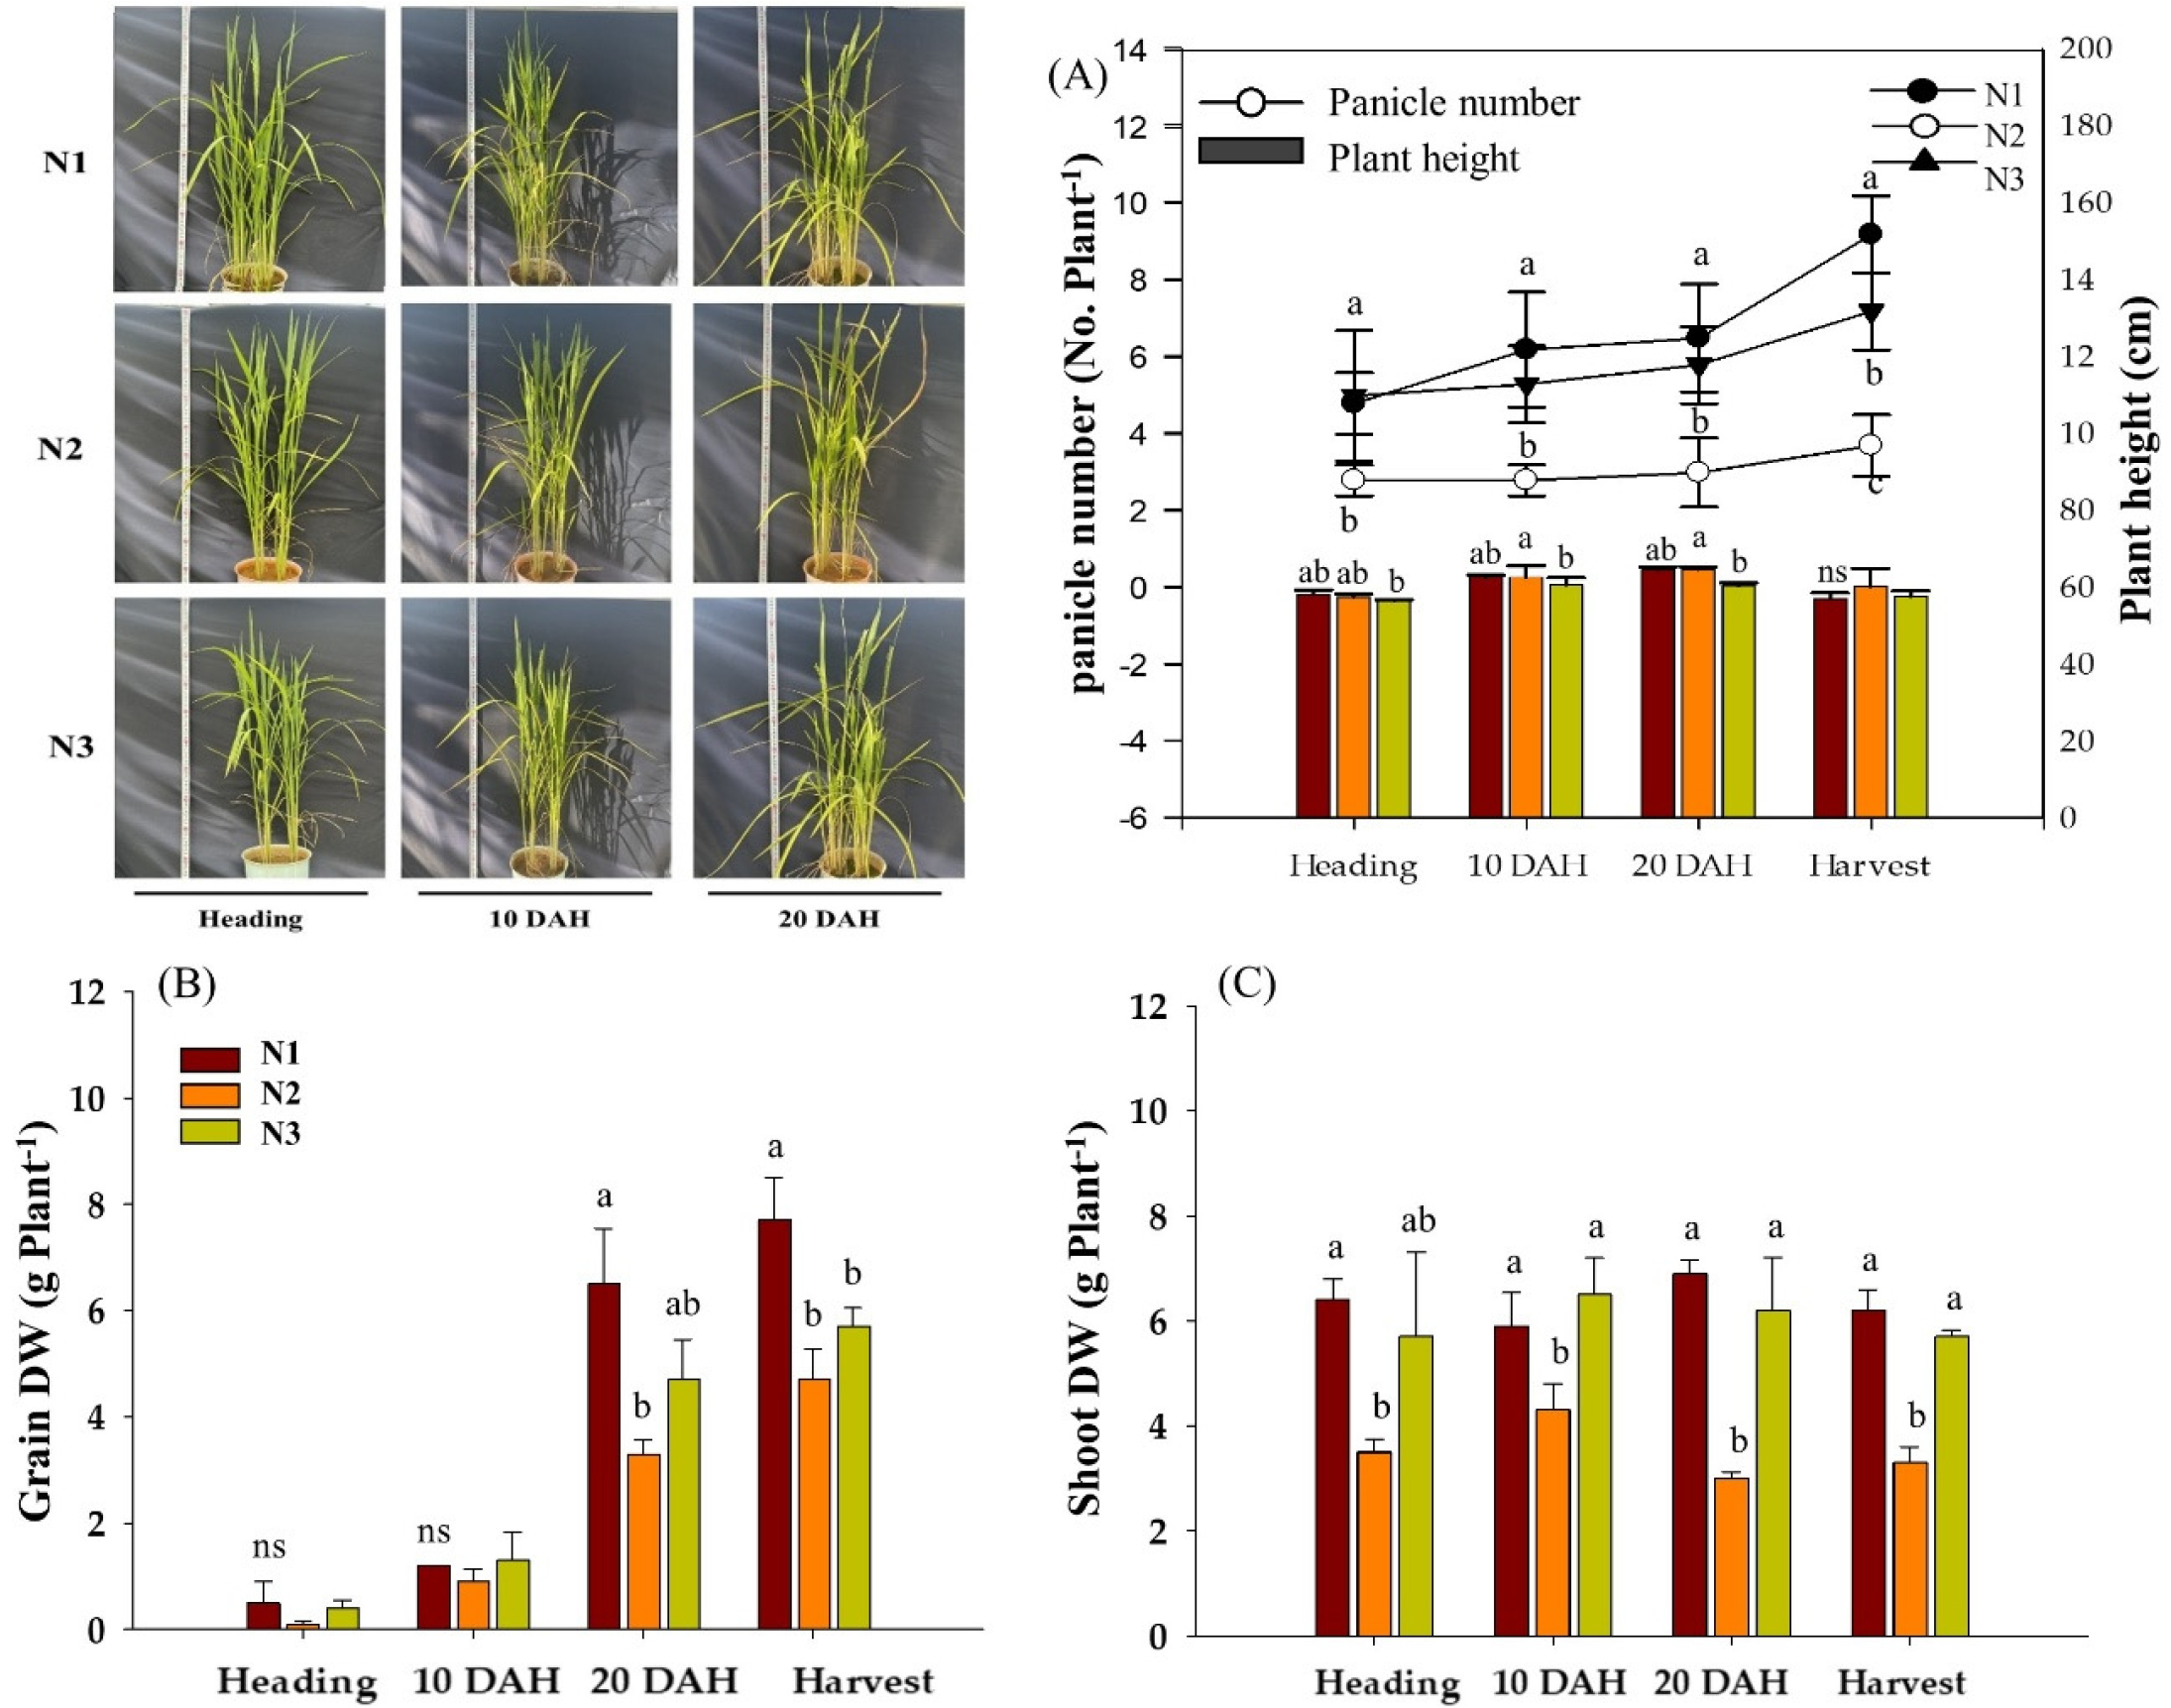
Fig. 1.
Effects of different nitrogen application ratios on tiller number and plant height (A), grain biomass (B), and shoot biomass (C) of rice at heading, 10 days after heading (DAH), 20 DAH, and harvest. N1 (conventional, 50–30–20%), N2 (top–dressing only, 0–30–20%) and N3 (basal only, 50–0–0%). Bars and letters represent the mean (n = 3) and significant differences based on Tukey’s HSD test (p < 0.05), respectively.
Nitrogen use efficiency
Changes in N uptake associated with different N fertilizations had a great impact on rice growth and development. The N accumulation in grain highest in N1 treatment (1.10%) and followed by N2 and N3, while the difference in shoot was not detected (Table 2). N3 resulted in a significantly higher NUE indices, indicating 0.4±0.02 g g-1 for NUpE, 99.4±0.80 g g-1 for NUtE, 26.1±1.59 g g-1 for gNUE, and 52.1±1.70 g g-1 for NUE. By contrast, the nitrogen harvest index (NHI) showed greatest value in N2 (74.7%). Nan et al. (2024) and Tian et al. (2023) documented that a marked enhancement of NUE under limited N application might be attributed to N availability during the critical period like active tillering stage. N2 (top dressing only) treatment, as a result of highest NHI, promoted N remobilization from shoot to grain. This result showed that NUE and NHI in rice plants depended on the fertilization application rate. However, compared with N1, significant increases were observed in NUE components, the total biomass decreased by 42% and 18% in N2 and N3, respectively. This indicates the challenge of maintaining yield while improving nitrogen use efficiency. In contrast, the N3 (basal only) treatment mainly contributed to biomass production, including productive tillers, resulting in a smaller reduction in total biomass. Therefore, the N3 treatment demonstrated that the increase in NUE components and the reduction in yield were less dependent compared with N2. The relatively low soil organic matter content (8.3 g kg-1) may have influenced yield and NUE in the absence of basal fertilization, highlighting the need for further studies across diverse soil fertility conditions.
Table 2.
Effects of nitrogen fertilization strategies on tissue nitrogen content, nitrogen use efficiency (NUE) indices, and nitrogen harvest index (NHI) in rice at harvest.
Carbohydrate metabolism
Changes in an abundance of soluble sugar and starch exhibited similar pattern with a gradual decrease in shoot while a constant increase in grain (Fig. 2). The level of soluble sugar and starch in shoot showed the highest at heading stage, 225 ~ 292 mg g-1 and 17 ~ 28 mg g-1, respectively, and was consistently decreased until harvest, indicating 70 ~ 143 mg g-1 and 1 ~ 6 mg g-1, respectively. The level of soluble sugar and starch in grain was the opposite pattern, representing 145 ~ 205 mg g-1 and 1 ~ 3 mg g-1 at heading, respectively, and was consistently increased until harvest, indicating 263 ~ 297 mg g-1 and 315 ~ 380 mg g-1, respectively. Of treatment groups, N3 represented significantly higher compared to N1 and N2 treatment groups. On the other hand, those in grain revealed gradual (soluble sugar) and sharp (starch) increase from heading to harvest. In particular, starch was substantially accumulated between 10 DAH and 20 DAH, and N–reduced fertilization (N2 and N3) showed relatively greater abundance in soluble sugar and starch. This result aligns with previous studies in crops such as rice and wheat, represented that low N conditions promoted higher accumulation of soluble sugars and starch compared to those grown under high N (Gebbing & Schnyder, 1999; Ruuska et al., 2008). The levels of relative expression of OsSWEET11 and OsSUT1 were measured in grain, flag leaf blade, lower leaf blade (third lower leaf from flag) and lower leaf sheath (Fig. 3). Both genes in N1–treated grain peaked early at heading while at 20 DAH, expression levels in N2 and N3 treatments peaked later and became higher than N1, indicating a delayed induction under reduced N supply (Table S5). In flag leaves, N2 and N3 showed a delayed peak of OsSUT1 expression at 20 DAH, whereas OsSWEET11 was strongly expressed with an early peak at heading. In contrast, in the lower leaf blade and sheath, N1 expression tended to occur earlier than N2 and N3. Similar observations have been reported in field studies, where limited nitrogen supply led to upregulation or shifted peak expression of OsSWEET11 and enhanced phloem loading of sucrose (Huang et al., 2021; G. Li et al., 2022a). Previous research has shown that OsSUT and OsSWEET protein levels tend to increase under low nitrogen availability in flag leaves and stems (Li et al., 2022b; Ma et al., 2017; Xu et al., 2018; Zhang et al., 2004), while OsSUT1 is relatively insensitive to nitrogen levels (Ning et al., 2018). Interestingly, limited N fertilizations tended to promote the translocation of soluble sugar and starch from shoot to grain. In particularly, basal only N fertilization (N3) retained abundant soluble sugar and starch, suggesting active N remobilization and utilization. Despite receiving the same amount of N fertilization in N2 and N3, OsSWEET11 expression in N2–fed leaf blade and sheath peaked later and reached higher levels, and it is suggested that the fertilization ratio rather than the amount of nitrogen supplied can significantly influence carbohydrate transport with regulating related genes.
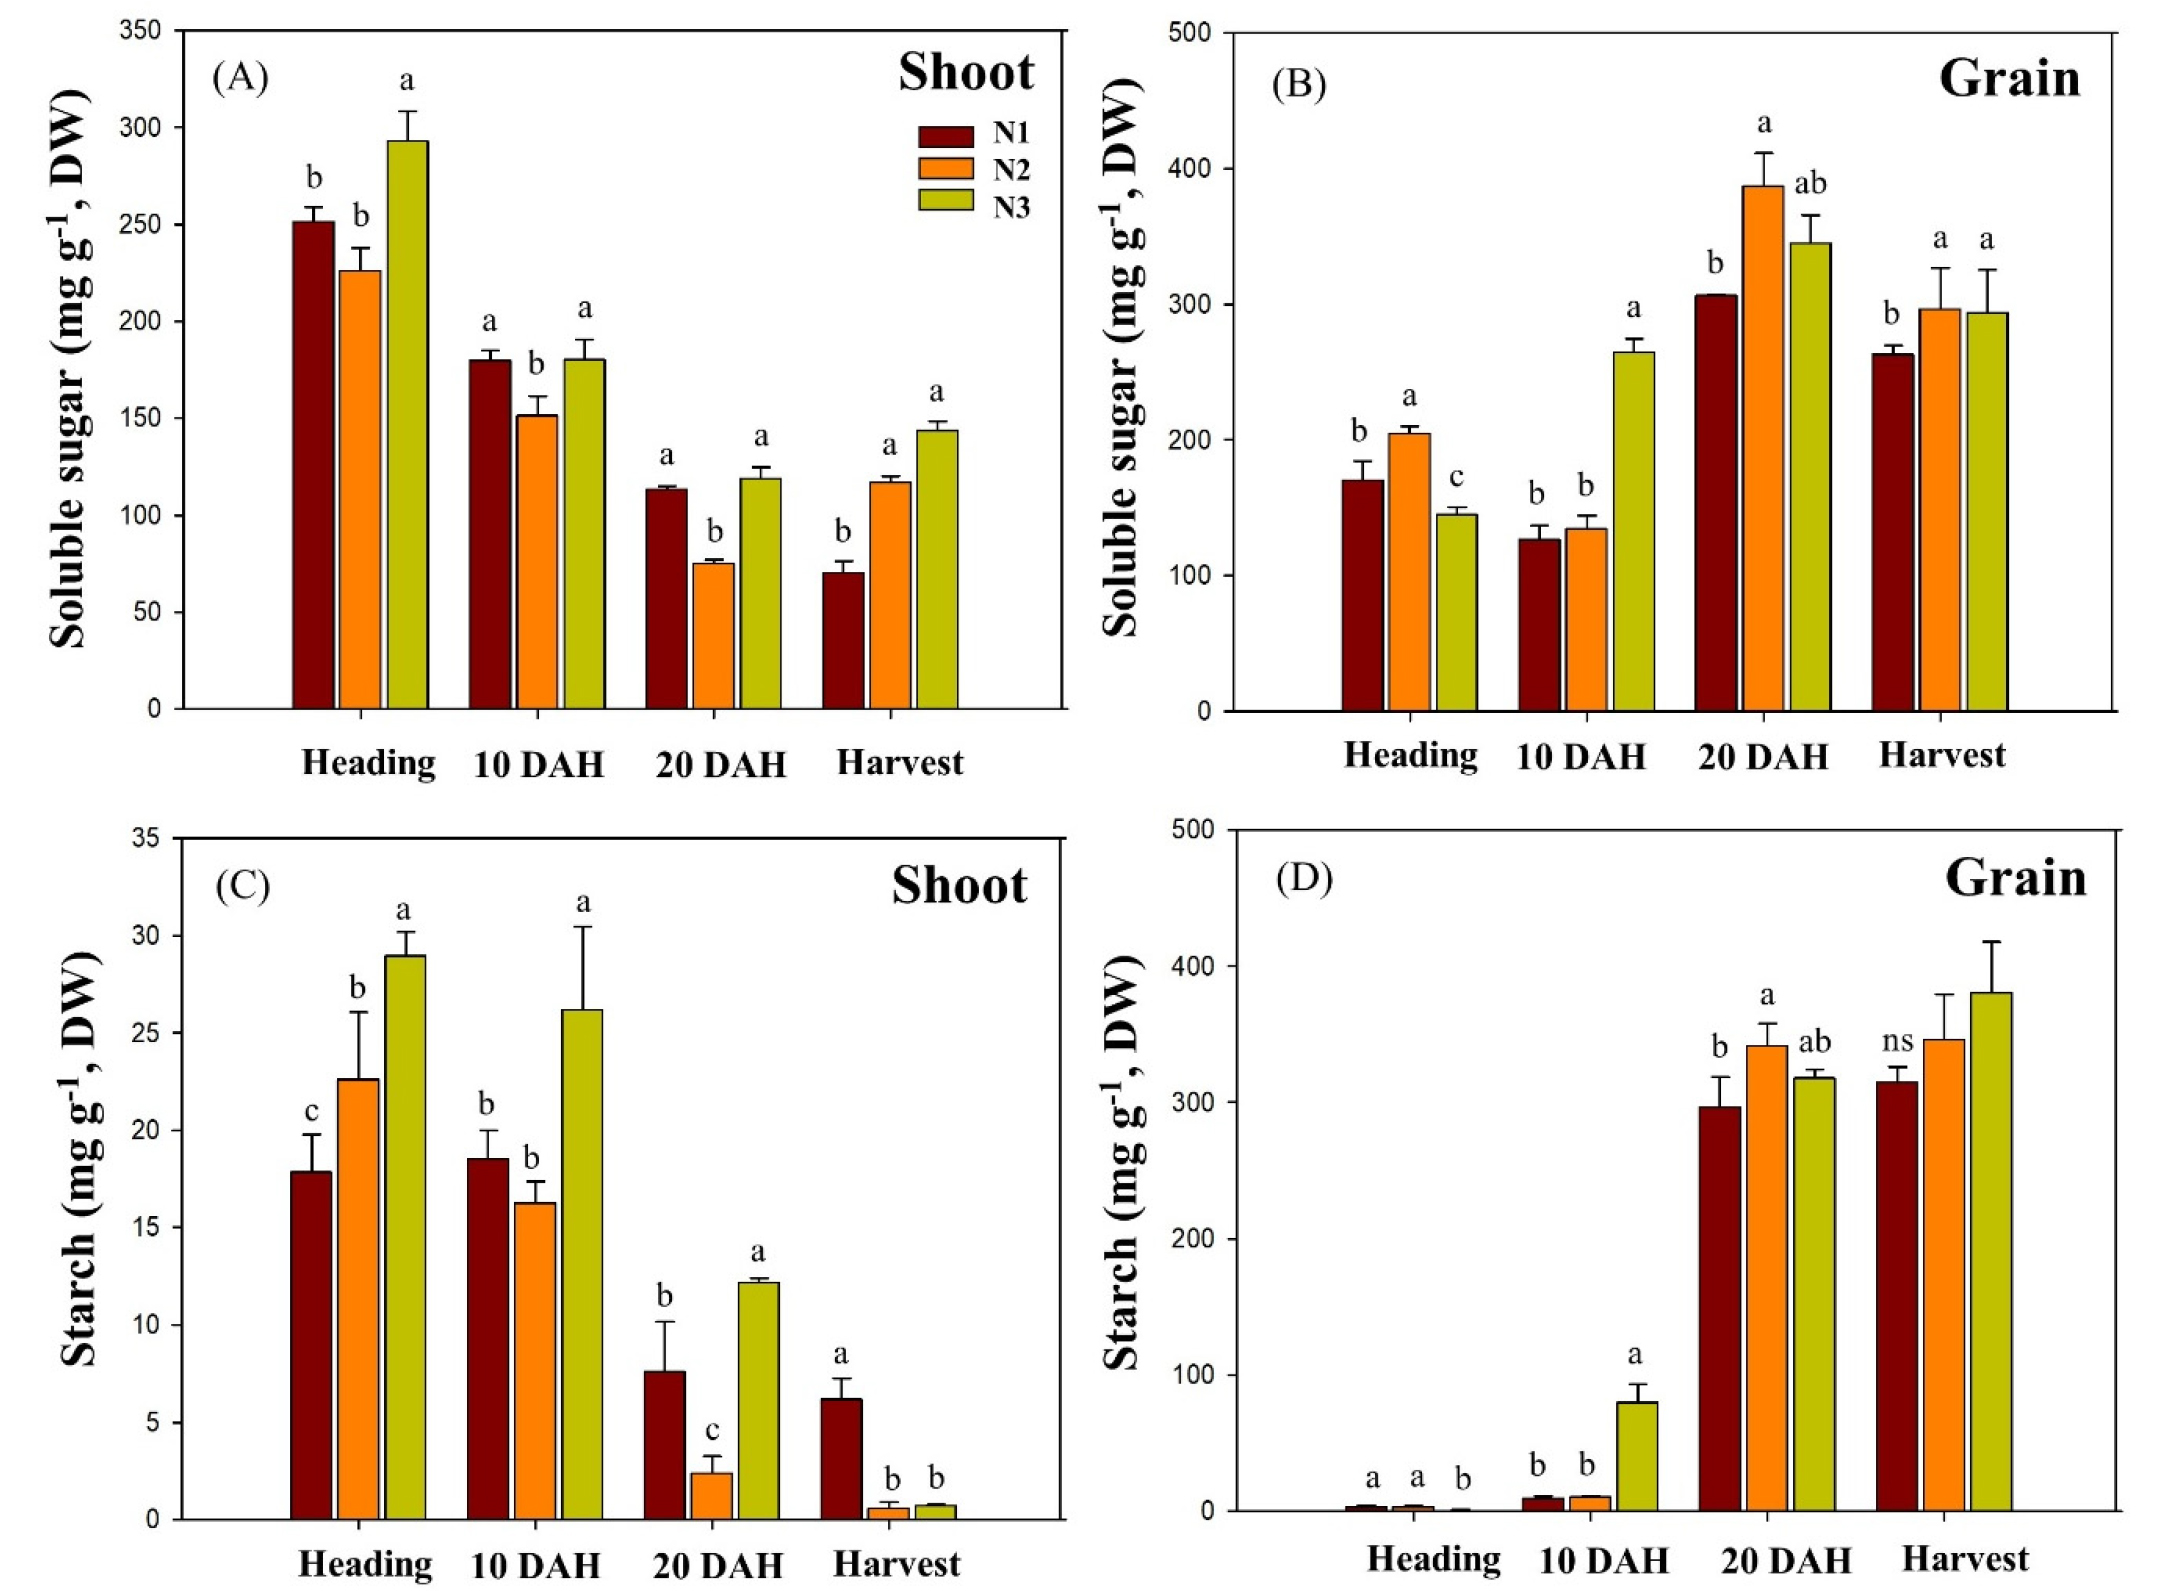
Fig. 2.
Soluble sugar content in the stem and leaf sheath (A) and panicle (B) and starch content in the stem and leaf sheath (C) and panicle (D) measured at four stages from heading to harvest. N1 (conventional, 50–30–20%), N2 (top–dressing only, 0–30–20%) and N3 (basal only, 50–0–0%). Bars and letters represent the mean (n = 3) and significant differences based on Tukey’s HSD test (p < 0.05), respectively.
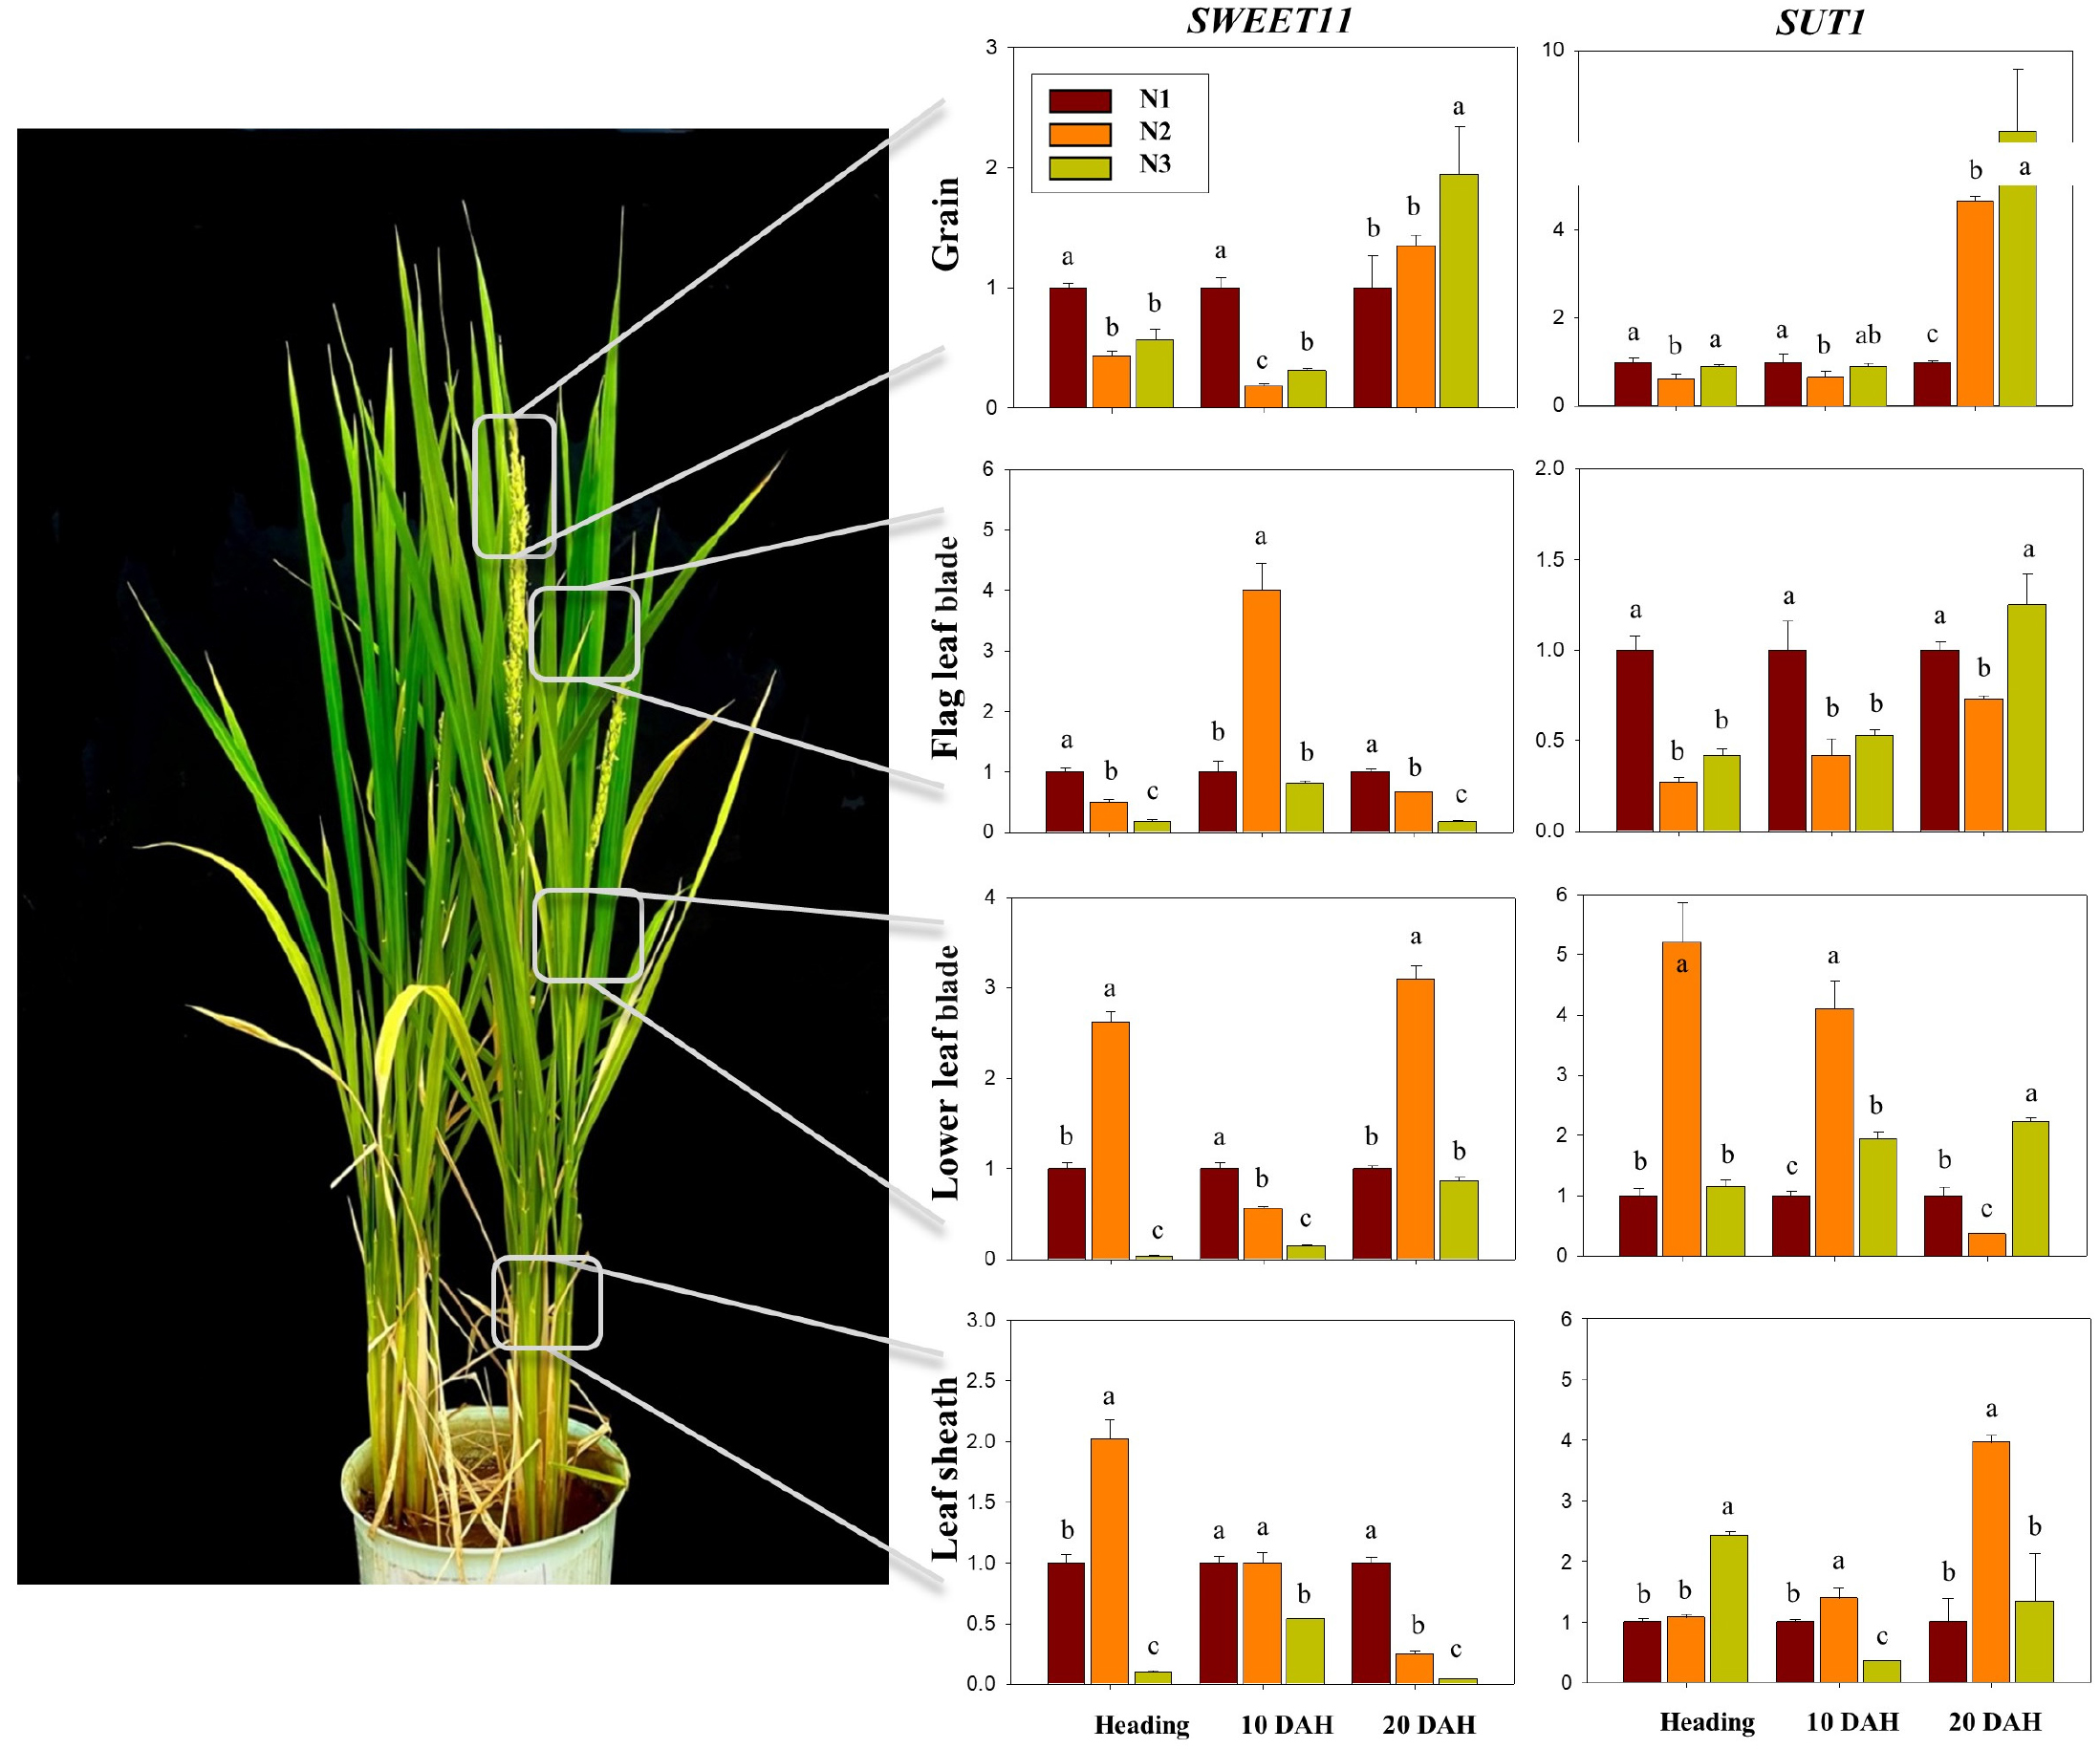
Fig. 3.
Relative expression levels of the sucrose transporter genes OsSWEET11 and OsSUT1 in the upper and lower leaf blades, leaf sheath, and grain of rice from heading to 20 days after heading (DAH) under different nitrogen application ratios. N1 (conventional, 50–30–20%), N2 (top–dressing only, 0–30–20%) and N3 (basal only, 50–0–0%). Bars and letters represent the mean (n = 3) and significant differences based on Tukey’s HSD test (p < 0.05), respectively.
Principal component analysis (PCA)
Principal component analysis (PCA) was performed to evaluate the relationship between NUE indicators and carbohydrate traits across nitrogen treatments (Fig. 4). The PCA revealed that NUE–related variables were strongly associated with N3 treatment. In particular, the basal–only nitrogen application (N3) showed a strong correlation with NUtE, suggesting a high internal nitrogen remobilization efficiency in the absence of topdressing at tillering and panicle stages. Conversely, the excluding basal application (N2) was strongly linked to NHI, indicating efficient nitrogen transport from source to sink. This is consistent with the increased expression of sugar transporter genes observed in N2, supporting enhanced source–sink dynamics. Shoot soluble starch (SST) was most strongly associated with N1, while sugar and starch accumulation in the grain (SSG, GST) were strongly linked to N3. These relationships suggest that N3 promoted active translocation of soluble sugars toward the panicle. Additionally, grain soluble sugar (GSG) was highest in N2, reflecting increased carbohydrate retention in the grain due to strengthened source–sink signaling. In conclusion, our findings suggest that an abundance in carbohydrate pools can improve nitrogen utilization, with being well coordinated with traits related to NUE.
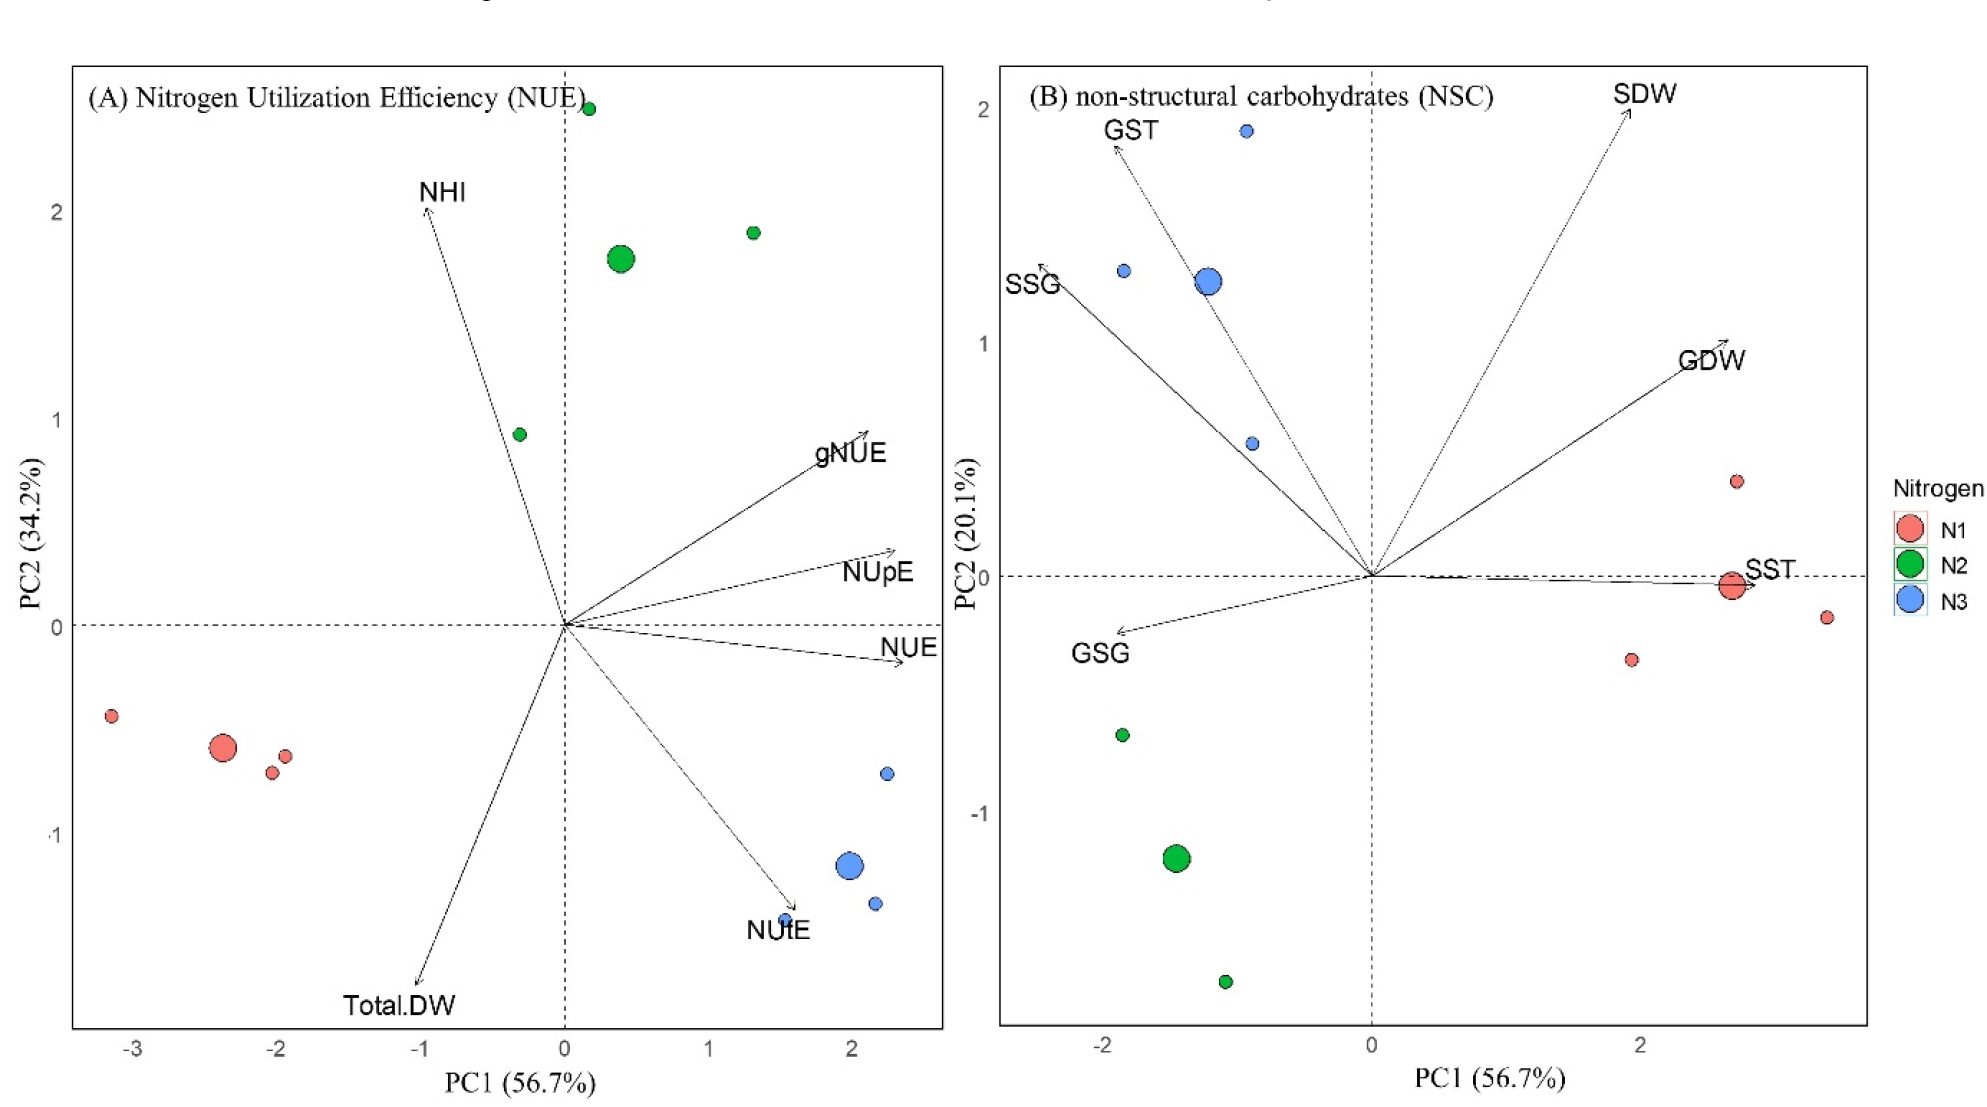
Fig. 4.
Principal component analysis (PCA) illustrating associations between nitrogen use efficiency (NUE) indices (A) and carbohydrate traits (B) in rice under different nitrogen fertilization ratio. SDW: Shoot dry weight; GDW: Grain dry weight; GST: Grain starch; SSG: Shoot soluble sugar; GSG: Grain soluble sugar; SSG: Shoot soluble sugar.
CONCLUSIONS
This study demonstrated that the ratio of nitrogen application significantly influences rice growth, carbohydrate metabolism, and nitrogen use efficiency (NUE). Basal–only fertilization (N3) markedly improved NUE and nitrogen utilization efficiency, accompanied by enhanced soluble sugar and starch accumulation in both shoots and grains. Top–dressing–only fertilization (N2) increased the nitrogen harvest index, reflecting efficient N remobilization to grains. The altered expression dynamics of sucrose transporter genes (OsSWEET11 and OsSUT1) under reduced N inputs, particularly the delayed peaks at later grain–filling stages, indicates strengthened source–sink relationships that facilitate carbohydrate translocation. Principal component analysis clarified strong association between basal–only N fertilization and improved internal N remobilization, as well as grain carbohydrate accumulation. These results suggest that optimizing nitrogen application ratio, with consideration of soil fertility, can enhance NUE and carbohydrate allocation in rice, contributing to more sustainable and productive cultivation systems.
