

INTRODUCTION
MATERIALS AND METHODS
Data acquisition
Annotation
Augmentation
Model architecture
Faster R-CNN framework
ResNet50 backbone
Feature pyramid network
Region proposal network
Network architecture overview
Baseline models
Network evaluation
RESULTS
Implementation details
Visualization of the detection results
Detection errors
Model performance vs baseline models
DISCUSSION
INTRODUCTION
Soybean is the most widely cultivated legume in the world, serving as a crucial source of oil and protein for both human consumption and animal feed (Specht et al., 2014). Improving soybean yield and quality is essential to meet the increasing demands of food security. However, climate change, particularly rising global temperatures, has exacerbated pest outbreaks by disrupting the balance between pest populations and their natural predators (Skendžić et al., 2021). For soybean, pest-related damage, especially leaf herbivory, directly diminishes photosynthetic capacity, adversely affecting crop yield and quality. Therefore, the early and accurate detection of pest damage is crucial for minimizing economic losses.
Traditional field monitoring methods heavily rely on manual visual inspection, a labor-intensive, time-consuming, and often subjective process, particularly in large-scale agricultural settings (Mahlein, 2016). These limitations can lead to inaccurate assessments, resulting in inefficient pest management practices like over-spraying, which increases production costs and harms crop quality (Bieganowski et al., 2021). To overcome these challenges, automated image-based detection systems that utilize deep learning have emerged as promising tools for monitoring plant health. Deep learning-based approaches reduce human intervention, provide rapid diagnostics, and are non- destructive, making them highly suitable for real-time agricultural applications (Khan et al., 2020). When applied for detecting leaf damage, deep learning methods can be broadly categorized based on the type of input data: (1) images containing single leaves and (2) images featuring multiple leaves and complex backgrounds.
For single-leaf detection, Cynthia et al. (2019) applied a faster region-based convolutional neural network (Faster R-CNN) to classify five-leaf diseases, achieving an accuracy of 67.34%, while Ozguven & Adem (2019) modified the Faster R-CNN architecture to detect Cercospora beticola in sugar beet leaves, enhancing the input resolution to boost accuracy to 95.48%. Bari et al. (2021) developed a real-time system for detecting rice leaf diseases using Faster R-CNN, achieving an accuracy of 99.25% across three disease classes. Similarly, Chen et al. (2022) utilized Faster R-CNN, combined with ResNet50 and a feature pyramid network (FPN), to detect cucumber leaf diseases, achieving a mean Average Precision (mAP) of 84.2%.
In contrast, when using images containing multiple leaves with complex backgrounds—featuring overlapping leaves, weeds, soil, and varying lighting conditions—damage detection presents more significant challenges. Zhang et al. (2021) compiled soybean disease images to train a Faster R-CNN model, achieving an mAP of 83.34% on real-world images. Du et al. (2022) utilized drone-captured images to identify Spodoptera frugiperda damage on maize leaves, obtaining an mAP of 43.6%. Despite the practical significance of multi-leaf detection for field applications, fewer studies have focused on it due to challenges in dataset creation, target–background separation, and occlusion issues, particularly daunting issues for broad–leaf crops like soybeans.
This study addresses the challenges of detecting pest-induced feeding damage on soybean leaves in actual field conditions by developing a model based on the Faster R-CNN architecture. We used ResNet50 as the backbone for feature extraction, integrating it with an FPN for multi-scale feature fusion. While one-stage detectors, such as the YOLO (You Only Look Once) algorithm, offer faster inference times, two-stage detectors like Faster R-CNN generally provide greater accuracy, particularly in complex situations with subtle inter-class variations (Bharati & Pramanik, 2020; Zhang et al., 2021). By harnessing these benefits, our goal is to improve the accuracy of pest damage detection in soybean fields, thereby contributing to more effective pest management.
MATERIALS AND METHODS
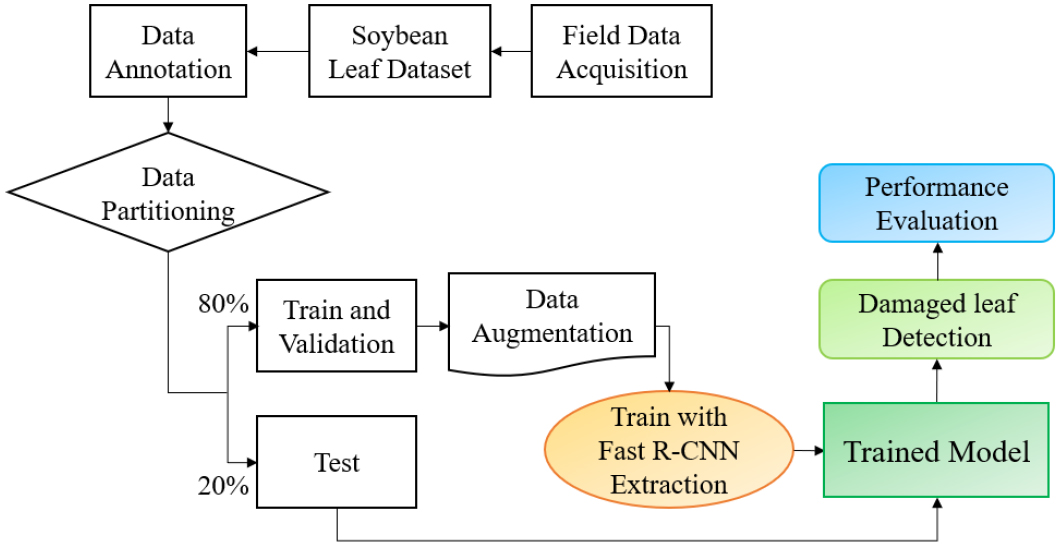
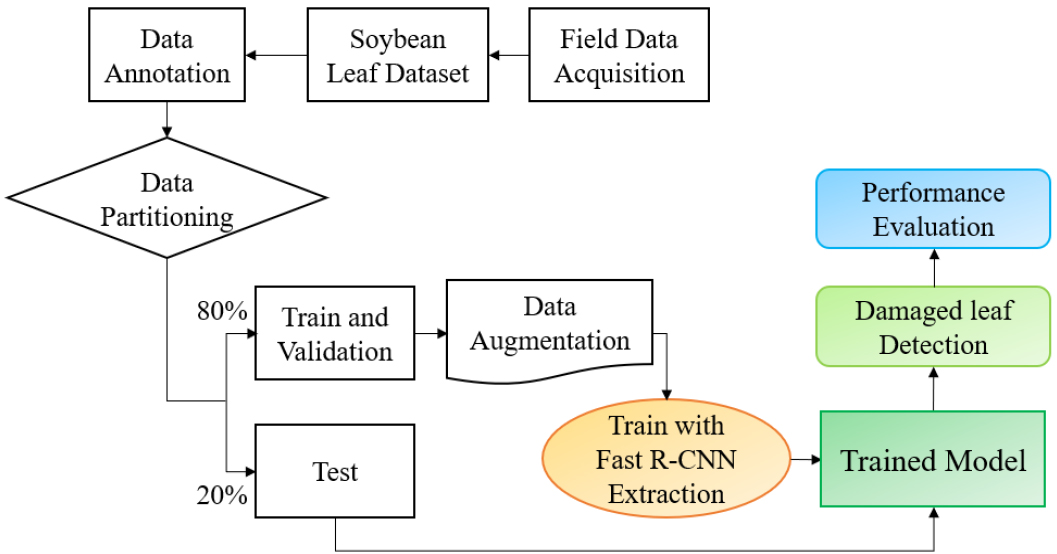
This study aimed to detect pest-induced feeding damage on soybean leaves using a Faster R-CNN. The overall workflow is illustrated in Fig. 1. It comprises the four main tasks: (1) compiling the soybean leaf dataset (SLD) from Chonnam National University (CNU) and the National Institute of Crop Science (NICS); (2) manually annotating the images and dividing the dataset into training and testing subsets in an 8:2 ratio; (3) applying data augmentation techniques to enhance dataset diversity; and (4) training the Faster R-CNN model using the training dataset and evaluating its performance with the test dataset.
Data acquisition
The SLD consisted of images collected from soybean fields at CNU and NICS, which included plants from the ‘Daepung’ and ‘Pungsannamul’ cultivars in 2021 and 2022 (Fig. 2). This dataset featured images captured under diverse environmental conditions, including various weather scenarios (sunny, cloudy, rainy), times of day, and locations (Table 1). The images showcased numerous soybean leaves exhibiting a range of damage levels, along with background elements, such as weeds and soil.

Table 1.
Soybean leaf dataset acquisition.
|
Date (MM/DD/YY) | Site† | Weather condition | Number of images |
| 07/27/21 | CNU | Sunny | 200 |
| 08/31/22 | CNU | Sunny | 365 |
| 09/01/22 | NICS | Cloudy | 140 |
| 09/04/22 | CNU | Rainy | 90 |
Leaf damage was categorized into three levels according to the extent of visible feeding damage: (1) healthy = under 5% damage, (2) partially damaged = 5–30% damage, and (3) severely damaged = over 30% damage. Fig. 3 displays representative images for each damage category.
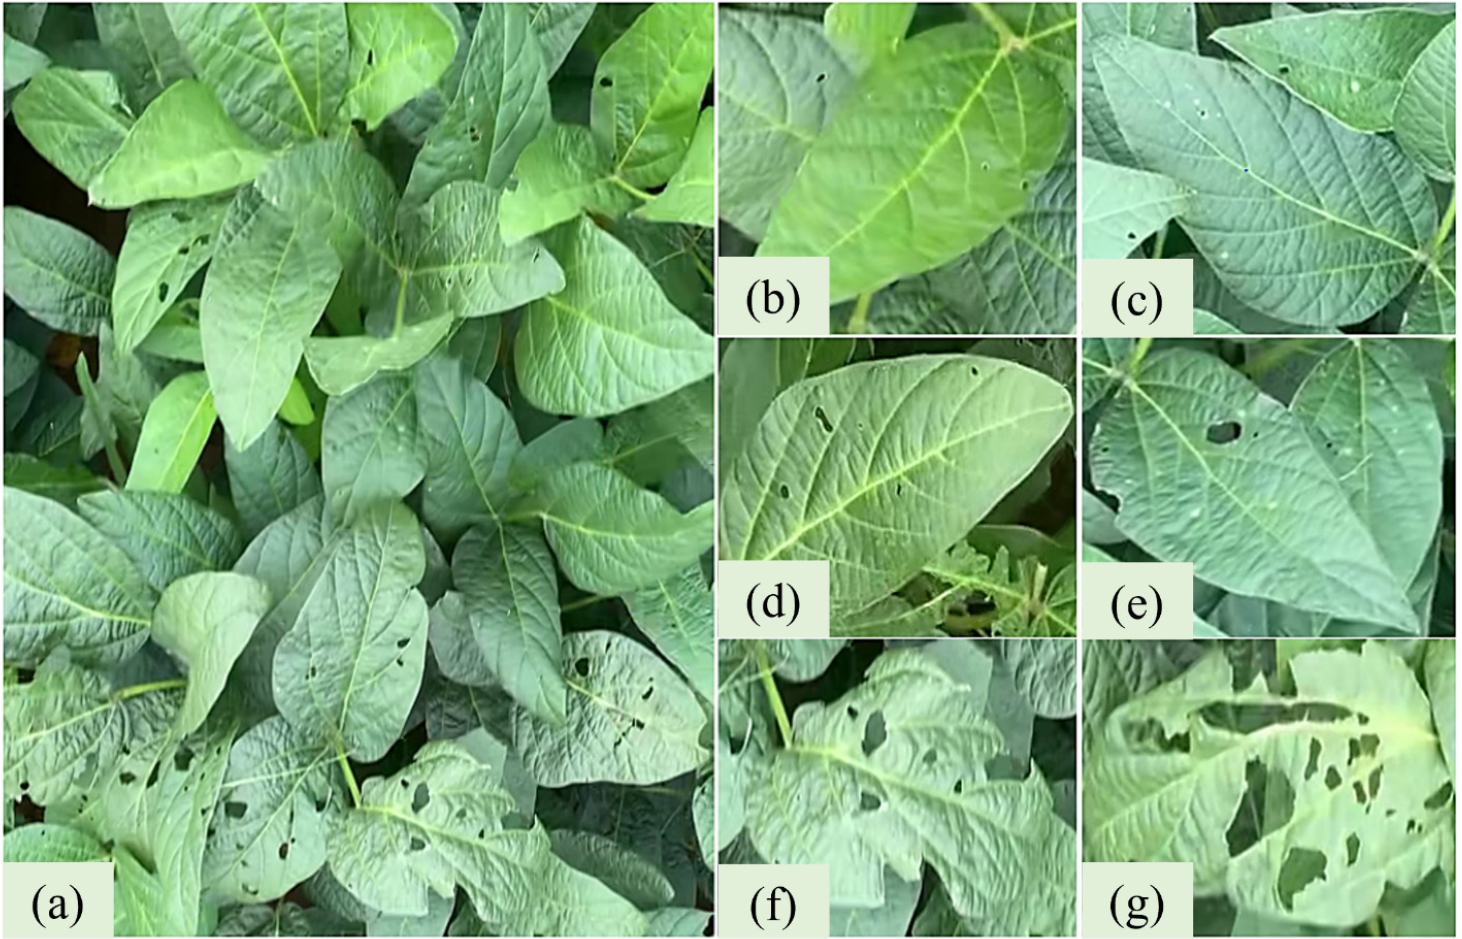
Fig. 3.
Representative images illustrating the categorization of soybean leaf damage severity. Original image of a soybean canopy (a); healthy leaves, with < 5% damage (b and c); moderately damaged leaves, with damage covering 5%–30% of the leaf area (d and e); severely damaged leaves, with damage covering > 30% of the leaf (f and g).
Annotation
Image annotation plays a crucial role in multi-class object detection. In this study, images were manually tagged to pinpoint both the location and the severity of damage to soybean leaves. Each image is paired with an XML file that contains the bounding box coordinates and class labels for the annotated leaves. The annotation details included the fields (1) “Label Name,” which categorizes the damage severity (healthy, partially damaged, or severely damaged), (2) “Pose,” which denotes the leaf's orientation, defaulting to “unspecified” if the leaf is not tilted, (3) “Truncated,” which states whether the object extends beyond the image edge (0 = no, 1 = yes), (4) “Difficult,” which indicates the level of recognition difficulty (0 = easy, 1 = difficult), and (5) “Bndbox,” (bounding box coordinates), presented as xmin, ymax, xmax, ymin, which delineates the top-left (xmin, ymax) and bottom-right (xmax, ymin) corners of the bounding box. Fig. 4 displays the annotation process, and Table 2 provides a summary of the annotation distributions within the dataset.
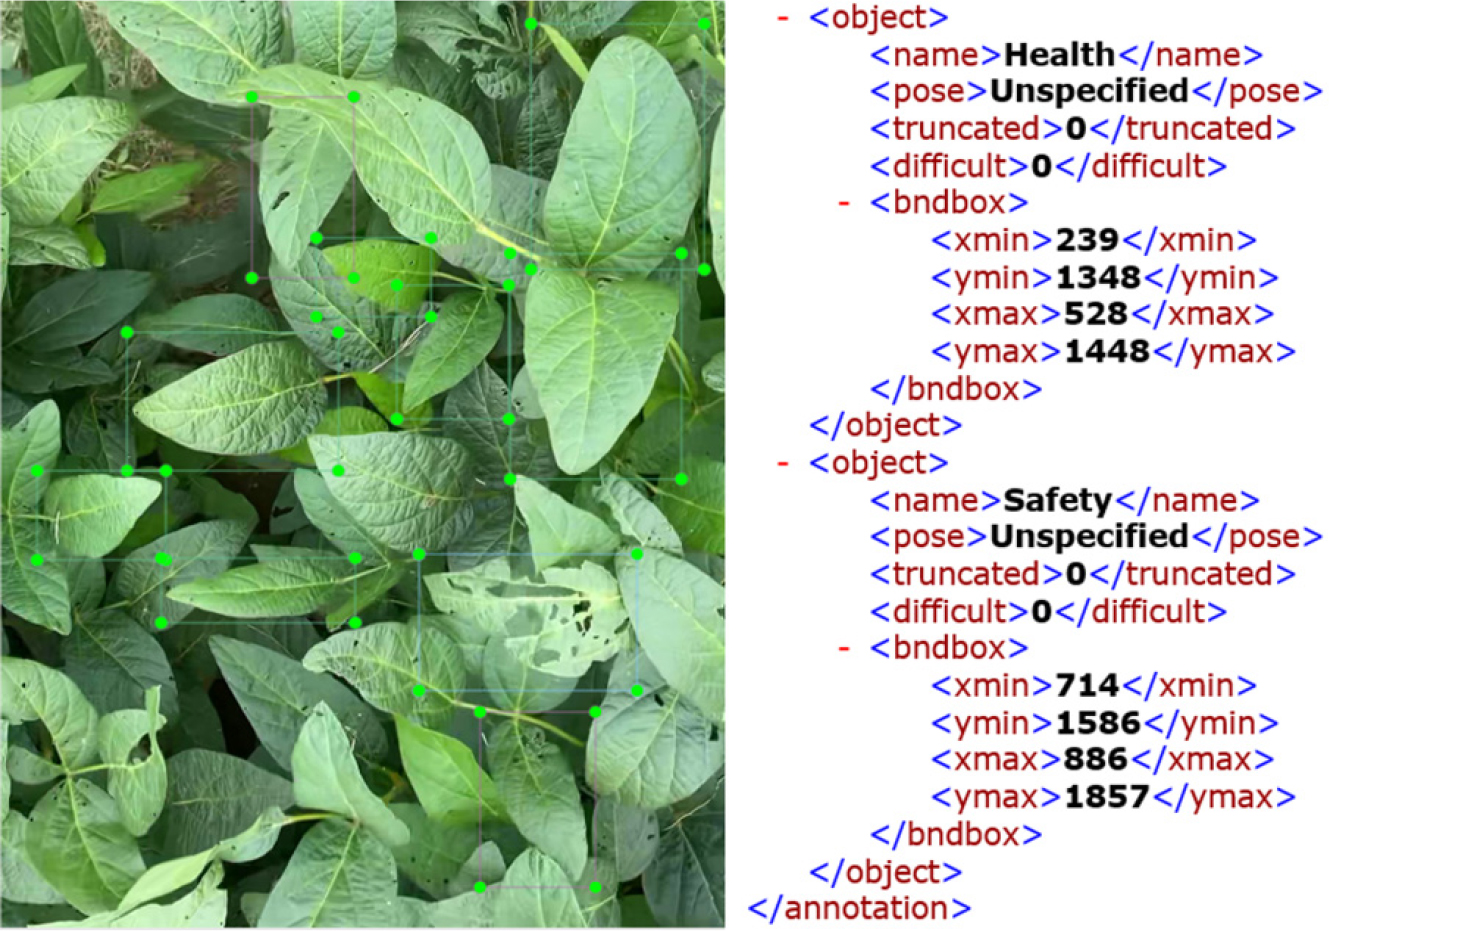
Table 2.
Distribution of ground-truthed leaf objects in the soybean leaf dataset.
| LSC† | Training | Validation | Test | Total | Percent of total |
| Healthy | 349 | 107 | 106 | 562 | 30 |
| Partially damaged | 658 | 211 | 209 | 1,078 | 58 |
| Severely damaged | 124 | 44 | 44 | 212 | 12 |
| Total | 1,131 | 362 | 359 | 1,852 | 100 |
Augmentation
Data augmentation was used to enhance the dataset and increase model generalization while minimizing overfitting during training (Liang et al., 2019). The augmentation techniques included horizontally flipping and rotating images by 90° as well as creating additional variants for each original image. Consequently, each image had three versions: the original, the flipped version, and the rotated version. This approach led to a final SLD comprising 2,385 images, which included both original and augmented data.
To address class imbalance, we implemented both data-level and algorithm-level strategies. At the data level, synthetic augmentation, including rotation, flipping, and random cropping, was applied preferentially to the underrepresented “severely damaged” class to artificially increase its representation. At the algorithm level, we experimented with focal loss and class- weighted cross-entropy during training to penalize misclassification of minority classes more heavily, thereby improving the model’s sensitivity to severe damage.
Model architecture
To detect pest-induced feeding damage on soybean leaves, we chose an optimized Faster R-CNN framework architecture that included four key components: a ResNet50 backbone for feature extraction, an FPN for multi-scale feature representation, a region proposal network (RPN) for generating candidate regions, and fully connected layers for classification and bounding box regression. The model’s overall workflow is illustrated in Fig. 5.
Faster R-CNN framework
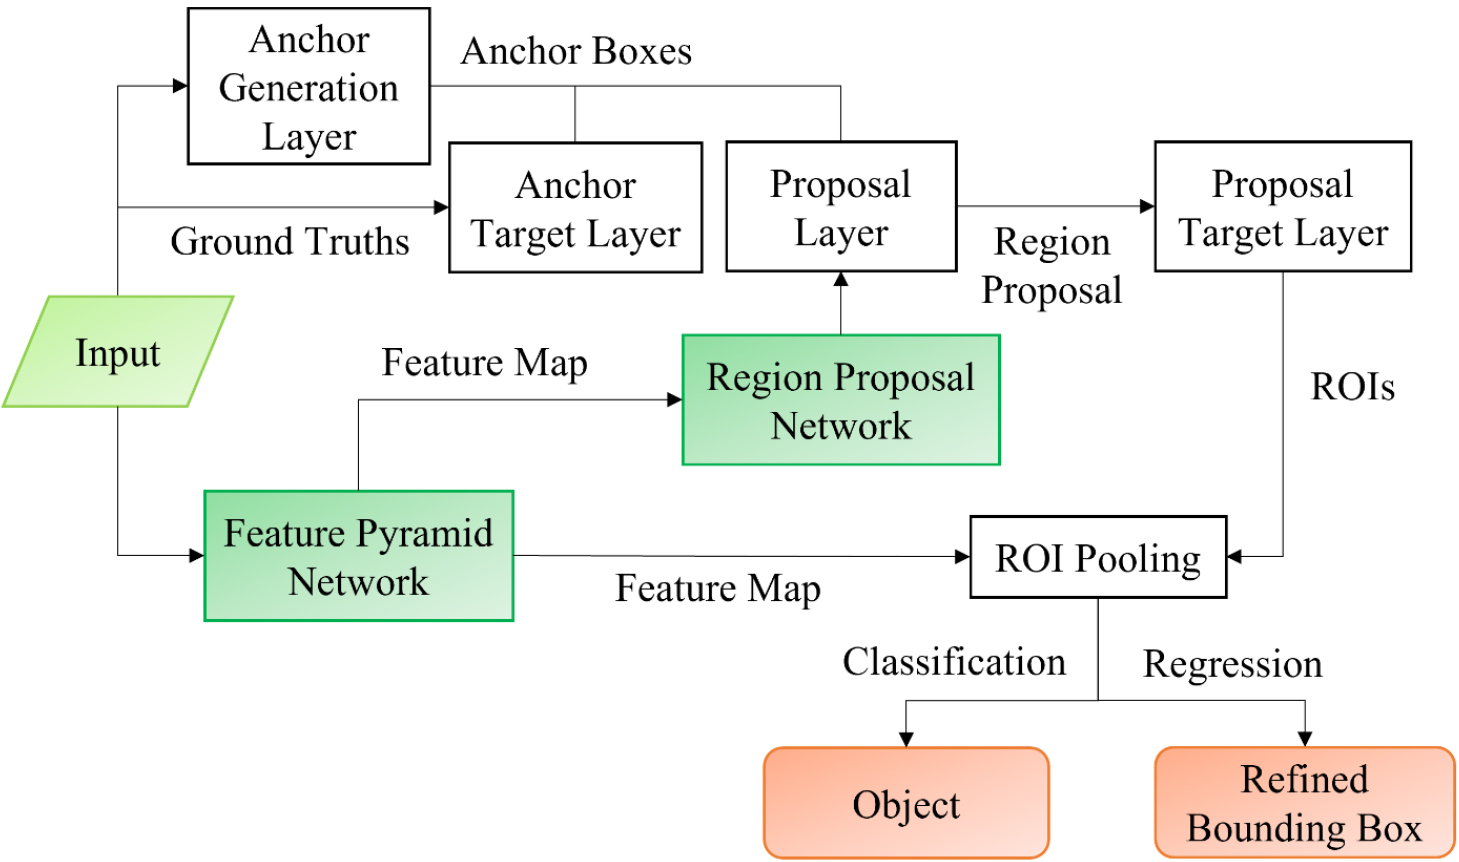
Faster R-CNN is a widely used two-stage object detection framework that enhances the performance of earlier models like R-CNN (Girshick et al., 2014) and Fast R-CNN (Girshick, 2015) (Fig. 6). This framework consists of two main components: the RPN and the Fast R-CNN detector. The RPN generates candidate object regions (proposals) using feature maps, while the Fast R-CNN detector classifies these proposed regions and refines the bounding box coordinates to improve localization accuracy. The process begins with a backbone network that processes input images to create feature maps. These feature maps are used by both the RPN, which identifies potential object regions, and the classification head of the Fast R-CNN detector, which assigns labels to the classes and adjusts the bounding boxes.
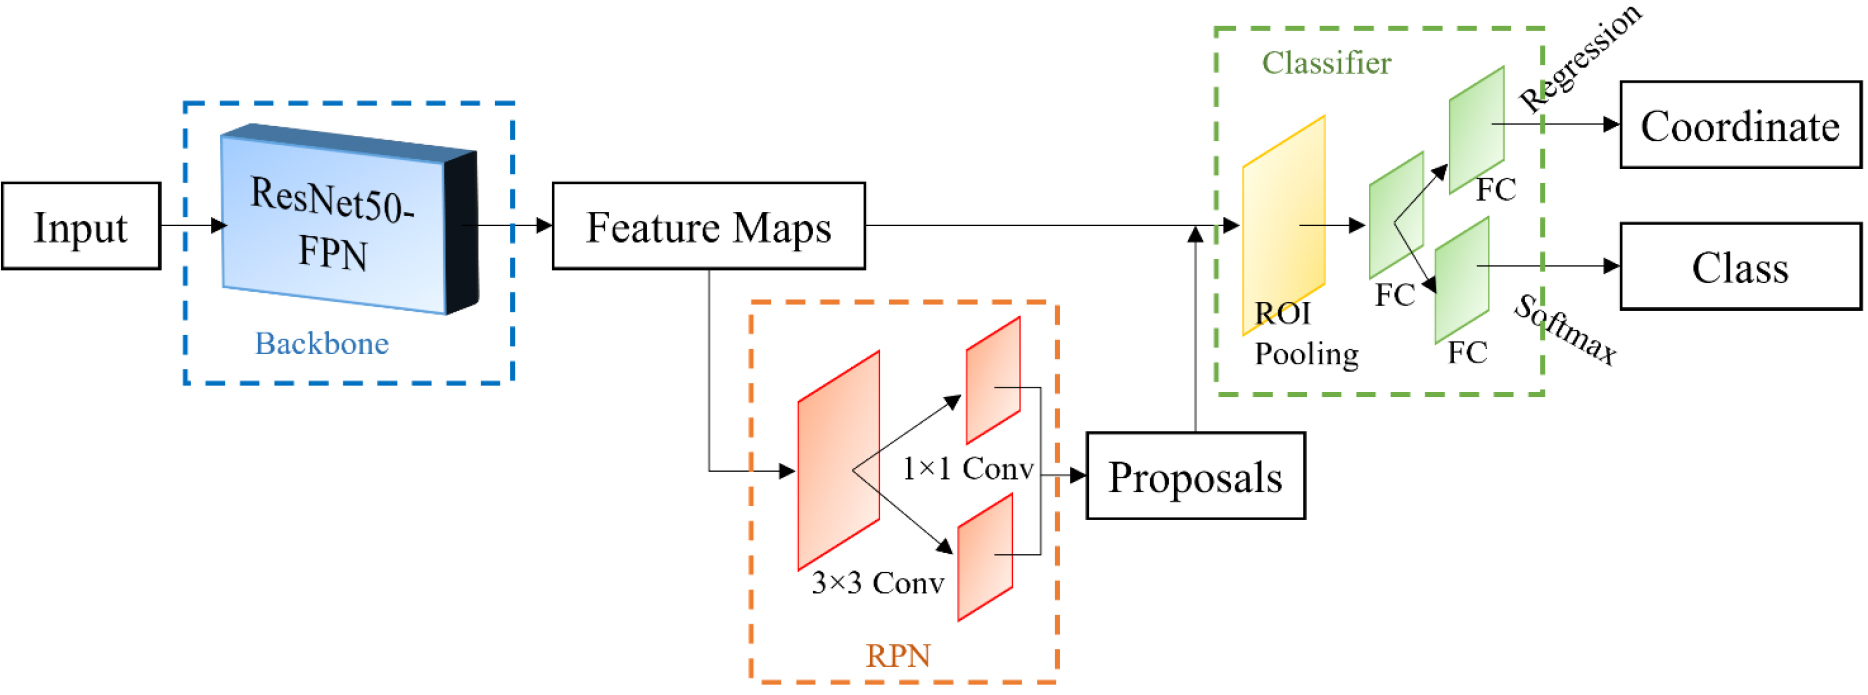
Fig. 6.
Schematic of the proposed detection architecture, comprising ResNet50 as the backbone for feature extraction, with a feature pyramid network (FPN) for multi-scale feature enhancement (blue box), a region proposal network (RPN) for generating object proposals (orange box), and a classifier consisting of classification and regression heads (green box).
ResNet50 backbone
The backbone network plays an essential role in feature extraction, significantly influencing detection performance. Traditionally, Faster R-CNN models have utilized VGG16 (Simonyan, 2014) as the feature extractor. In contrast, this study opted for ResNet50 (He et al., 2016) due to its enhanced capability in capturing detailed feature representations, especially when using images with the complex backgrounds commonly found in field conditions. ResNet50 employs residual learning, utilizing shortcut connections (or skip connections) that allow the network to learn differences from layer inputs instead of learning functions without any reference. The fundamental component of ResNet50 is the residual block, depicted in Fig. 7, which enables the creation of deeper networks without performance decline. These skip connections address the vanishing gradient issue, promoting more effective training and improving detection accuracy. Although deeper architectures like ResNet101 or ResNet152 offer greater representational power, they come with significantly higher computational expenses. ResNet50 achieves an ideal equilibrium between accuracy and efficiency, making it well-suited for large-scale object detection tasks (Li et al., 2018; Lin et al., 2017a).
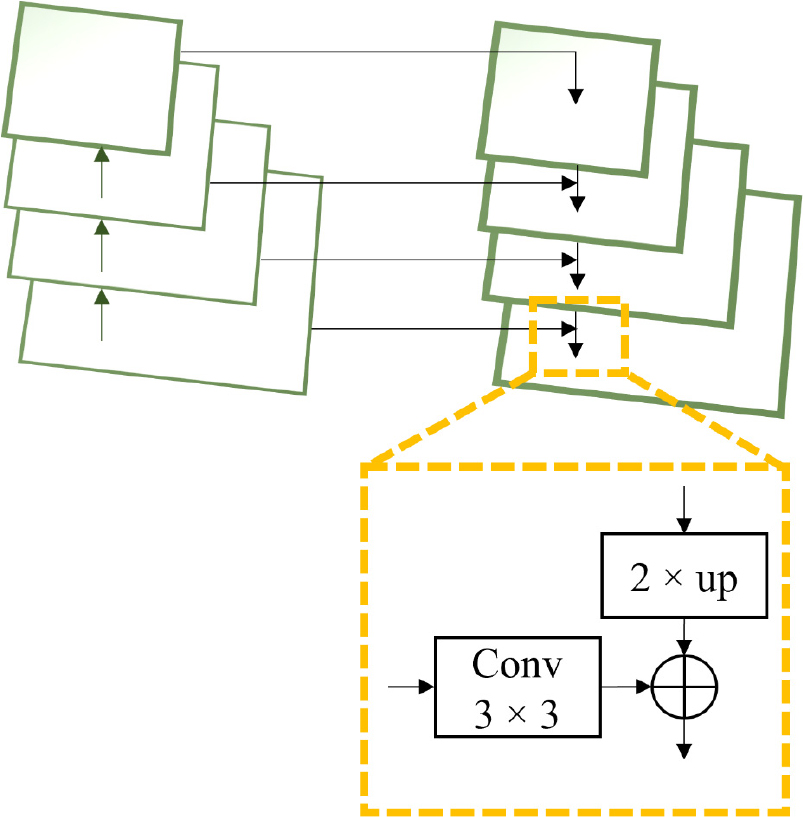
Feature pyramid network
One of the challenges in object detection is accurately identifying small or overlapping objects, as their features tend to diminish in the deeper layers of convolutional networks. To address this, we integrated an FPN into the Faster R-CNN framework (Fig. 8). The FPN enhances detection performance by constructing a multi-scale feature representation. It operates through a top-down pathway complemented by lateral connections, enabling the fusion of high-level semantic features from deeper layers with fine-grained spatial details from shallower layers (Lin et al., 2017b). The process involves (1) applying 1×1 convolutions to reduce the dimensionality of feature maps from different layers, (2) performing up-sampling (typically by a factor of 2) to align spatial dimensions across feature maps, (3) merging features through element-wise addition while defining the corresponding lateral connections, and (4) refining the combined feature maps using 3×3 convolutions to minimize aliasing effects. This hierarchical feature fusion enhances the detection of objects at various scales, thereby improving the identification of minimal, pest-damaged leaf regions that might otherwise be overlooked by traditional single-scale architectures.
Region proposal network
The RPN is tasked with creating region proposals, which are potential bounding boxes that may include objects of interest. As shown in Fig. 9, the RPN shifts a compact network across the shared convolutional feature map, generating proposals at each spatial position.
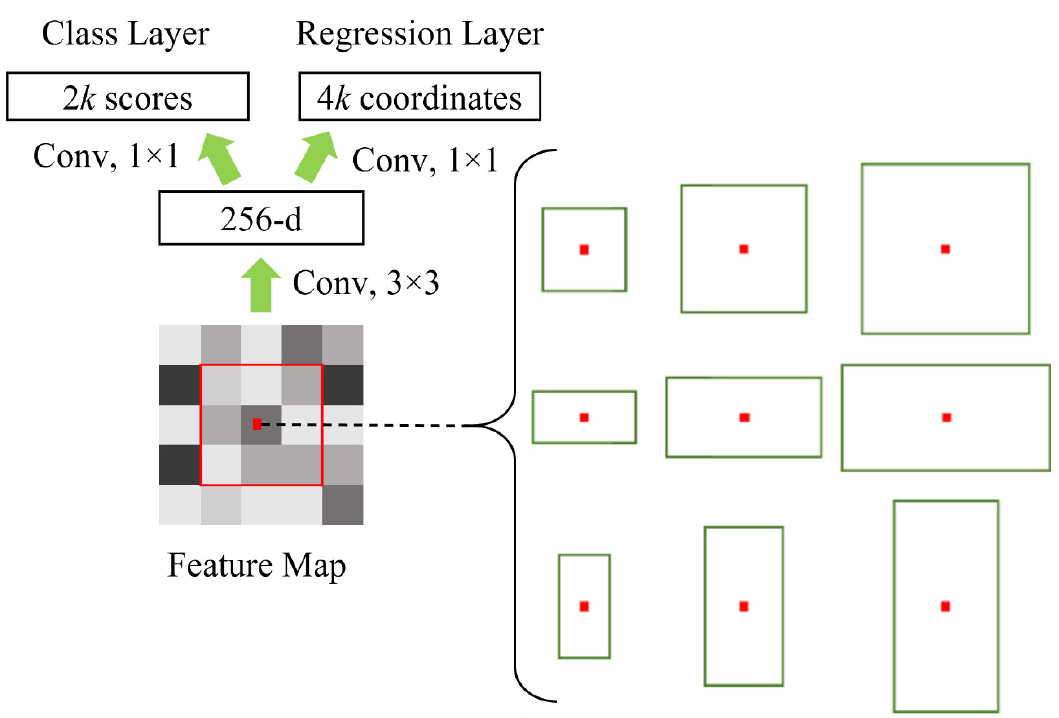
For each sliding window, the RPN generates several anchor boxes of different scales and aspect ratios to accommodate objects of varying sizes. In our study, we designed nine anchor boxes per location, spanning a diverse range of dimensions to improve the detection of both small and large damaged leaf areas. The RPN produces two key outputs for every anchor: (1) an objectness score, which is a binary classification (object versus background) determining whether the anchor contains an object, and (2) a bounding box regression, consisting of four coordinate adjustments (xmin, ymin, xmax, and ymax) that refine the anchor box around the detected object.
Once proposals are generated, the region of interest (ROI) pooling layer converts these variable-sized proposals into fixed-size feature maps via max pooling. This guarantees uniform input dimensions for the fully connected classification and regression layers, facilitating accurate object classification and precise localization.
Network architecture overview
The Faster R-CNN framework utilizes a ResNet50 backbone along with an FPN, an RPN, and ROI pooling layers, culminating in fully connected layers that perform final classification and refine bounding boxes (Fig. 5). The object detection process consists of the following steps:
a. Feature Extraction: Input images pass through ResNet50, producing multi-scale feature maps that the FPN enhances.
b.Region Proposal Generation: The RPN detects potential object regions by leveraging sliding windows and anchor boxes.
c. ROI Pooling: Variable-sized region proposals are transformed into fixed dimensions via max pooling.
d.Classification and Localization: Fully connected layers categorize objects based on damage severity and adjust bounding box coordinates for accurate localization.
Baseline models
To benchmark the performance of the proposed Faster R-CNN model, we implemented and evaluated several widely used object detectors, including YOLOv5, YOLOv8, RetinaNet, and DETR (DEtection TRansformer), using the same training and test image datasets. These models were selected based on their relevance to real-time field detection and recent successes in agricultural image analysis.
Network evaluation
The model’s performance was assessed using the set-aside test dataset based on the mean average precision (mAP) metric, a standard in object detection benchmarking that measures the detection accuracy of the model across all classes by calculating the average of the average precision (AP) values of each class. The AP is determined from the precision-recall (PR) curve, for which precision and recall are defined using Eq. (1), which calculates precision as the ratio of correctly detected objects (true positives, TP) to all detected objects, and Eq. (2), which calculates recall as the ratio of correctly detected objects to the total number of ground-truth objects:
where TP is the number of ROIs correctly identified as containing leaves with the corresponding class of pest-damage, FP (false positives) is the number of ROIs with incorrect detections, i.e., classifications of the corresponding class of pest-damage where no damage or damage of a different class exists, and FN (false negatives) is the number of ROIs with missed detections, i.e., healthy classifications when actual damage exists or classifications of the wrong damage class. The AP is computed by integrating the PR curve, typically using the trapezoidal rule to approximate the area under the curve. The mAP is calculated as the mean of the AP values across all classes:
where C represents the total number of classes, and APi denotes the average precision for class i. These metrics were also used to compare the model’s performance on each cultivar.
RESULTS
Implementation details
The Faster R-CNN model was trained using 80% of the SLD, leveraging pre-trained ResNet50 weights to enhance training efficiency and reduce computational time. The model was trained with a batch size of four, using the stochastic gradient descent (SGD) optimizer with an initial learning rate of 0.00125. A momentum factor of 0.9 and a weight decay factor of 0.0001 were applied to improve optimization stability and prevent overfitting. The training was conducted over 12 epochs, during which a dynamic learning rate adjustment mechanism was used to optimize model convergence.
Fig. 10 illustrates the training loss curves, which include both the classification and bounding box regression losses for the RPN and the final classifier. Additionally, the figure illustrates the total loss curve and the progression of the model's accuracy throughout training. At the beginning of training, the model achieved an initial classification accuracy of 89.3%, which is attributed to the transfer learning effect from the pre-trained ResNet50 backbone. During the first 2,000 iterations, the learning rate increased rapidly, resulting in fluctuations in accuracy and loss values as the model adapted to the new dataset.
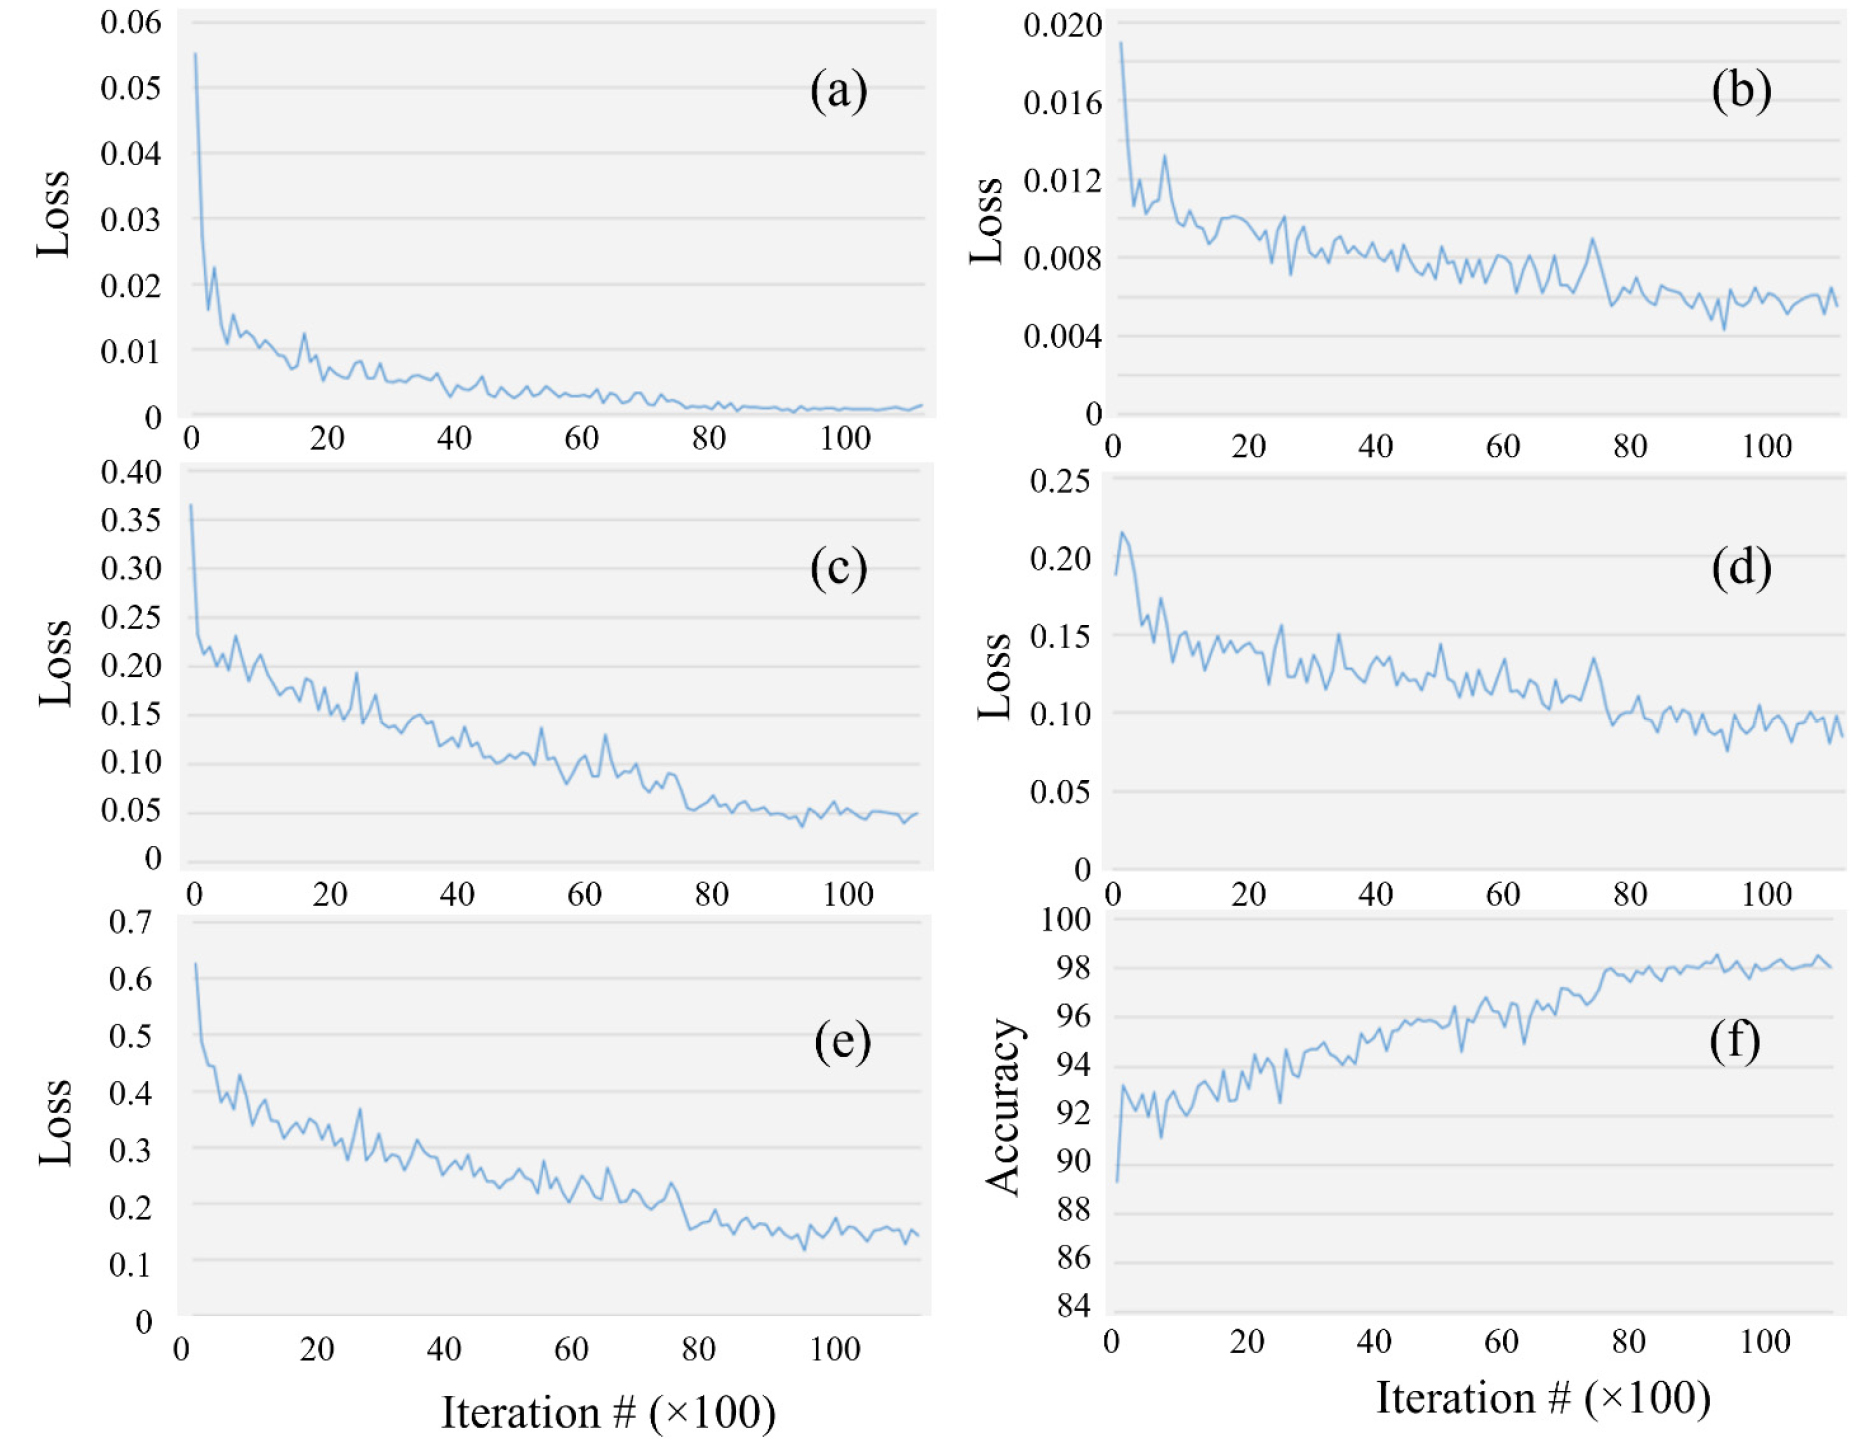
Fig. 10.
Behavior of the performance metrics over 11,000 training iterations (the x-axis is scaled by a factor of 100). Region proposal network (RPN) classification loss (a), RPN bounding box loss (b), final classifier loss (c), classifier bounding box loss (d), total loss (e), and model classification accuracy (f).
As training progressed, the model displayed a consistent upward trend in accuracy while the loss values steadily declined. The total loss continued to decrease until around the 8,000th iteration, after which it stabilized, indicating that the model had achieved convergence. Ultimately, the final total loss value reached 0.14%, reflecting the model’s ability to minimize both classification and localization errors effectively. The proposed Faster R-CNN model attained an mAP of 72.6%, demonstrating strong performance in detecting pest-induced feeding damage on soybean leaves.
Visualization of the detection results
Fig. 11 shows representative detection results from actual soybean field images. The trained Faster R-CNN model successfully identified pest-damaged leaves and accurately classified the severity of the damage, even in challenging images containing features such as complex backgrounds and multiple overlapping leaves, as well as across images with varying lighting. Additionally, it performed well in detecting small or partially occluded leaves, indicating strong generalizability to real-world agricultural settings.
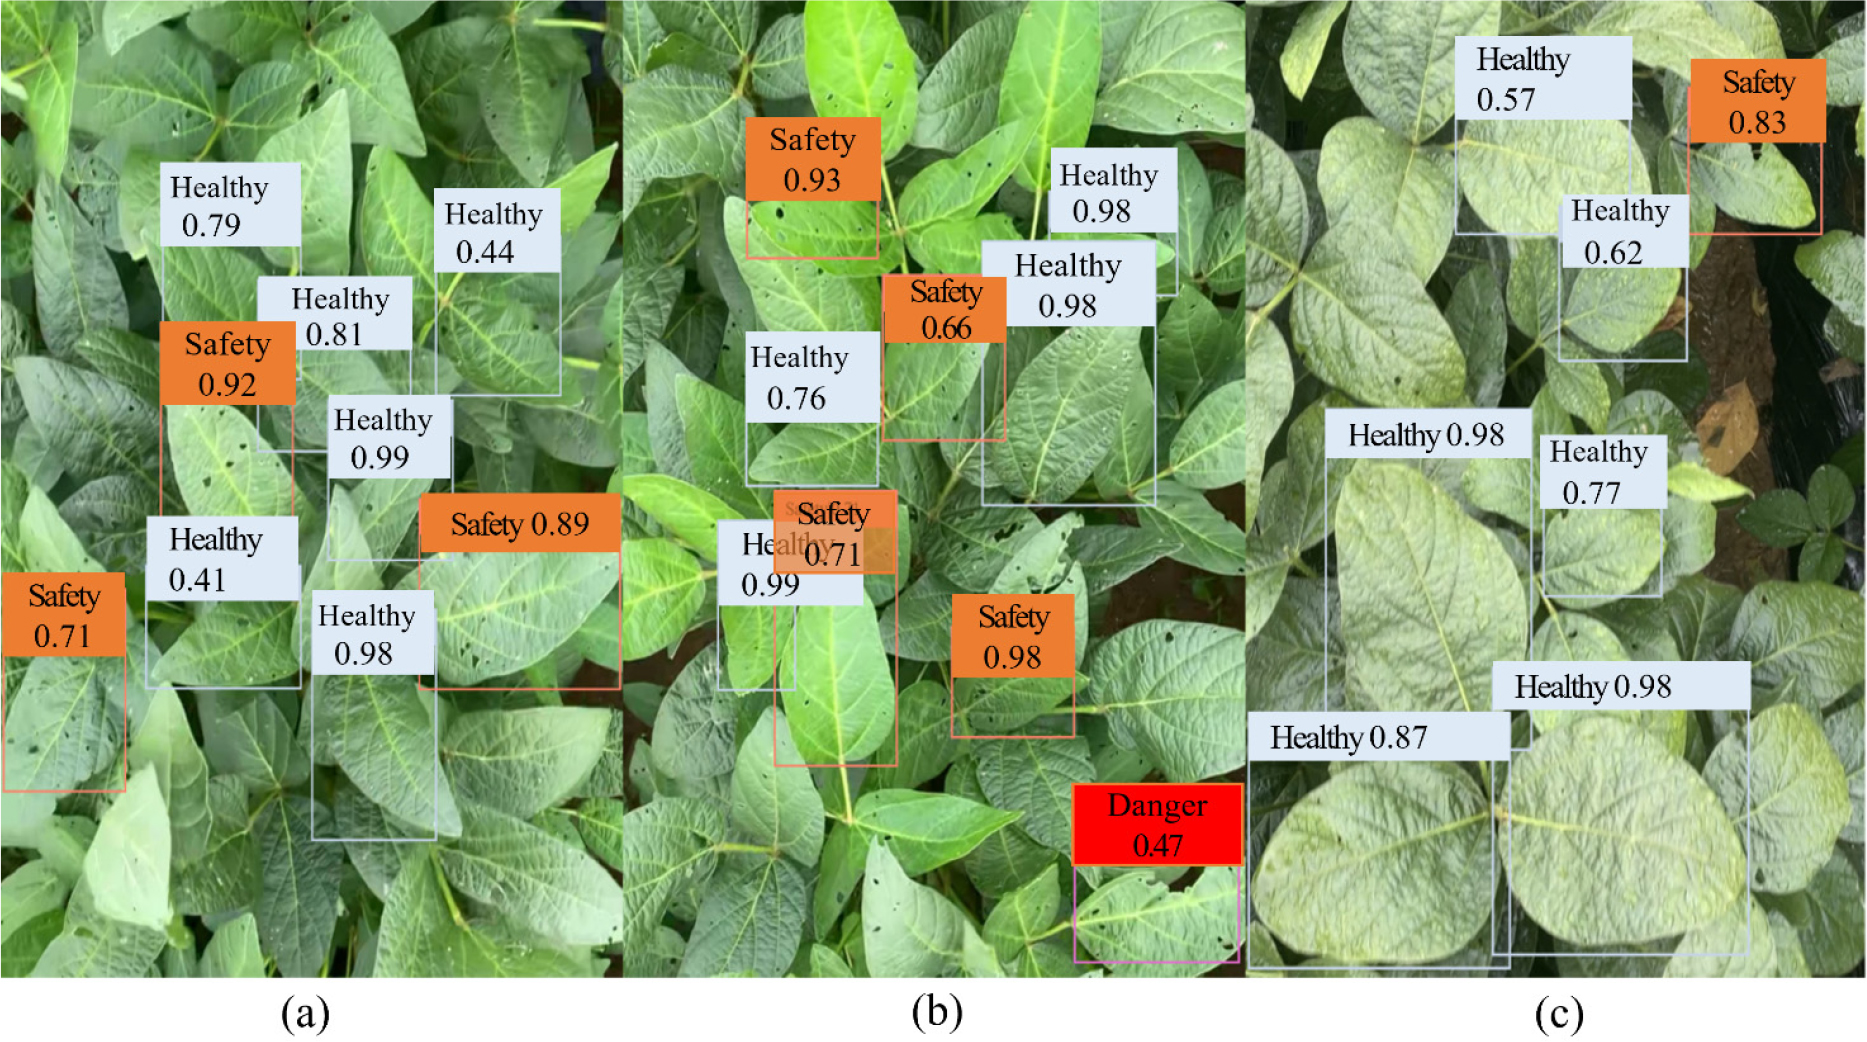
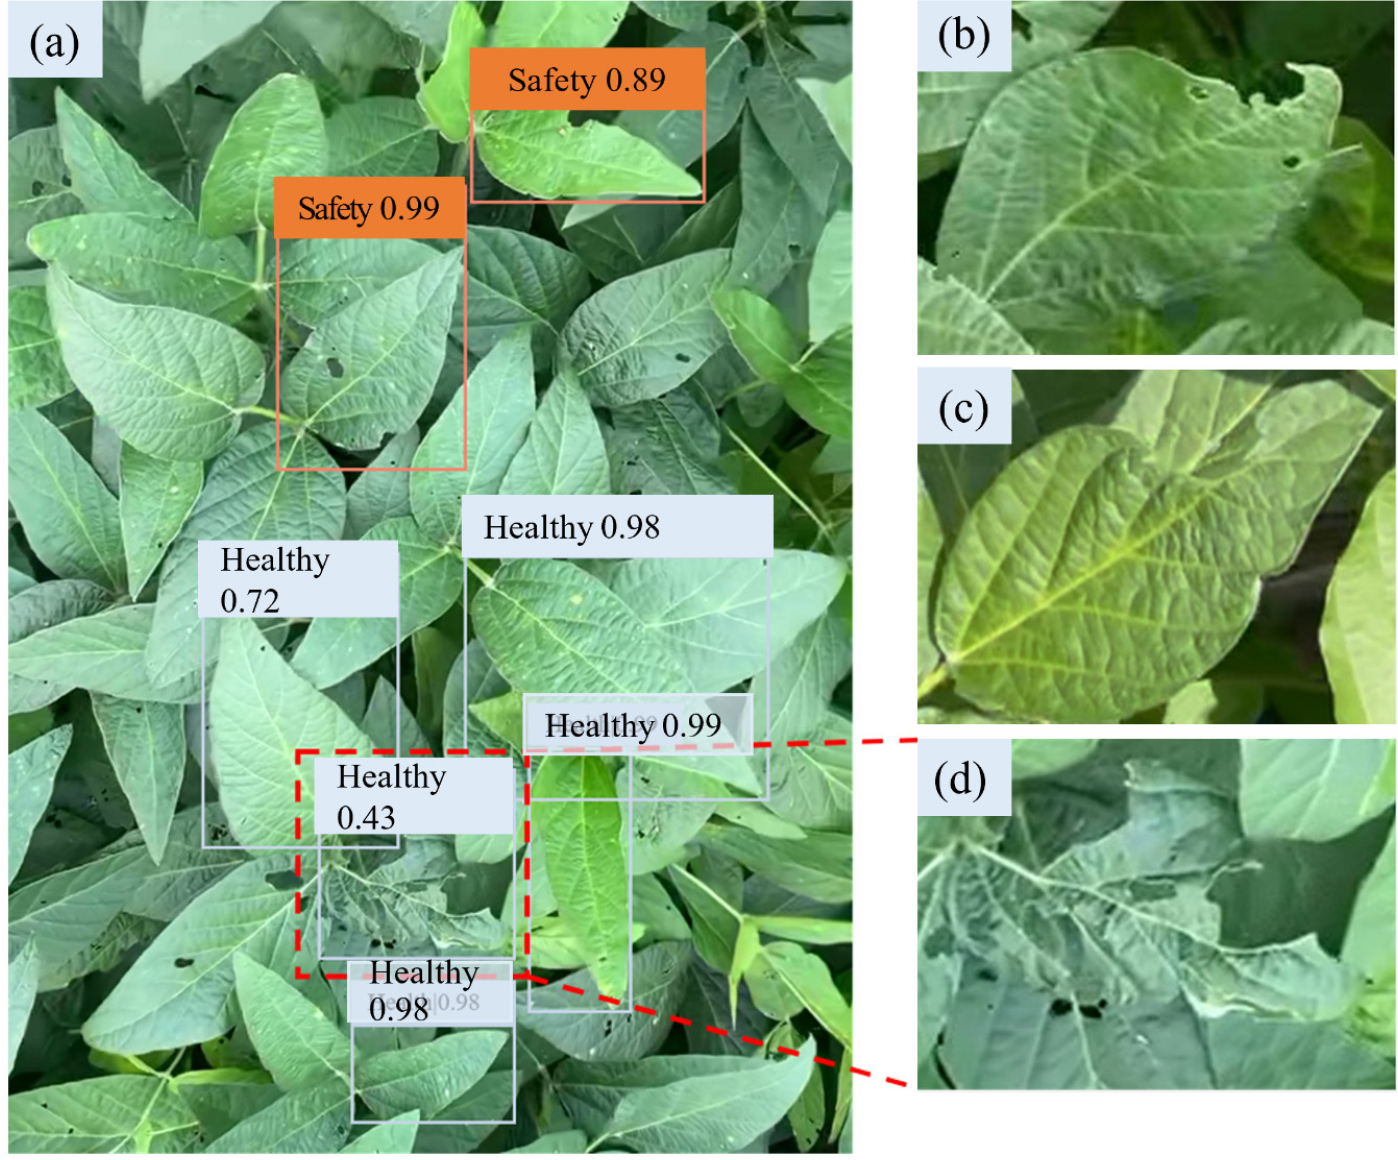
Despite its overall strong performance, certain limitations were noted, especially in detecting severely damaged leaves. This issue primarily stems from the imbalanced distribution of ROIs across damage severity classes in the training data. In the training dataset, 58% of the ROIs contained healthy leaves, 30% contained partially damaged leaves, and only 12% contained severely damaged leaves. The highest detection accuracy was observed for partially damaged leaves, the most well-represented damage class in the dataset. In contrast, the limited number of severely damaged samples resulted in frequent misclassifications. Figure 12(d) illustrates an instance in which a severely damaged leaf was incorrectly classified as healthy, producing a confidence score of 43%. This misclassification highlights the model’s sensitivity to data imbalance, particularly with regard to underrepresented classes. Taken together, Figs. 11 and 12 collectively demonstrate both the strengths and limitations of the model when deployed in real-world field conditions.
Detection errors
The model exhibited two main types of detection errors: the misclassification of severely damaged leaves and missed detections. Misclassification often occurred because the model had limited exposure to severely damaged leaves during training, leading to confusion between the severely damaged and healthy classes. In some instances, severely damaged leaves were classified as partially damaged, indicating that the model sometimes struggled to distinguish subtle differences when an underrepresented class in the training data was involved.
Missed detections were noted primarily under certain conditions, mainly when the damage was localized to the edges of the leaves or when the damaged leaves were partially obscured by overlapping foliage. In Fig. 12(b), the detector failed to identify damage confined to the leaf margins, possibly because the damaged area was too small in relation to the entire leaf. Likewise, in Fig. 12(c), underlying leaves obfuscated the damaged regions, thereby complicating the model’s ability to differentiate between damaged and healthy areas.
These detection challenges suggest that increasing the quantity and diversity of training data, particularly including more severely damaged leaves, could enhance model performance. Furthermore, incorporating more advanced data augmentation techniques may enhance the model’s robustness in addressing occlusions, subtle damage patterns, and complex background interference—common features encountered in images taken under real-field conditions.
Model performance vs baseline models
To validate the effectiveness of the proposed Faster R-CNN model, we conducted a comparative evaluation using several state-of-the-art object detection models: YOLOv5, YOLOv8, RetinaNet, and DETR. Each model was trained on the same SLD, using identical training and validation partitions, and evaluated using the mean mAP metric. The implementation of these models employed their standard configurations with pre-trained weights, ensuring a fair comparison under equivalent experimental settings.
Table 3 summarizes the performance of all models. The proposed Faster R-CNN model achieved the highest mAP (72.6%). It outperformed YOLOv5 (67.8%) and RetinaNet (70.3%), and though YOLOv8 demonstrated the most competitive performance (71.0%), it showed reduced precision for occluded and overlapping leaves. The DETR model, while known to be capable of capturing long-range dependencies, achieved the lowest mAP (65.4%), likely due to its higher data requirements and slower convergence when using smaller datasets.
Table 3.
Performances of object detection models on the soybean leaf dataset, measured by mean average precision (mAP), average precision (AP) for each class, and inference time (IT).
Despite the lower inference speed compared to the one-stage detectors YOLOv5 and YOLOv8, Faster R-CNN demonstrated superior robustness in scenarios with dense foliage, complex backgrounds, and overlapping leaves. This suggests that two-stage detectors remain advantageous for fine-grained damage classification tasks in field-based agricultural imagery.
DISCUSSION
Research on the use of models to identify soybean leaf damage due to pests in actual field conditions has faced limitations stemming from difficulties in dataset creation and technical challenges. This study tackled these issues by creating an extensive soybean image dataset collected under various environmental scenarios, including differences in weather and lighting, and containing different levels of background complexity. We used this dataset to train a Faster R-CNN model augmented with an FPN to enhance feature extraction at different scales. The FPN's integration enabled the model to effectively capture both high-level semantic features and low-level spatial details, leading to improved detection performance. The model demonstrated its effectiveness by achieving an mAP of 72.6%, highlighting its capability to detect pest-related feeding damage on soybean leaves.
The incorporation of an FPN enabled multi-scale feature representation, thereby improving the model’s ability to detect small or partially visible damaged regions overlaying complex agricultural backgrounds. Notably, the model demonstrated robust generalization, performing well when applied to test images containing novel spatial and lighting conditions, as well as varying degrees of leaf occlusion and orientation. This substantiates the model’s practical utility for real-time pest monitoring in soybean fields.
To further validate our approach, we compared the performance of our model with that of state-of-the-art object detection models, including YOLOv5, YOLOv8, RetinaNet, and DETR. Faster R-CNN outperformed all alternatives in mAP, particularly excelling at detecting partially hidden or overlapping leaves. YOLOv8 achieved comparable performance in more straightforward scenarios but underperformed in cases involving occlusions and edge-localized damage. These results justify the selection of Faster R-CNN for the task, given its balance between detection accuracy and robustness in tackling the challenges associated with field images.
To examine potential cultivar-based variations in model performance, we conducted a separate evaluation of the model’s performance with respect to the two soybean cultivars included in this study: ‘Daepung’ and ‘Pungsannamul.’ The results revealed no significant differences in mAP or class-wise AP values between the two cultivars. Thus, the model maintained stable detection performance regardless of cultivar-specific leaf morphologies or pigmentations, suggesting it possesses generalizability across genotypes.
Despite its strengths, the model exhibited a reduced accuracy in identifying severely damaged leaves. This limitation is mainly attributable to a class imbalance in the training dataset, where severely damaged samples accounted for only 12% of the total. In their comprehensive review, Johnson & Khoshgoftaar (2019) detail how such imbalances can bias model learning toward majority classes, compromising the detection of minority classes. Addressing this imbalance through additional data collection, targeted oversampling, and the use of class-weighted or focal loss functions may enhance a model’s sensitivity to rare but critical damage types.
The model also struggled with edge-localized damage and occluded leaves, which frequently occur in images from dense field environments. These cases were often missed or misclassified, potentially due to the limited number of training examples that captured these conditions. Integrating instance segmentation methods, such as Mask R-CNN, or attention-based architectures, like DETR, could help overcome these shortcomings by enabling the more precise localization and differentiation of damage features, especially under visual clutter or partial occlusion.
Furthermore, recent advances in transformer-based object detection models offer promising directions for future improvement. Architectures such as the Swin Transformer and DETR enable global context modeling and have demonstrated strong performance in tasks involving complex scenes and occlusions. Incorporating such models, or hybrid CNN-transformer approaches, may improve the detection of subtle or spatially dispersed feeding damage in future research.
These detection challenges also underscore the importance of gathering high-quality, diverse training data. Krizhevsky et al. (2017) demonstrated that improving dataset diversity through targeted data collection efforts can significantly enhance model performance. Future research should prioritize obtaining images that capture a wider variety of leaf damage distributions, especially those with edge-localized damage and overlapping leaves. Moreover, utilizing sophisticated image preprocessing methods, including contrast enhancement and segmentation techniques, could enhance the model’s capacity to identify subtle damage characteristics.
In addition to accuracy, inference time is a critical consideration for field deployment. The proposed Faster R-CNN model required an average of 29 milliseconds per image during inference. While it was slower than the one-stage detectors, YOLOv5 (12 ms per image) and YOLOv8 (15 ms per image), it remains within the acceptable range for near-real-time field applications using GPU-equipped edge devices. Future work will investigate the application of model compression or lightweight architectures to enhance inference speed without compromising detection accuracy.
Improving dataset diversity is also essential for achieving broader generalizability. While our dataset covered two cultivars and two geographic locations over a two-year period, expanding it to include additional regions, cultivars, and seasonal variations would increase the ecological and phenotypic variability available for model training. This could significantly enhance its adaptability to broader agronomic conditions and crop management systems.
In conclusion, our findings highlight the effectiveness of a Faster R-CNN model with an FPN in detecting pest-induced soybean leaf damage using images captured under complex field conditions. The model’s strengths lie in its robustness to environmental variability and its high accuracy in diagnosing common damage patterns. However, addressing class imbalances, increasing dataset diversity, and enhancing detection robustness for occluded or edge-localized damage remain essential challenges for future development. Additionally, the further exploration of transformer-based architectures and continued evaluation using new cultivars will support the development of more generalizable and intelligent pest detection systems, making them more accurate, scalable, and practical. This will ultimately advance pest management in precision agriculture.
