

INTRODUCTION
MATERIALS AND METHODS
Plant materials and DNA extraction
Database mining and primer design
Finger millet genotyping using EST-SSR markers
Data Analysis
RESULTS
EST-SSRs selection and genetic diversity analysis
Structure analysis and phylogenetic analysis
DISCUSSION
INTRODUCTION
Millet is a small grain crop that is mainly cultivated in semi-arid tropical regions of Africa and South Asia. The millet grains are used for human food and the stalks are normally used as animal fodder in these cultivation regions (Baryeh, 2002). Traditionally grown millet species include pearl millet, finger millet [Eleusine coracana (L.) Gaertn], foxtail millet [Setaria italica (L.) P. Beauvois], Japanese barnyard millet [Echinochloa esculneta (A. Braun) H. Scholz], Indian Barnyard millet [Echinochloa frumetacea (Roxb.) Link], kodo millet [Paspalum scrobiculatum L.], little millet [Panicum sumatrense Roth ex Roem. & Schult.] proso millet [Panicum miliaceum L.] and Tef [Eragrostis tef (Zucc.) Trotter] (Goron & Raizada, 2015). Finger millet grain is more nutritious than other cereals, providing large amounts of protein, minerals, and vitamins. Finger millet has a high protein content and has been reported to possess a fairly high biological value due to particularly rich in methionine and other essential amino acids. Finger millet also contains fat (1.29 percent) mainly composed of two polyunsaturated fatty acids as linoleic acid and α-linolenic acid (Fernandez et al., 2003; Pandey & Kumar, 2005). Furthermore, finger millet has a wide adaptability to diverse environment such as drought area. The proso millet and foxtail millet are cultivated as a major millet crop in Korea due to its good tolerance to abiotic stresses. For this reason, finger millet is used as a candidate crop for coping with severe climate change in Korea.
The selection of target trait using different morphological and biochemical traits or genetic diversity based on molecular markers is essential in finger millet breeding approach. Molecular markers are often used to analyze the genetic diversity and genetic differentiation of plant populations (Govindaraj et al., 2015). Molecular markers are one of the tools for precise, efficient and cost effective germplasm characterization and management through the detection of DNA polymorphisms in most areas of plant genetics. The advantages of DNA markers are well documented (Powell et al., 1996) and these include: high information content, reproducibility and locus specificity. Such markers that have been used in finger millet include Inter Simple Sequence Repeats (ISSRs) (Gupta et al., 2010), Amplified Fragment Length Polymorphisms (AFLPs) and SSRs (Dida et al., 2007; Arya et al., 2009), EST-SSRs and SNPs (Kumar et al., 2016; Gimode et al., 2016). Among the DNA markers, expressed sequence tags (ESTs)-SSR are very useful in species diversity research due to the primer target sequences residing in the expressed genes which are relatively well conserve.
Due to the complexity of the genome and the economically underdeveloped areas as the main growing areas, molecular works of finger millet have been little attention from the research community and are less information of genomic and EST sequences than other millets such as sorgum, foxtail millet and proso millet. There has been tremendous increase in availability of ESTs and it has been confirmed that EST-SSR based markers can be easily developed from existing database. (Gupta et al., 2010). EST-derived SSRs are probably tightly linked with functional genes that may control certain agronomic traits. They are thus a potential tool for marker-assisted selection (MAS) breeding and genetic diversity of genetic resources.
The objective of this study was to assess the level of genetic diversity and determine the population structure on finger millet accessions that were introduced from Asian countries and Kenya using EST-derived SSRs markers. And to characterize the possible relationships of genetic classification with the germplasm origin or collection sites of these accessions.
MATERIALS AND METHODS
Plant materials and DNA extraction
In this study, we obtained seeds for a total of 102 E. coracana landraces, including 42 genotypes from Asian countries provided by the National Agrobiodiversity Center of the National Institute of Agricultural Sciences (NAS), Rural Development Administration (RDA), Korea, and 60 genotypes from the Kenya Agricultural and Livestock Research Organization (KALRO), Kenya. The details of each genotype are provided in Table 1 (Table 1). Six young leaves were collected from each individual at four-leaf stage after 15 days of sowing and genomic DNA was extracted by Genomic Plus DNA Prep kit according to the manufacturer’s instruction (Inclone Co, Korea). The DNA quality was first checked on 1% agarose gel electrophoresis and the quantification and concentrations of DNA were estimated using EpochTM microplate spectrophotometers (BioTek Instruments Inc., USA). The extracted DNA of 102 finger millet genotypes was adjusted to a concentration of 50 ng/μL and stored at -20°C until further use.
Table 1.
List of Finger millet used in the study with their origin and accession number.
Database mining and primer design
Database mining and primer design used data deposited in the NCBI (as on March 17, 2019) to derive finger millet sequences. A total of 1,956 EST sequences were retrieved from NCBI (http://www.ncbi.nlm.gov/nuccore/?term=finger+millet+EST) to search simple sequence repeats. EST-SSRs assembling using SeqMan DNA Star Lasergene version 7.1 (DNASTAR Inc, Madison, WI). The microsatellite primer pairs identification using SSR locator v1 software (Da Maia et al., 2008) and simple sequence repeat identification tool (SSRIT) (http://www.gramene.org/gramene/searches/ssrtool). The amplified product size was controlled within the range of 100 to 300 bp. For designing primers, optimum primer length was 20 mer (ranged 18-25 mer), optimum annealing temperature was 60°C (range was 55-62°C) and the rest of parameters was default value. In order to test whether the 40 EST-SSRs used in the study are concentrated in a limited position, linkage disequilibrium analysis (LD) was performed on 40 markers using TASSEL v5.2.64.
Finger millet genotyping using EST-SSR markers
The SSR-makers were amplified in a 20 µL total volume containing 50 ng of genomic DNA, 2 µL of each EST-SSR primer (10 pmol), 4 µL of 5x reaction Buffer (Inclone Co, Korea), 1 U of Taq DNA polymerase (Inclone Co, Korea), 1.6 µL of dNTP (2.5 mM), and 11 µL nuclease-free water. DNA amplifications were performed in PTC-100 thermal controller (MJ Research Watertown, MA, USA). The PCR profile was: initial denaturation of 3 min at 94°C, followed by 35 cycles at 95°C for 40 s, 30 s at the annealing temperature (Table 2) and 45s at 72°C, and a final extension of 10 min at 72°C. PCR products of clear, stable and specific bands with expected length (100-250bp) on 1.5% of the agarose gel were considered as successful PCR amplifications. PCR products were electrophoresis by Fragment AnalyzerTM 96-capillary Automated CE System using DNF-900 doublestranded DNA Reagent Kit (Advanced analytical, USA) according to the manufacturer's instruction.
Table 2.
Description of forty EST-SSR markers developed in this study and genetic parameters among 102 finger millet genotypes.
Data Analysis
The blast function of the NCBI database was used to annotate EST-SSRs using the default parameters. Different parameters such as the number of observed alleles (NA), expected heterozygosity (HE), and polymorphism information content (PIC) were analyzed using the Cervus v3.0 software (Araneda et al., 2004; Kalinowski et al., 2007). The neighbor-joining method was used to construct the phylogenetic tree using the DARwin6.0 software (Perrier, 2006). Principal component analysis (PCA) was performed using the factoextra package (https://github.com/kassambara/facoextra) in R v4.1. Population structure analysis was performed using the STRUCTURE v2.3.1 software (Pritchard et al., 2000). The admixture model used a burn-in of 50,000 and 100,000 iterations for 1-10 K populations, with three independent runs each. This set of parameters exhibited a convergence point, at which summary statistics attained equilibrium. The ad hoc statistic ΔK was used to determine the optimal number of subpopulations (Evanno et al., 2005). The neighbor-joining method (Saitou & Nei, 1987) was used to clustering.
RESULTS
EST-SSRs selection and genetic diversity analysis
A total of 1,927 ESTs were used to evaluate the presence of SSR motifs. The SeqMan DNA Star Lasergene v7.1 software (DNASTAR Inc, Madison, WI, USA) was used to obtain consensus sequences from overlapping EST clusters to eliminate redundant sequences; 1,412 singletons were generated. To search for SSR motifs containing 2-6 nucleotides across these unigenes, we applied SSRIT (http://www.gramene.org/gramene/searches/ssrtool) and the SSR Locator V.1 software (da Maia et al., 2008) which generated a total of 268 SSR motifs with repeated sequences longer than 16 bp and an expected size ranging from 100 to 300 bp. In a preliminary experiment, we randomly selected 12 germplasm resources to amplify the 268 primer pairs, and 40 primers were used to detect polymorphisms.
The results showed a low level of linkage disequilibrium (LD). In all SSR marker loci, a total of 562 locus pairs were detected. The significance threshold is set to p <0.001. There are 5 pairs that are significant and have square correlation coefficients of 0.1 < (r 2) <0.5, including FM-EST 130 and FM-EST 33, FM-EST 152 and FM-EST 46, FM-EST 215 and FM-EST 46, FM-EST 212 and FM-EST 152, FM-EST 230 and FM-EST 152.
The genetic variability of 102 E. coracana L. genotypes, representing diverse germplasm collected from Asia and Africa, was assessed using 40 EST-SSR markers. The primer sequence information, product sizes, and repeat motifs of these 40 EST-SSR markers are described in Table 2. A total of 116 alleles were detected for the 40 EST-SSR loci among 102 finger millet genotypes. The number of alleles (NA) per EST-SSR marker locus ranged from 2 to 5. These alleles were expressed at all loci, with an average of 2.9 alleles per locus. The average HE value for the germplasm examined in this study was 0.198 (0.01-0.53) (Table 2); typically, higher HE values indicate higher genetic variability. The average PIC value was 0.18 (0.01-0.39) (Table 2).
Structure analysis and phylogenetic analysis
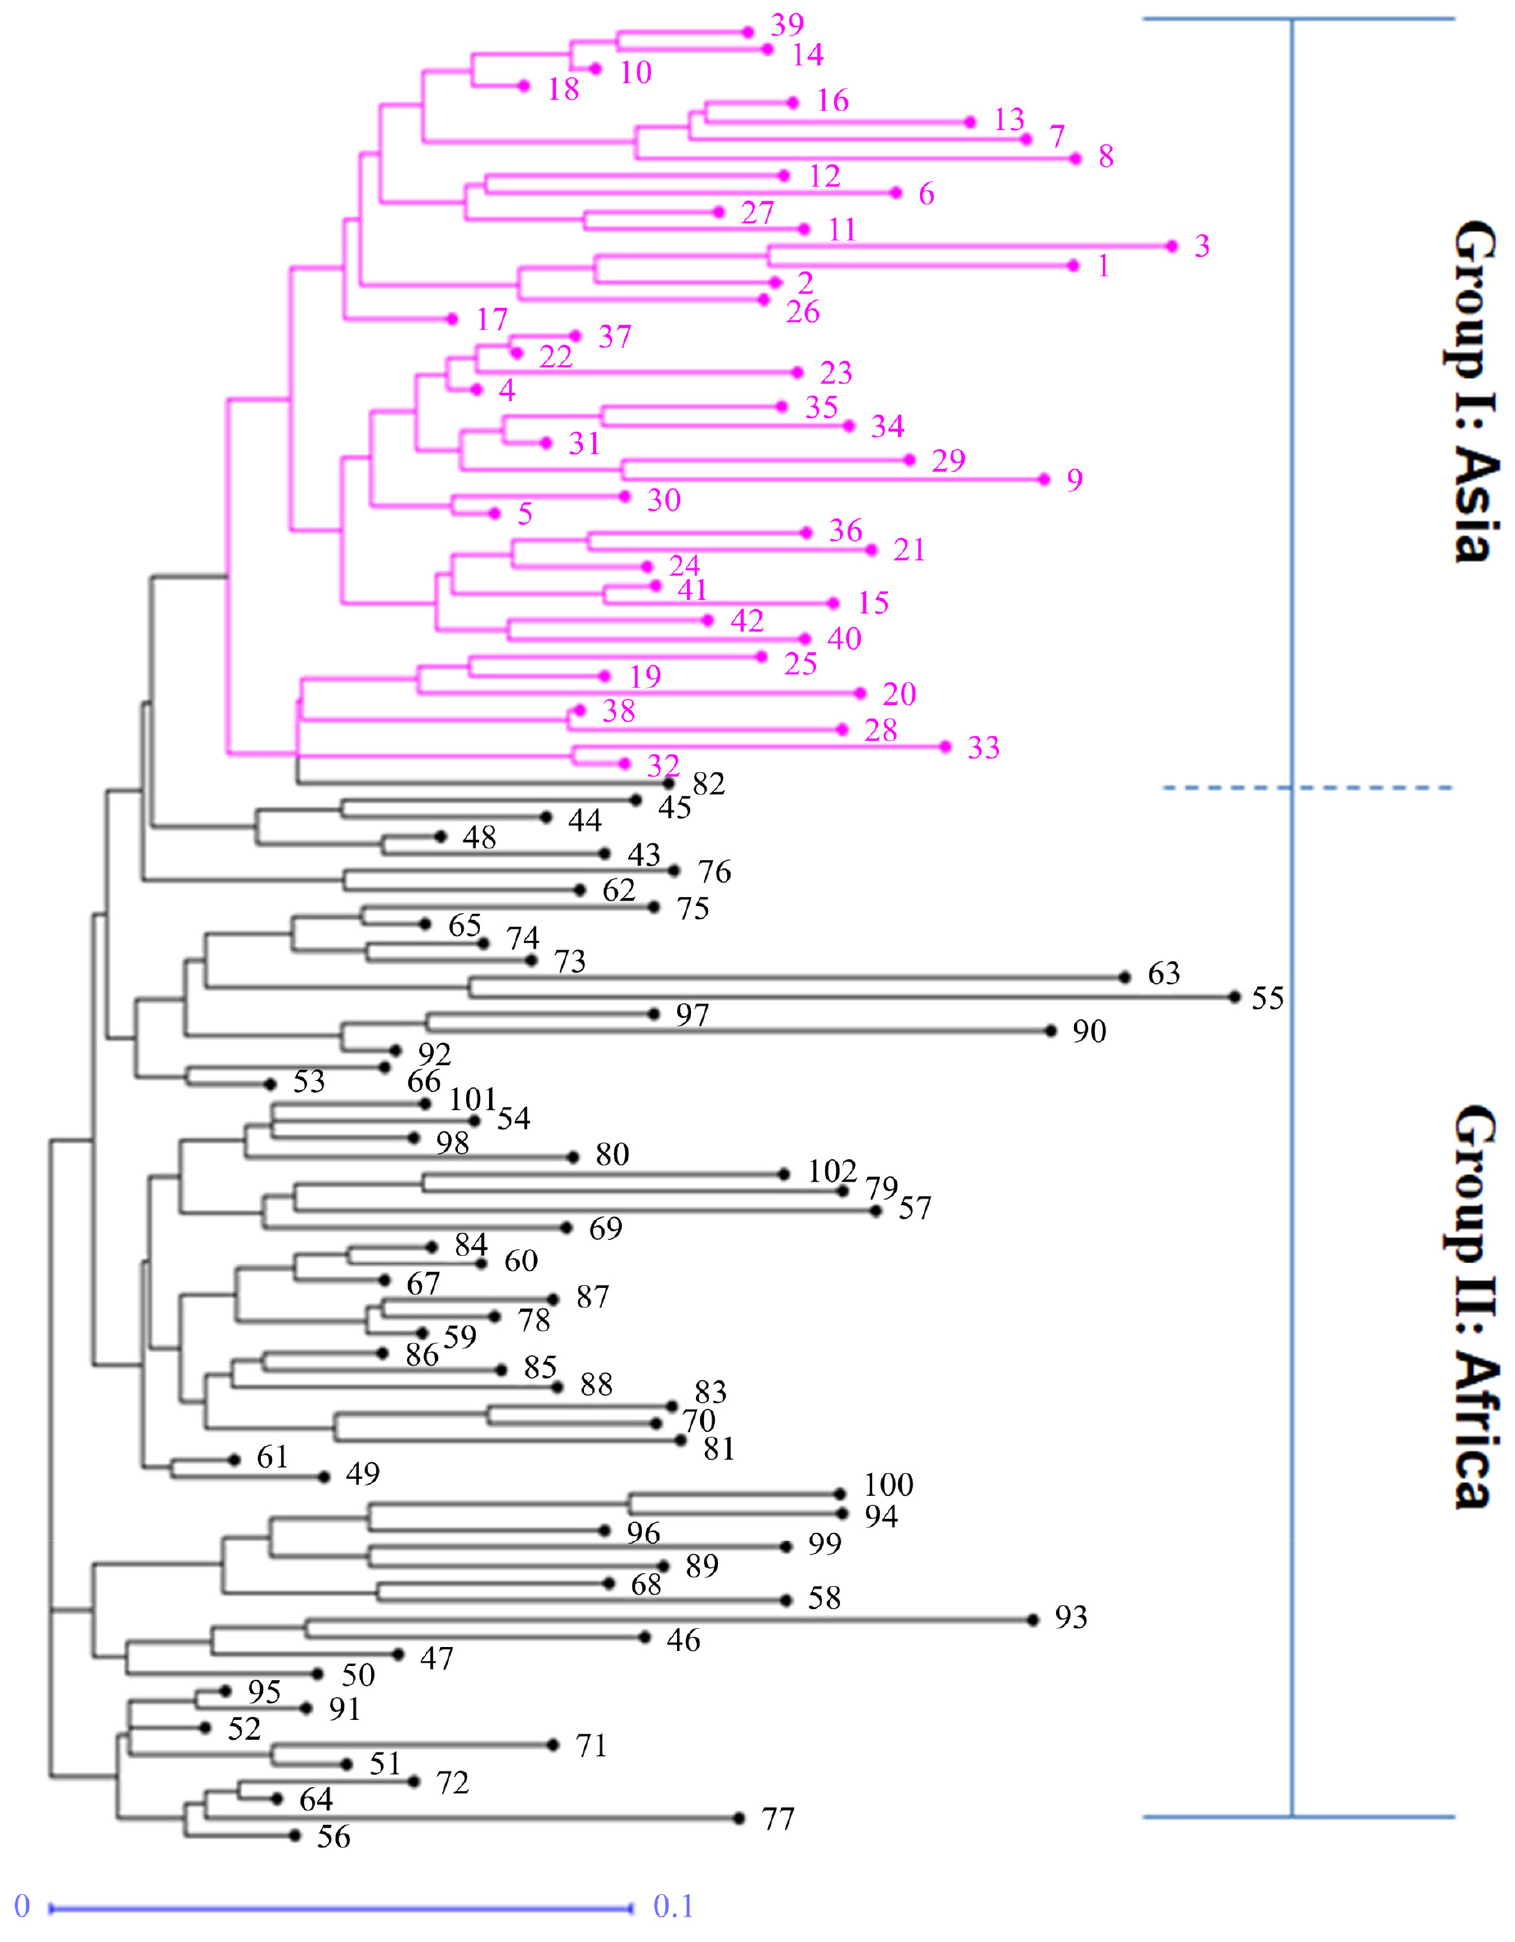
We performed population structural analysis using the Structure Harvester program, with the number of subpopulations (K) ranging from 2 to 10. The results showed that ΔK reached a maximum (383.809466) at K = 2, indicating the most suitable K value (Fig. 1A), followed by 5 (ΔK = 23.226126). The 102 accessions collected in various regions were thus classified into two subpopulations (Fig. 1B). Similarly, the PCA analysis also clearly showed that the 102 accessions were clustered in two regions (Fig. 1C). Individuals in groups I and II were distributed in Asia (Nepal, India, China, and Pakistan) and Africa (Uganda, Zambia, Zimbabwe, and Kenya), respectively (Fig. 1D). The germplasm was clustered into two groups (Fig. 2). Group I included 42 accessions collected from the five Asian countries, and group II included 60 accessions collected from the five African countries (Fig. 2, Table 1). The F statistic between the two groups is 0.194, which shows that the degree of genetic differentiation among populations is high. In addition, with a global Nei’s (1973) genetic diversity of 0.214, the genetic diversity of group II is 0.203, which is higher than group I (0.175).
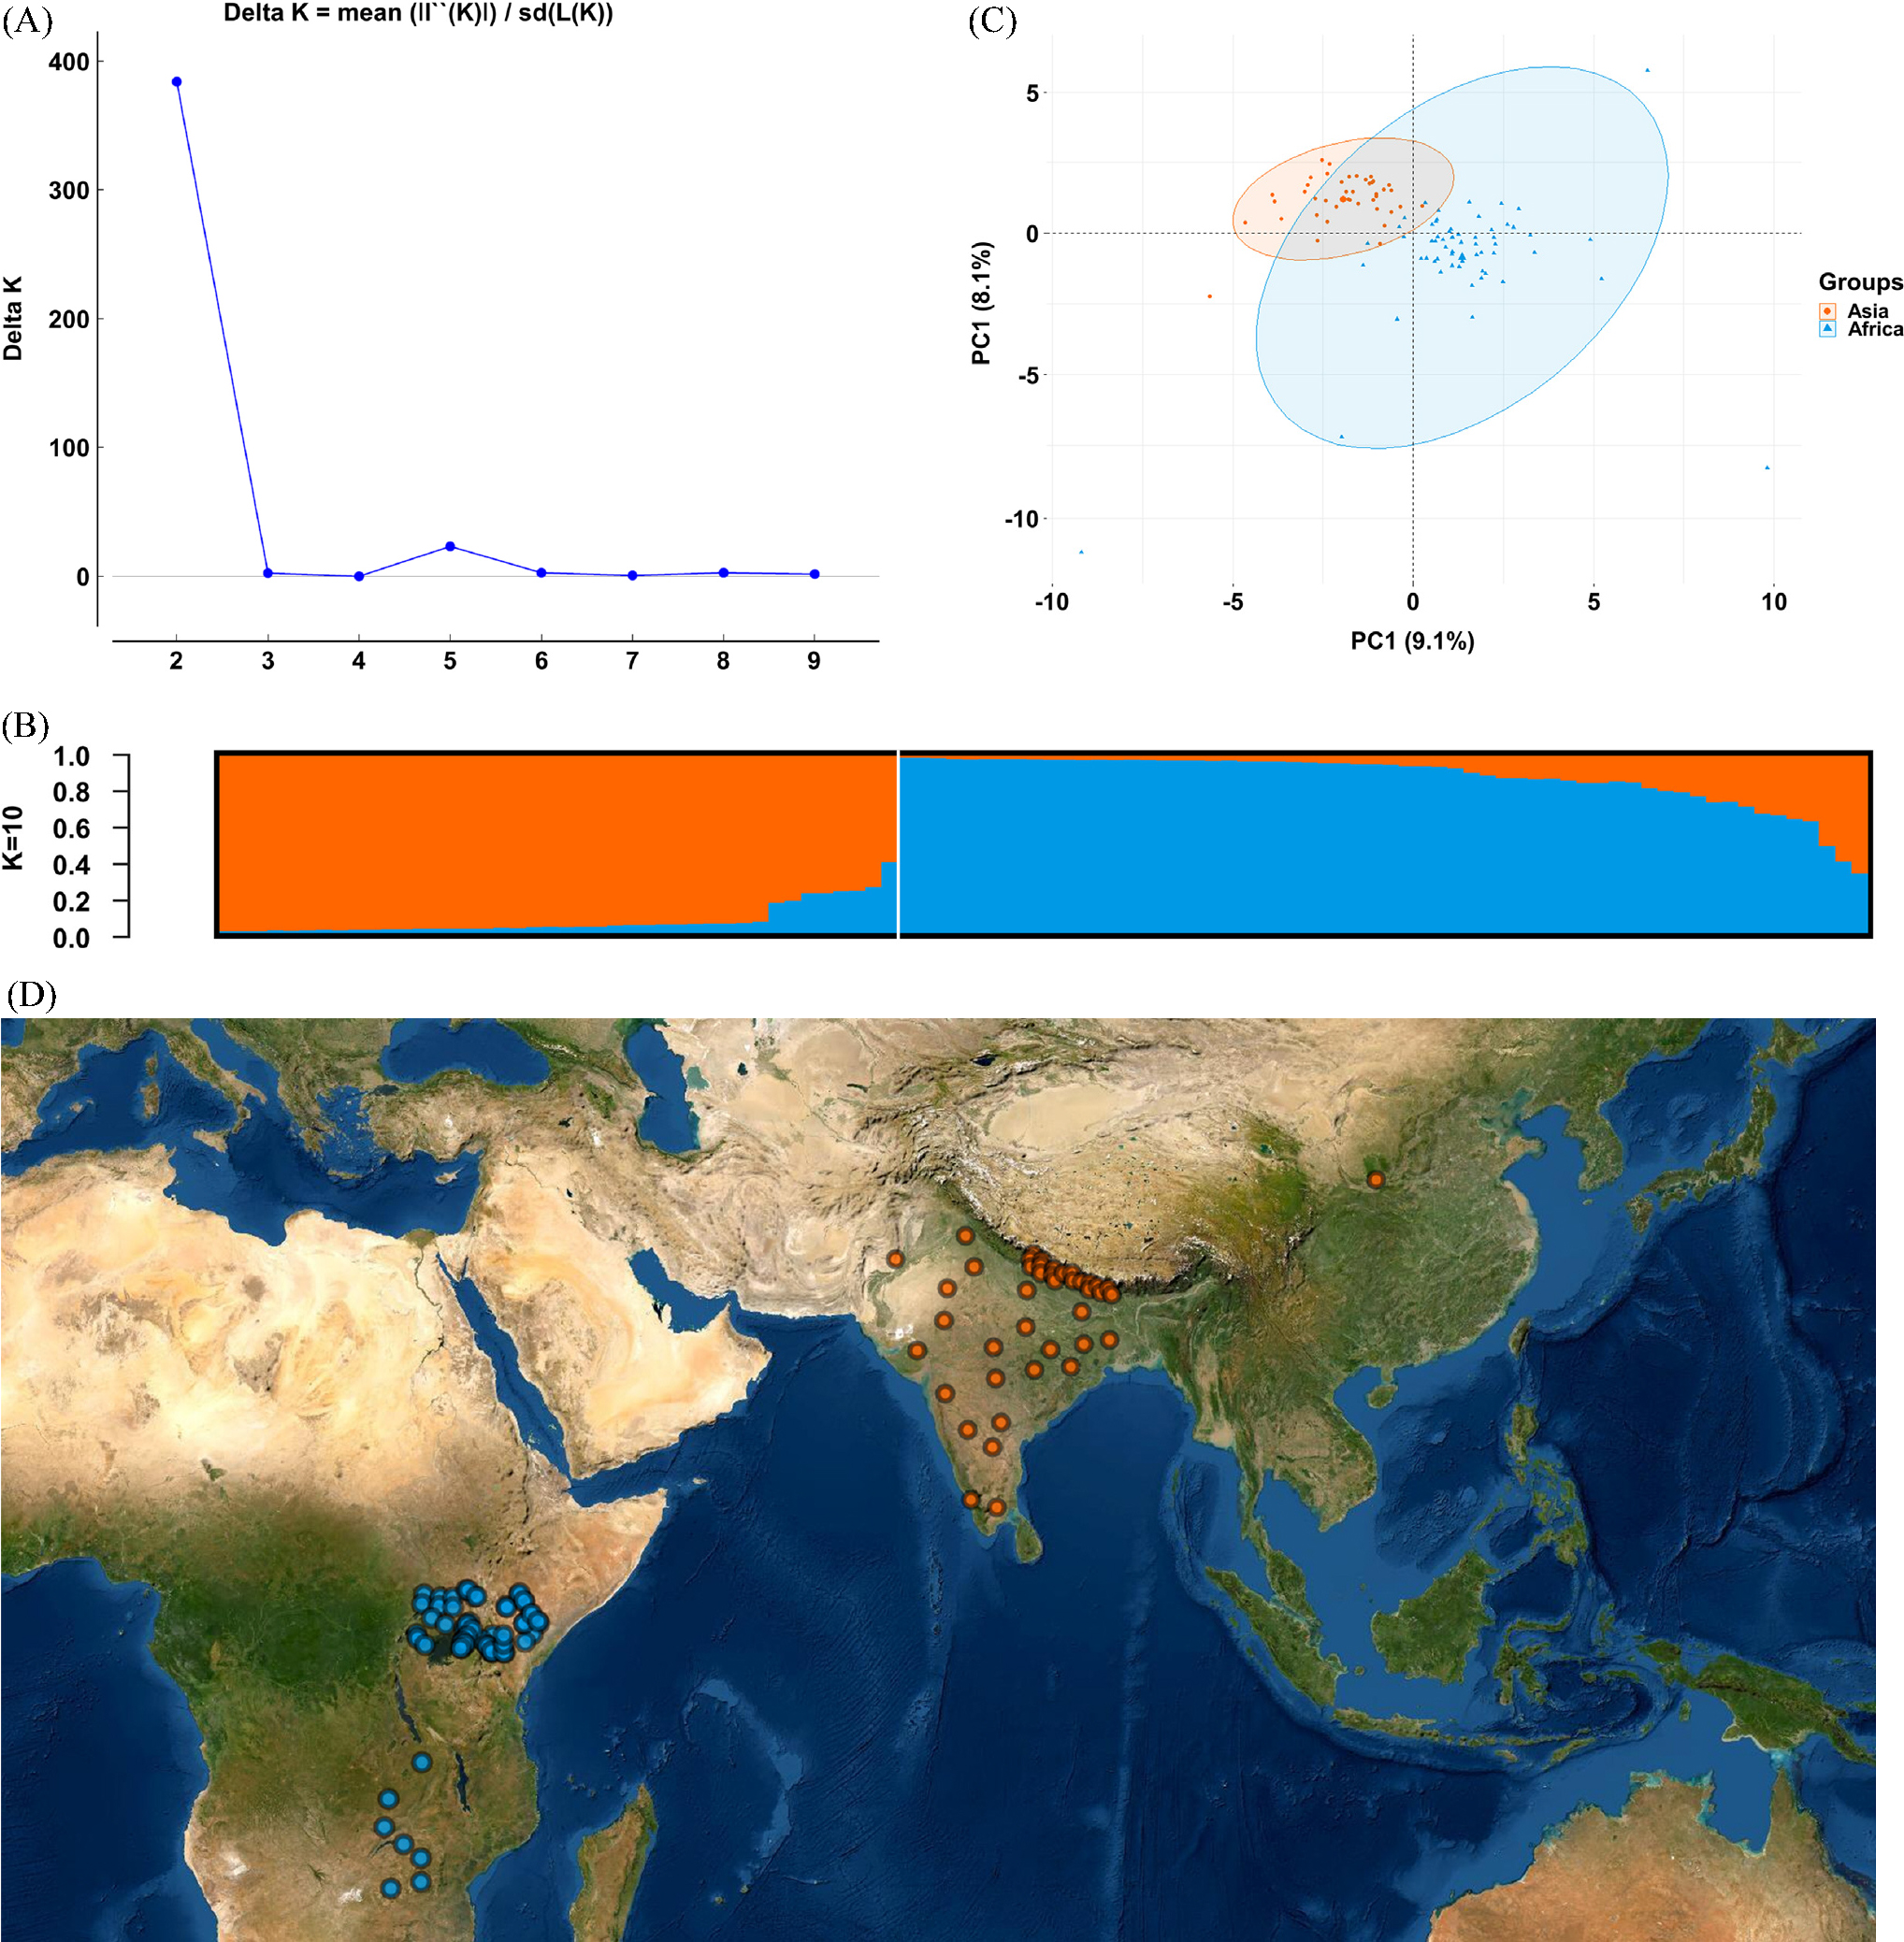
Fig. 1.
Structure analysis of 102 E. coracana individuals based on microsatellite data. (A) Estimation of population using mean of estimated lnP(D) and lnP(D)-derived delta K (log probability of data) with cluster number (K) ranging from one to ten. (B) Two estimated clusters of the 102 E. coracana individuals represented by different colors inferred by STRUCTURE analysis. (C) Principal component analysis (PCA) based on SSR data. (D) Geographical distribution for K = 2.
DISCUSSION
Due to their specificity and highly conserved nature, EST-SSR markers are an important genotyping tool used to study genetic relationships and cross transferability among crop species (Cordeiro et al., 2001). The finger millet whole-genome sequencing project was started late because the main finger millet production areas are mainly in underdeveloped countries, and because the genome is a complex allotetraploid (AABB). The first finger millet genome draft was released in 2017 (Hittalmani et al., 2017). No online genome viewer tool has been announced so far. Therefore, EST-SSR marker is still one of the most commonly used tools for exploring finger millet genetic information. For this reason, in this study, we developed EST-SSR markers for finger millet using publicly available genomic resources for switchgrass, which shares the same family and genus as finger millet. Switchgrass has a high percentage of molecular marker cross-species transferability (Pandey & Kumar, 2005) which supports the application of cross-species EST-SSRs to develop markers for minor crops.
Among 1,927 designed EST-SSRs, tri-nucleotide repeat motifs were found in higher proportion (41%) followed by di-nucleotides (33%). Among the 351 finger millet EST sequences published earlier in dbEST NCBI, 463 SSRs, di-nucleotides (11.4%), tri-nucleotides (75.4%), repeats, respectively (Arya et al., 2009) were found. In another finger millet record, di-nucleotides (54.6%), tri-nucleotides (40.7%), the proportion of di-nucleotides is higher than our result (Naga et al., 2012). The high frequency of tri-nucleotide expansions and deletions is due to the fact that these changes will not disturb the open reading frames.
The genetic structure reveals strong geographic differences. According to delta K, determine the optimal number of clusters K = 2 (Fig. 1), which corresponds to the two sampled geographic regions. This is consistent with previous research. Dida et al. (2008) used 45 SSR markers to classify finger millet cultivars into African coracana subpopulation and Asian coracana subpopulation. Kumar et al. (2016) used GBS data to analyze the population structure of 113 finger millet cultivars, and divided all germplasm into 3 subpopulations. Most of the subpopulation 1 is the East African subpopulation, and the subpopulation 2 is the Asian subpopulation. Subpopulation 3 is the hybrid Indaf varieties of African and Asian germplasm in the Finger Millet Improvement Project. The genetic background of finger millet cultivars is relatively single. Gimode et al. (2016) performed Kompetitive Allele-Specific PCR (KASP) assays on 92 SNPs and clearly distinguished wild species and cultivated species. The wild species are divided into 4 subpopulations, but the cultivated species cannot be distinguished. The phylogenetic tree shows that the genetic distance between wild species and cultivated species is much larger than the intraspecific genetic distance of cultivated species. The finger millet cultivar (E. coracana L. subsp. coracana) was domesticated from the wild East African E. coracana subsp. africana subspecies about 5000 years ago (De Wet et al., 1984). About 3000 years ago, finger millet was introduced to India and then spread further in Asia. Thus, East Africa is considered to be the center of domestication, and India is the secondary center of origin. Our results are consistent with this history of finger millet domestication and migration. The efficiency of the EST-SSR markers was assessed according to genetic relatedness among the accessions based on their grouping pattern in the neighbor-joining tree (Fig. 2). It revealed two distinct groups among the finger millet accessions. The F-statistic (Fst) show that the degree of genetic differentiation among 2 groups is high. The genetic diversity of the African group is higher than that of the Asian group, which is in line with the argument that East Africa is the center of origin. Because in general, the closer to the center of origin, the higher the diversity.
In summary, we developed 40 EST-SSR markers for finger millet utilizing cross genomic resources. And using these markers to analyze the genetic diversity and population structure of finger millet. Our findings indicated low genetic differentiation among finger millet germplasm collections. We believe that this is because the reproductive mode of finger millet (selfing or high inbreeding) promotes the formation of homozygotes and makes favorable alleles exclude rare alleles. This leads to a decrease in genetic diversity and an increase in the genetic differentiation of the two groups. The decrease in genetic diversity may make it difficult for species to withstand the drastic climate changes in recent years. Breeders’ work should focus on increasing the genetic diversity of finger millet to ensure food security in arid regions of Africa and Asia. With the development of next-generation sequencing (NGS), finger millet has also completed whole-genome sequencing (Hittalmani et al., 2017). We will also perform genotyping by sequencing (GBS) of finger millet landraces and wild species in the future, and make a linear comparison of the genomes of cultivated and wild species. The research results will help select suitable genotypes for breeding programs.
