

INTRODUCTION
MATERIALS AND METHODS
Plant material
Genotyping
Genetic diversity analysis
Phenotyping
Association analysis
RESULTS
Genetic diversity and population structure of Korean rice varieties
Phenotypic analysis
Maker-trait association analysis
DISCUSSION
INTRODUCTION
Developing new varieties of rice, the staple for nearly half of the world’s population, is crucial for enhancing food security (Awika et al., 2011). As global weather patterns and market demands change rapidly, rice breeders face an increasing challenge of accelerating crop improvement to meet the varying needs in a timely manner (Tester & Langridge, 2010). The use of DNA markers linked to the genes or quantitative trait loci (QTL) controlling agriculturally important traits can greatly improve breeding efficiency by providing the means to precisely design cross combinations, select breeding lines carrying favorable alleles, and pyramid desirable alleles of multiple genes/QTL into the elite varieties (Collard & Mackill, 2008).
Mapping genes or QTL responsible for phenotypic variation is a prerequisite for marker-assisted selection. Unlike traditional linkage mapping which normally uses a mapping population derived from a cross between two parents with contrasting phenotype (Collard et al., 2005), a collection of preexisting genetic resources is utilized in association mapping to identify trait-associated loci based on the historical recombination events accumulated during evolution/domestication/breeding (Myles et al., 2009). In spite of several inherent drawbacks (e.g. false positives/negatives arising from population structure, lack of the ability to detect causal variants with low allele frequency), association mapping is being widely utilized in rice thanks to the abundant genetic and genomic resources (McCouch et al., 2016; Verdeprado et al., 2018).
As in other crops, association mapping in rice is mostly conducted using landraces or varieties of various geographical origins to maximize genotypic and phenotypic diversity. For example, diverse rice landraces collected in China have been used successfully in association mapping to identify novel and previously-known loci associated with major agronomic traits (Huang et al., 2010, 2012). The genebank core collections are also popularly used in rice association mapping. The USDA (United States Department of Agriculture) rice mini-core collection (n=217) chosen from more than 18,000 accessions have been used to identify loci associated with yield-related traits, protein content, biotic and abiotic stress resistance (Li et al., 2011, 2012; Jia et al., 2012; Bryant et al., 2013; Schläppi et al., 2017). Similarly, a core collection (n=166) representing the diversity of over 4,400 world-wide rice varieties maintained by the Korean RDA (Rural Development Administration) genebank has been used in association mapping of various agronomic traits (Zhao et al., 2013; Li et al., 2014; Xu et al., 2016; Bao et al., 2017).
In contrast, elite breeding materials are less frequently used in association mapping because of the limited genetic variability (Zhang et al., 2016; Verdeprado et al., 2018). However, association mapping using elite germplasm adapted to a local environment has highly practical values by providing information that can be directly utilized in breeding programs (Fujino et al., 2015; Begum et al., 2015; Yano et al., 2016). In the present study, we evaluated genetic diversity of 179 commercial rice varieties (161 japonica and 18 Tongil-type) released in Korea from 1970 to 2006 and conducted association mapping of heading time, culm length, and amylose and protein content using the 161 japonica varieties.
MATERIALS AND METHODS
Plant material
A total of 179 Korean rice varieties used in this study were bred at the National Institute of Crop Science (NICS), Rural Development Administration (RDA) of South Korea from 1970 to 2006 and are composed of 161 japonica and 18 Tongil-type (indica/japonica hybridization) varieties (Supplementary Table 1). Additionally, the rice variety IR24 and its eight near-isogenic lines (NILs) carrying different bacterial blight resistance genes were included as indica subspecies checks for genetic diversity analysis. The International Rice Bacterial Blight (IRBB) NILs in the IR24 background include IRBB1 (Xa1), IRBB3 (Xa3), IRBB4 (Xa4), IRBB5 (xa5), IRBB7 (Xa7), IRBB8 (xa8), IRBB10 (Xa10), and IRBB21 (Xa21) (Huang et al., 1997).
Genotyping
DNA was extracted from young seedling leaf tissue of the 188 rice varieties described above using the CTAB method (Murray & Thompson, 1980) with minor modifications. A total of 192 polymorphic simple sequence repeat (SSR) markers evenly distributed throughout the genome (11 – 21 markers per chromosome; Supplementary Table 2) were screened from previously reported rice SSR markers (McCouch et al., 2002). PCR and gel electrophoresis were conducted as described previously (Mo et al., 2013).
Genetic diversity analysis
Summary statistics of the 192 SSRs including the allele number per locus, gene diversity, and polymorphism information content (PIC) were calculated using PowerMarker version 3.25 (Liu & Muse, 2005). For phylogeny analysis of the 188 rice varieties, the Rogers-Tanimoto dissimilarity matrix based on the 192 SSR genotype was generated to construct an unweighted neighbor-joining tree with 1,000 bootstrap iterations using DARwin version 6.0.017 (http://darwin.cirad.fr). Principal component analysis (PCA) was carried out using NTSYSpc version 2.21o (Exeter Software, Setauket, NY). Population structure was analyzed using STRUCTURE version 2.3.4 (Pritchardet al., 2000) with 50,000 burn-in iterations followed by 50,000 Markov- Chain iterations for each value of the hypothetical subpopulation numbers (K = 2 to 5).
Phenotyping
Agronomic traits including days to heading, culm length, and amylose and protein content were evaluated in 161 Korean japonica rice varieties. The plants were grown in the experimental field at NICS, RDA, Suwon, South Korea in 2008. A randomized complete block design (RCBD) with two replications was used, with an experimental unit of a row including 30 individual plants for each variety. The plants in a row were spaced by 15 cm and rows were spaced by 30 cm. The plants were cultivated and evaluated according to the standard evaluation method for rice (RDA, 2003). Days to heading was determined as the number of days from sowing to heading when 40% of the plants in a row have initiated flowering. Culm length was determined by measuring the length from the ground to the panicle node of the longest culm from each plant and the average of 10 random plants in each row was used to represent an experimental unit. Upon maturity, the plants were harvested, dehulled and milled to produce white rice and evaluate amylose and protein content. Amylose content was measured using the Juliano method (Juliano, 1971). Protein content was determined following the Kjeldahl method as previously described (AOAC, 1996).
Association analysis
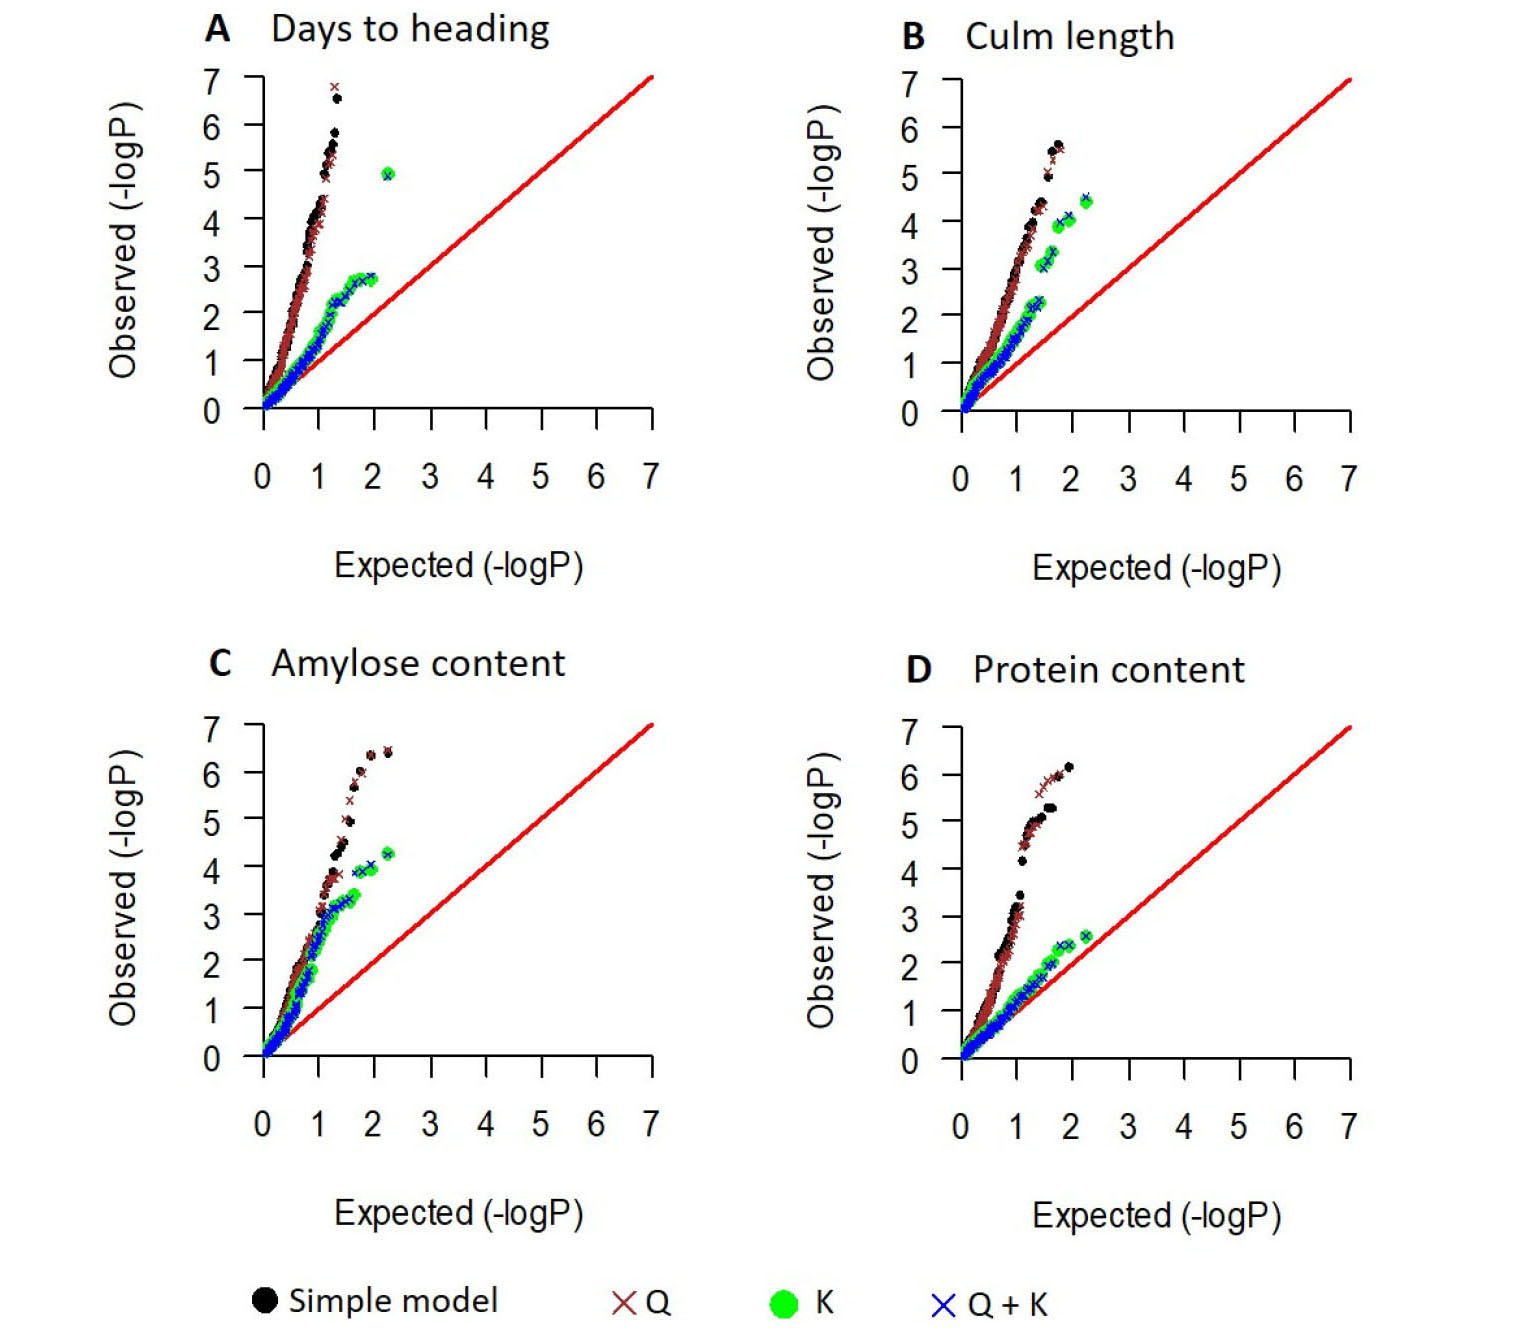
In order to minimize spurious association arising from population structure, marker-trait association was analyzed using the 161 Korean japonica varieties with the 173 polymorphic SSRs after excluding 18 Tongil-type varieties. Association analysis was conducted with four different models: the simple model (single-locus ANOVAs), the Q model considering population structure, the K model considering kinship, and the Q + K model considering both population structure and kinship. The simple model was implemented using SAS version 9.2 (SAS institute, Cary, NC, USA). The Q, K, and Q + K models were carried out using TASSEL version 3.0 with the default parameters (Bradbury et al., 2007). As population structure analysis and PCA identified two potential subpopulations within the 161 japonica varieties, membership coefficients were obtained at K = 2 using the STRUCTURE analysis as described above and were used in the Q and Q + K models. Based on quantile-quantile plots of the observed and expected P-values from the four models, the K model was selected for all four traits and used to declare significant maker-trait associations. For the significant loci identified for each trait, Pearson’s correlation analysis was conducted between the observed phenotypic values and the sums of the allelic effects using R version 3.5.1.
RESULTS
Genetic diversity and population structure of Korean rice varieties
A total of 828 alleles from the 192 polymorphic SSRs were identified among the 188 rice varieties (Table 1): 663 alleles among 161 Korean japonica varieties, 584 alleles among 18 Korean Tongil-type varieties, and 249 alleles among the indica variety IR24 and its eight IRBB NILs. In spite of the smaller number of accessions, the Tongil-type varieties had higher number of polymorphic markers (189 SSRs) than the japonica varieties (173 SSRs). Also, both gene diversity and PIC values were higher in the 18 Tongil-type varieties (0.3810 and 0.3410, respectively) than in the 161 japonica varieties (0.3075 and 0.2703, respectively), indicating that the Korean japonica rice varieties have narrow genetic diversity.
Table 1. Summary statistics of 192 SSR markers.
bThe indica cultivar IR24 and its near-isogenic lines carrying different bacterial blight resistant genes (see the materials and methods section).
Phylogenetic analysis using the 192 polymorphic SSRs clearly differentiated the 188 rice varieties according to their subspecies designation, i. e., 161 japonica, 18 Tongil-type, and nine indica (IR24 and eight IRBBs) varieties (Fig. 1A). Most Tongil-type varieties were genetically close to indica except for Nogyang which was closer to japonica and Nongan which was intermediate between indica and japonica. Similar pattern was observed in PCA, in which all the japonica varieties except for Sangnambat formed a very tight cluster that is differentiated from the Tongil-type and indica varieties by the first and the second principal components explaining 59.3% and 9.2% of the variance, respectively (Fig. 1B). Both phylogenetic analysis (Fig. 1A) and PCA (Fig. 1B) demonstrated that Korean japonica rice varieties are genetically very close to each other and thus have limited genetic diversity.
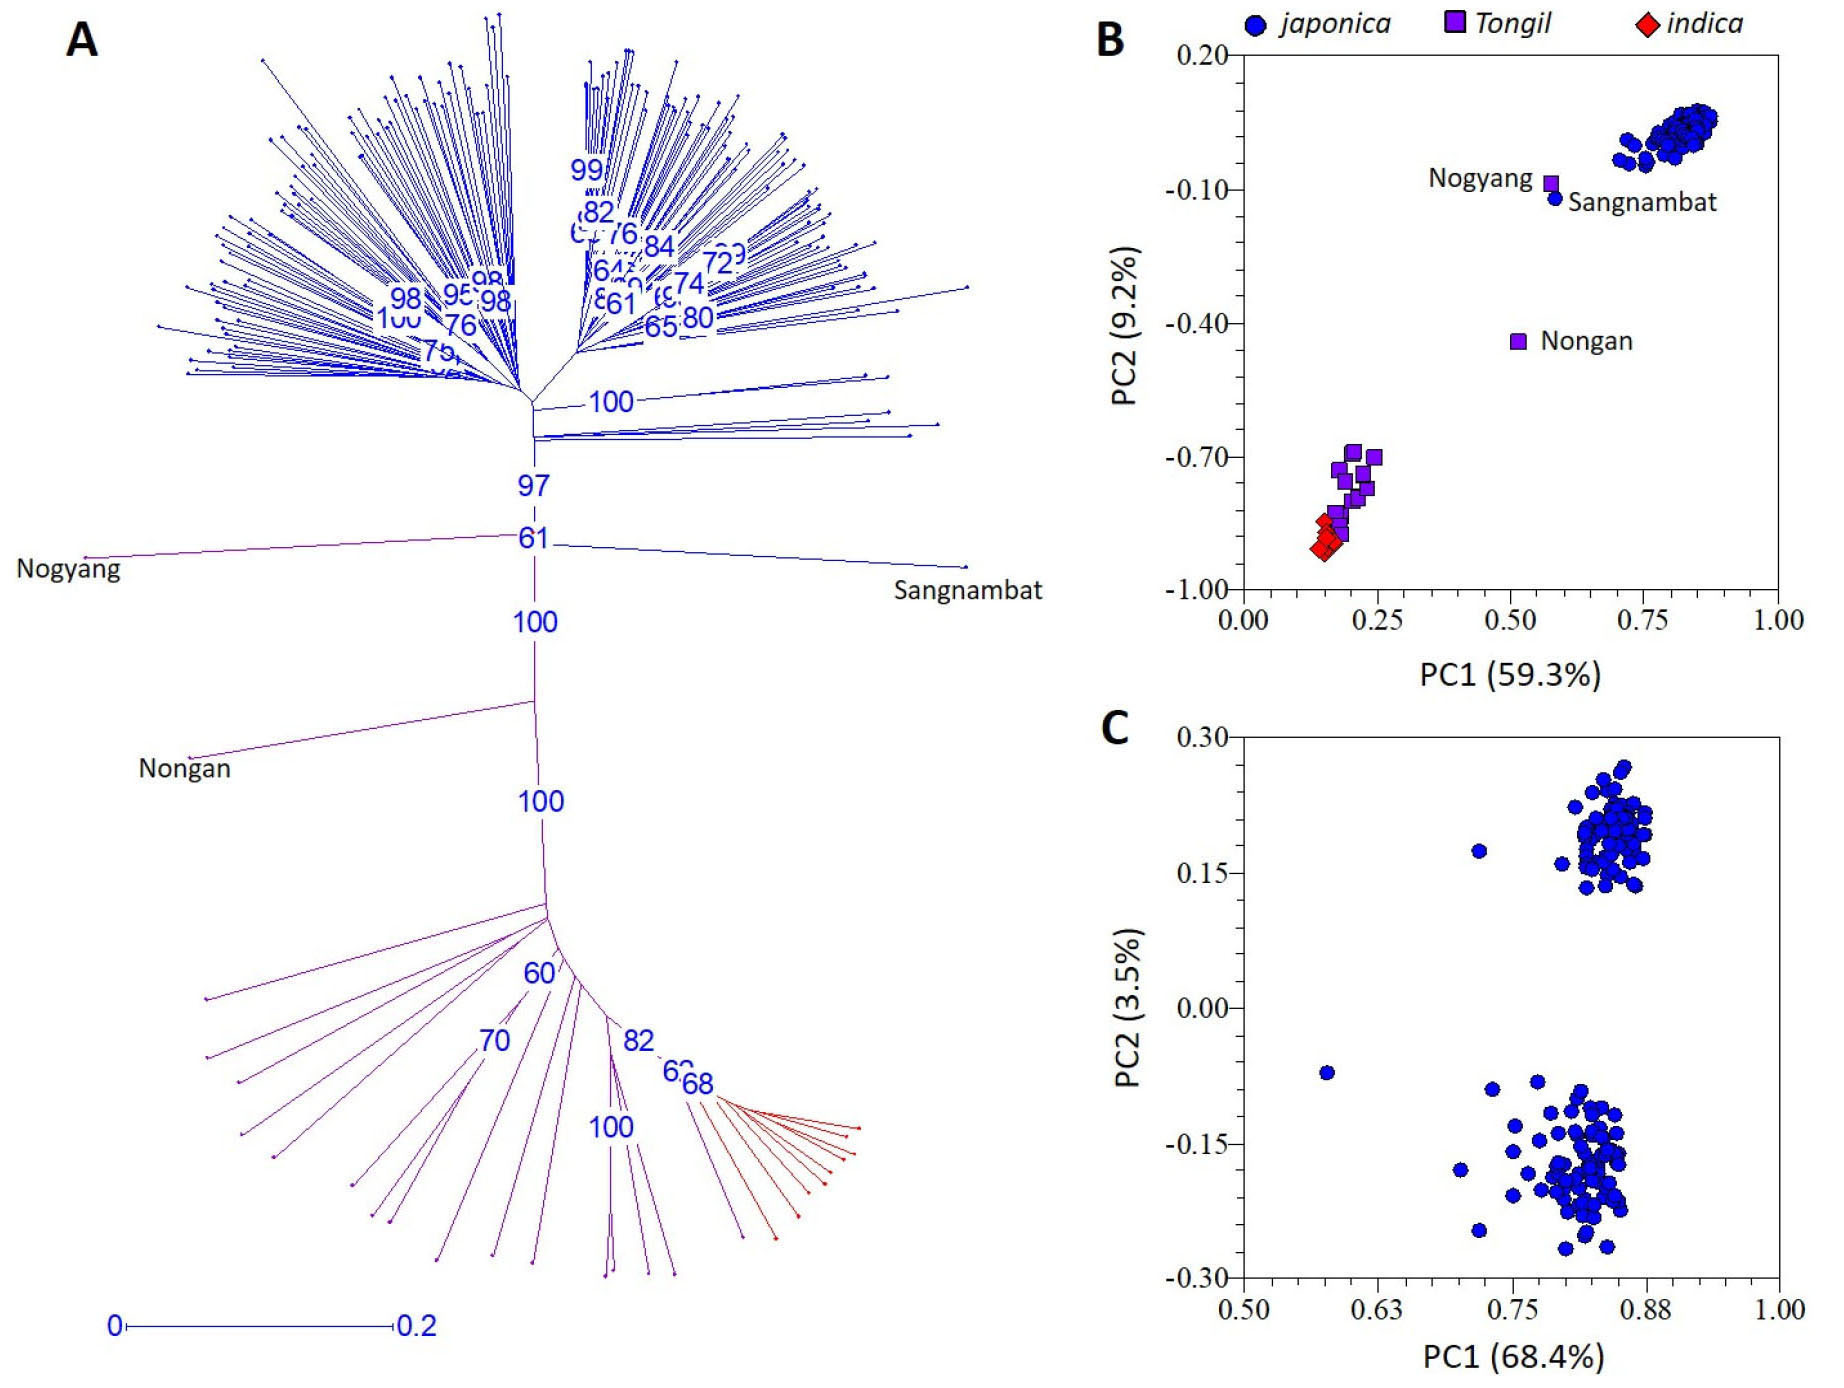
Fig. 1.
Genetic diversity of 188 rice varieties. (A) Unweighted neighbor-joining tree of 188 rice varieties using 192 polymorphic SSR markers. Blue and purple lines indicate 161 japonica and 18 Tongil-type Korean varieties, respectively. Red lines indicate the indica cultivar IR24 and its eight near-isogenic lines. Numbers in blue indicate bootstrap values (%) higher than 60%. (B) Principal component analysis of 188 varieties using 192 polymorphic SSR markers. (C) Principal component analysis of 161 Korean japonica varieties using 173 polymorphic SSR markers.
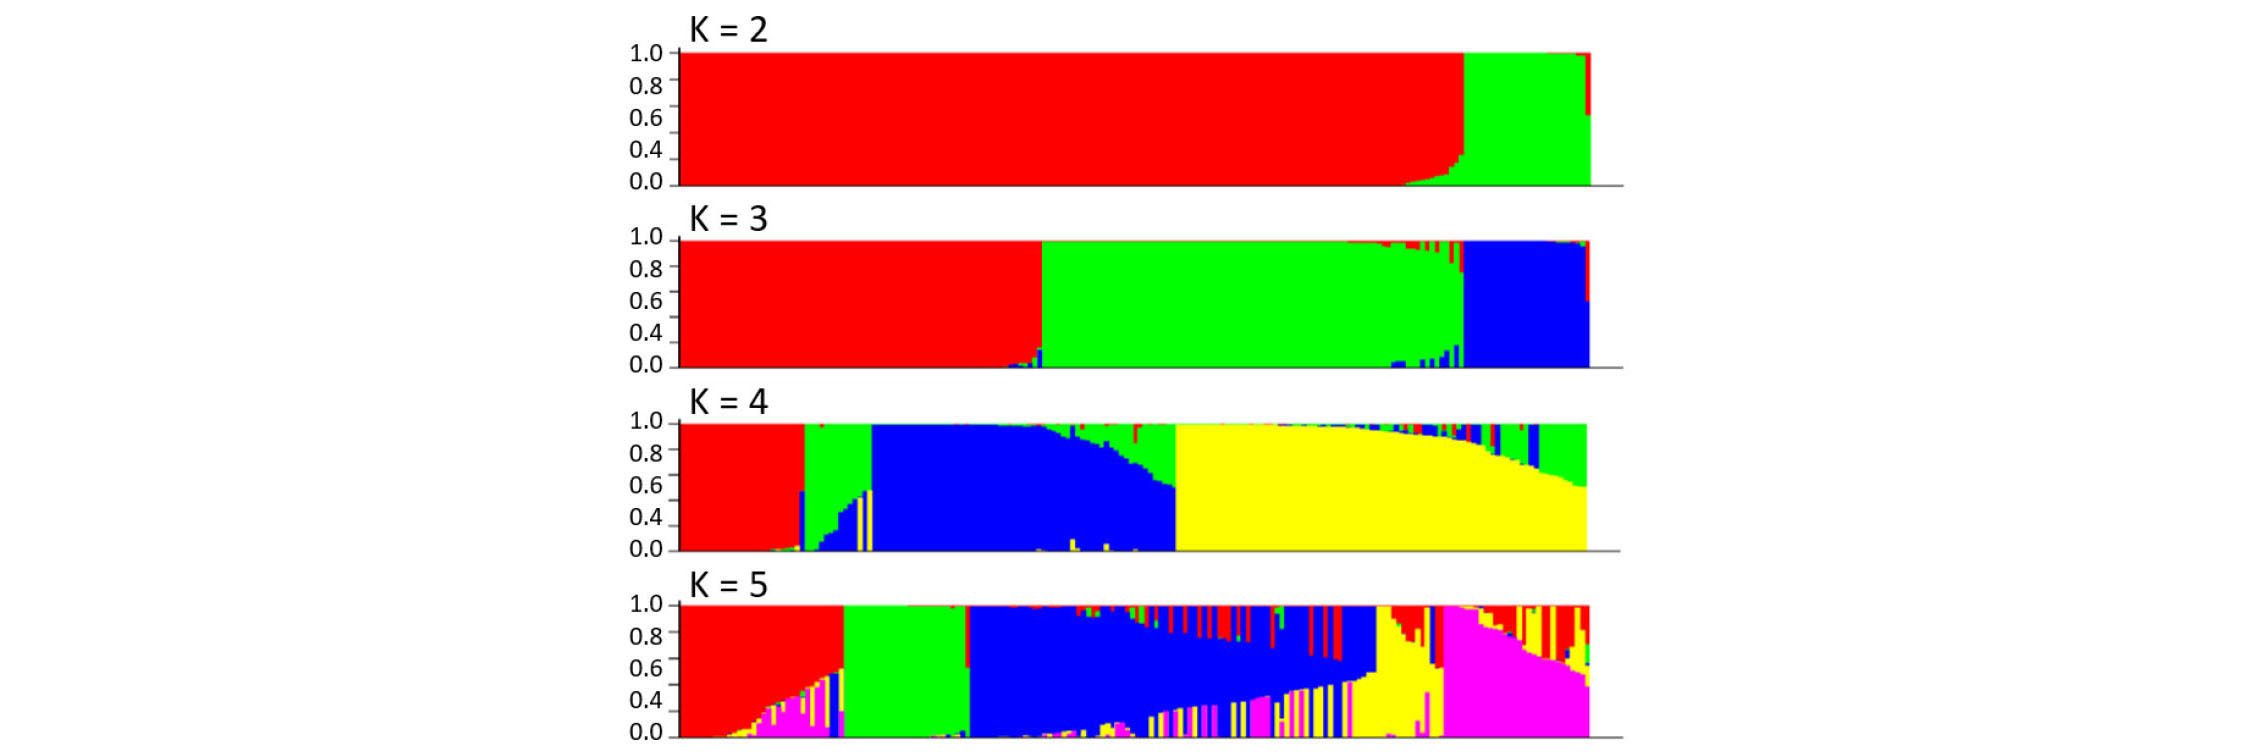
In the structure analysis conducted at K = 3 (i.e., three hypothetical subpopulations) among the 188 rice varieties, the 161 japonica varieties were further divided into two potential subpopulations (Fig. 2). In order to examine the subpopulation structure within the japonica population, an additional PCA was conducted among the 161 Korean japonica varieties using the 173 polymorphic SSRs after excluding the 18 Tongil-type and nine indica varieties (Fig. 1C). The first principal component explained 68.4% of the variance but did not classify the 161 japonica varieties. Although the second principal component divided the 161 japonica varieties into two potential subpopulations, it explained only 3.5% of the variance, indicating that the Korean japonica varieties used in this study likely belong to a single population.
Phenotypic analysis
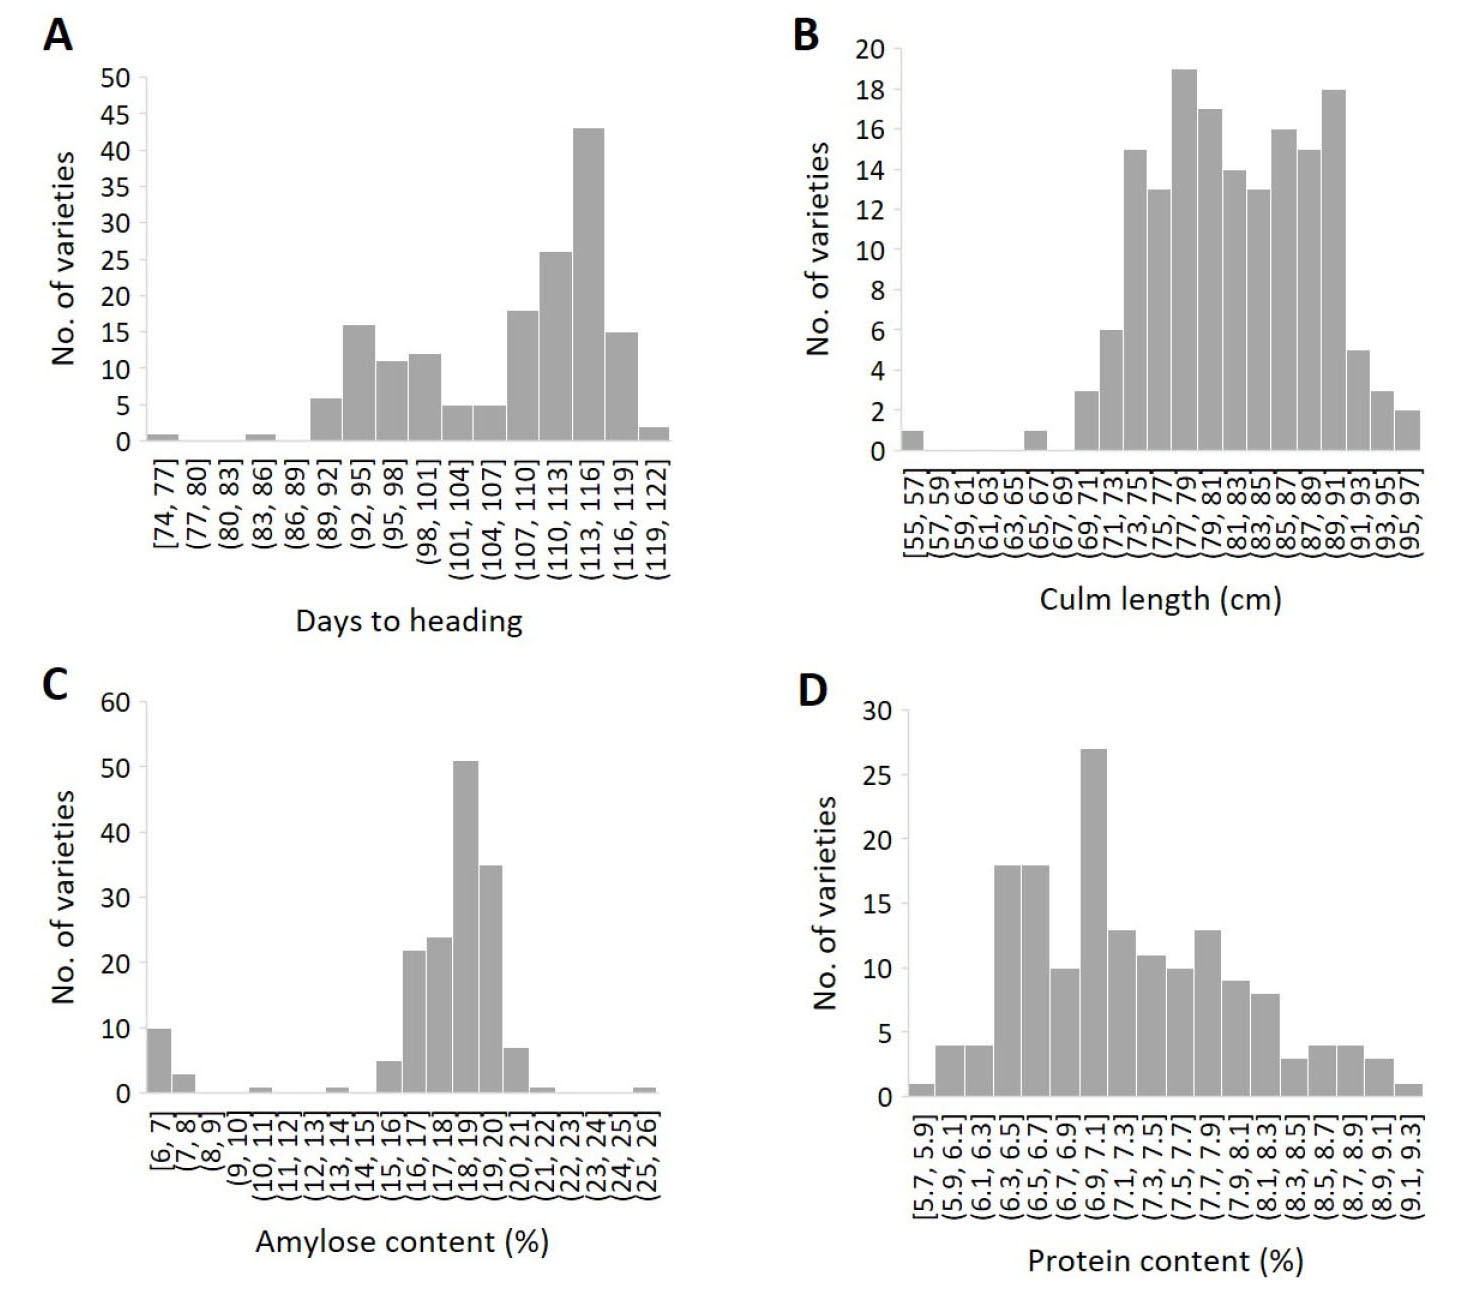
Despite the narrow genetic diversity, abundant phenotypic variation was observed in days to heading (CV 8.5%), culm length (8.1%), amylose content (20.0%) and protein content (10.2%) among the 161 Korean japonica rice varieties (Table 2, Fig. 3). The average days to heading was 107.6 days ranging from 74 to 122 days. The majority of the varieties (53%) belonged to the mid-late maturity group with >110 days to heading. The average culm length was 81.8 cm ranging from 54.8 cm to 95.8 cm and the majority (52%) belonged to the semi-dwarf group with the culm length of 75 cm – 85 cm. The average amylose content was 17.6% ranging from 6.3% to 25.9%. Amylose content of the 147 varieties categorized as the non-glutinous type ranged from 13.5% to 25.9%, while that of the 14 varieties categorized as the glutinous type ranged from 6.3% to 10.5%. The average protein content was 7.2% ranging from 5.7% to 9.2%.
Table 2. Descriptive statistics of four agronomic traits in 161 Korean japonica varieties.
Maker-trait association analysis
To minimize false positives arising from the population structure, association analysis was conducted using only the 161 Korean japonica varieties after excluding the 18 Tongil-type varieties. The quantile-quantile plots of observed and expected P-values from the four models (simple, Q, K, Q + K) indicated that for all four traits (days to heading, culm length, and amylose and protein content), adding the kinship (K) matrix in the model controls false positives effectively (Fig. 4). However, adding the population structure (Q) matrix in the model had little effect (Fig. 4), which was consistent with the PCA results (Fig. 1B, C) indicating that no significant population structure exists within the 161 japonica rice varieties. Therefore, the K model was selected to declare significant marker-trait associations.
At the threshold of P < 0.01, six, seven, and ten significant loci were identified for days to heading, culm length, and amylose content, respectively (Table 3). As only one locus was detected for protein content at P < 0.01, we used a lower threshold of P < 0.02 to declare four significant loci (Table 3). Phenotypic variance explained by the significant loci (R2) for each trait was 4.9% (RM01300) – 15.0% (RM05717) for days to heading, 6.2% (RM01300) – 16.1% (RM00152) for culm length, 4.6% (RM0 3571) – 18.3% (RM00206) for amylose content, and 5.2% (RM 05963) – 14.7% (RM05717) for protein content. Four loci were significantly associated with two or more traits – RM05963 and RM05717 for days to heading and protein content, RM01300 for days to heading and culm length, and RM01376 for days to heading, and amylose and protein content (Table 3).
We next tested the additive effects of the significant loci by analyzing correlation between the observed phenotypic values and the sums of the allelic effects of the significant loci for each trait. All four traits showed highly significant (P < 0.0001) positive correlations (Fig. 5) – days to heading (r = 0.6119), culm length (r = 0.5765), amylose content (r = 0.6301), and protein content (r = 0.4954).
Table 3. Markers significantly associated with four agronomic traits.
bOs-Nipponbare-Reference-IRGSP 1.0.
cP-values from the K model. P < 0.01 was used as the threshold for days to heading, culm length, and amylose content, whereas P < 0.02 was used for protein content.
d(1) Wu et al., 2013; (2) Yano et al., 2000; (3) Shibaya et al., 2016; (4) Zhu et al., 2011; (5) Wang et al., 1995.
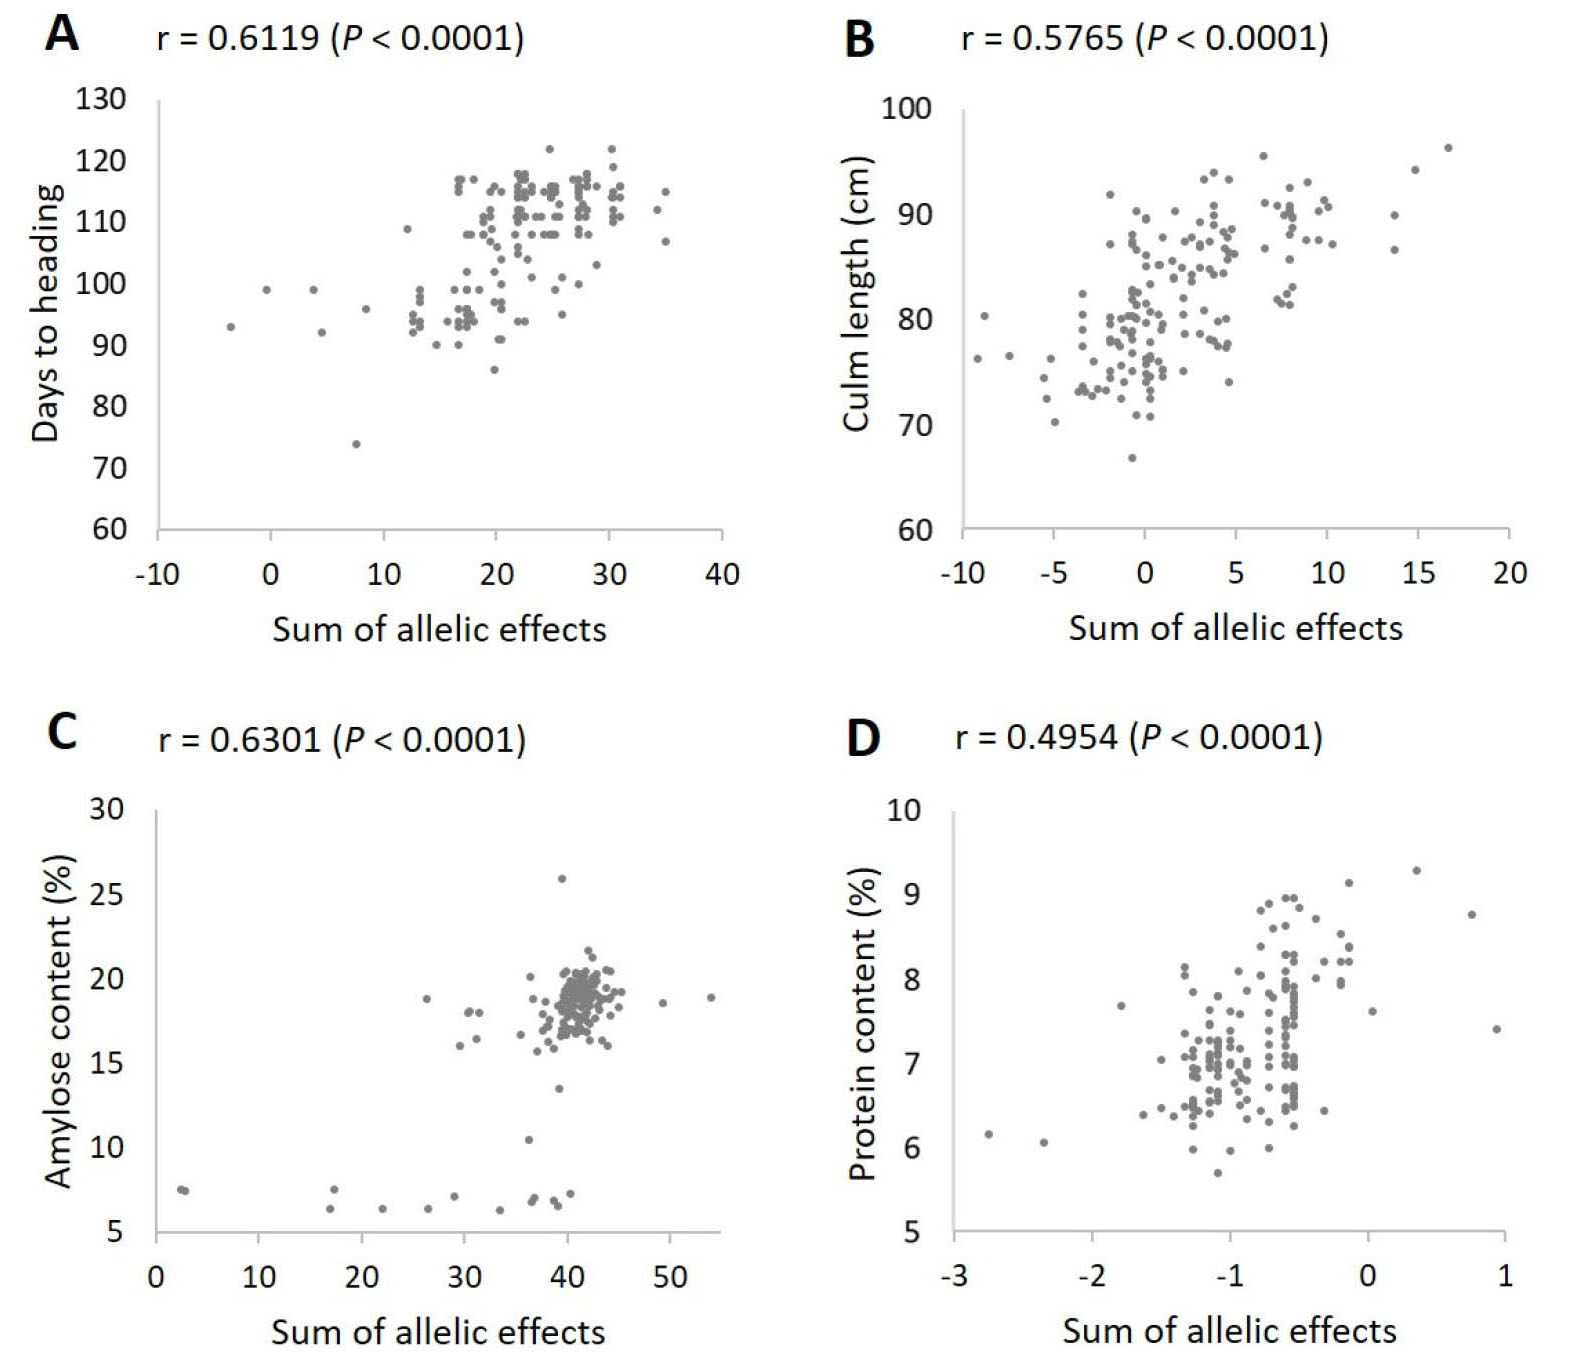
Fig. 5.
Correlation analysis between the sum of allelic effects and the observed phenotypic values for each trait. (A) Days to heading. (B) Culm length. (C) Amylose content. (D) Protein content. The allelic effects of the significant markers according to the K-model (Table 3) were used to calculate the sum of allelic effects for each trait. For culm length, two extreme outliers were excluded from the plot to better represent the correlation pattern.
DISCUSSION
Modern rice breeding programs in Korea have been focusing on two major goals – 1) developing high-yielding Tongil-type varieties to achieve self-sufficiency of rice before the 1980s, and 2) developing high-quality japonica varieties to meet the changing market demands for rice with good appearance and high eating quality since the 1980s. Tongil-type rice varieties were developed through the hybridization between the two different subspecies, japonica an indica, which broadened genetic background of the Korean rice breeding population (Chung & Heu, 1991). However, in order to maintain the marketable grain characteristics (i.e., translucent and short-grain japonica rice with relatively low amylose and protein content for palatability preferred by the Korean consumers), crosses between elite varieties with similar genetic background have been mainly used in the high-quality japonica rice breeding programs since the 1980s. This resulted in the narrow genetic diversity among the Korean japonica rice varieties. By genotyping 179 rice varieties (161 japonica and 18 Tongil-type) released in Korea from 1970 to 2006 with 192 polymorphic SSRs evenly distributed throughout the genome, our study molecularly demonstrated that Korean japonica rice varieties have very narrow genetic diversity. Despite the greater number of accessions, the PIC and gene diversity values from the japonica varieties were smaller than those from the Tongil-type varieties (Table 1), and both phylogenetic analysis and PCA showed that Korean japonica rice varieties are genetically very close to each other (Fig. 1). Our results are consistent with the previous works showing the limited genetic background of Korean japonica rice varieties, many of which share common elite japonica parents in the pedigree (Kwon et al., 1999; Song et al., 2002).
Elite breeding lines developed for a specific target region have limited genotypic and phenotypic variation compared to diversity panels such as world-wide landraces/varieties collections, therefore are rarely used in association mapping. While association mapping with a diversity panel can be powerful for identifying new genes/loci controlling important agronomic traits, accessions with diverse geographical origins often have strong population structure resulting in the high rate of spurious associations (Myles et al., 2009; Zhang et al., 2016). This is especially the case for traits strongly correlated with population structure such as heading time, and it is difficult to solve this issue using statistical models (Huang et al., 2010, 2012). Also, the effects of alleles identified from a diversity panel should be validated in the genetic background of local varieties prior to be utilized in breeding programs (Verdeprado et al., 2018). In contrast, local breeding lines such as the Korean elite japonica population used in this study have much less complex population structure, and loci/alleles identified from these populations can be directly utilized for breeding. To exploit such advantages, association mapping studies in elite rice panels have been recently conducted using Japanese japonica varieties (Yano et al., 2016), local varieties in Hokkaido region of Japan (Fujino et al., 2015; Shinada et al., 2015), and advanced indica breeding lines from the International Rice Research Institute (Begum et al., 2015), identifying agronomically important loci and alleles that can be directly applied in breeding programs.
As the Korean japonica rice varieties used in this study possessed abundant phenotypic variation (CV 8.1% – 20.0%; Table 2, Fig. 3) in spite of the limited genetic diversity, we were able to successfully identify loci significantly associated with days to heading, culm length, and amylose and protein content (Table 3). Some of the identified loci corresponded to the previously cloned genes such as DTH2 (RM05631; Wu et al., 2013), Hd1 (RM05963; Yano et al., 2000), and Hd18 (RM0 1376; Shibaya et al., 2016) for days to heading, SUI1 (RM0 6324; Zhu et al., 2011) for culm length, and Wx (RM03805; Wang et al., 1995) for amylose content, while others were previously uncharacterized loci (Table 3). The additive allelic effects of these loci for each trait showed highly significant positive correlation with the observed phenotypic values (Fig. 5), indicating that these loci can provide useful information for designing cross combinations and predicting progeny performance in the local breeding programs.
However, owing to the limited number of SSR markers used in this study, we were not able to precisely designate candidate genes underlying the identified loci and analyze allelic/haplotypic diversity of the potential causal genes. Another limitation of this study is that the phenotypic data was available from a single location for only one year, which precluded the opportunity to evaluate environmental variation and reduce experimental errors. To complement the present work, we have initiated genotyping-by-sequencing experiments of the rice varieties used in this study and the additional ones released in Korea since 2007 to increase the marker density and improve the mapping resolution. Phenotypic evaluations are also being conducted on additional traits including yield components, grain quality, biotic and abiotic stress resistance in three different locations (i.e., Suwon, Wanju and Miryang in South Korea) for multiple years (Lee et al., 2019). This is expected to improve our understanding of the genetic basis underlying variation in agronomically important traits in locally adapted elite rice germplasm and provide molecular tools to enhance the efficiency of crop improvement.
SUPPLEMENTARY
Supplementary Table 1. Korean rice varieties (179 in total) used in this study.
Supplementary Table 2. SSR markers (192 in total) used in this study.
