

서 론
한국 및 대부분의 아시아 국가들은 하루 영양의 60-70%를 쌀로 채운다. 벼(Oryza sativa L.)는 세계의 중요한 식량작물 중 하나이며 세계의 절반 이상 인구가 주요한 식량 자원으로 쌀을 먹는다. 1980년대 녹색 혁명으로 인해 쌀 생산량이 두 배 이상 증가해왔으며, 1990년대 후반부터는 명백한 안정 상태에 가까워지고 있다. 그렇지만 계속 증가하는 특히 아시아 인구의 수요를 충족하기 위해서는 2020년까지 50% 이상의 쌀이 요구된다(Choung et al., 2004). 또한, 태풍과 같은 기후 변화 때문에, 쌀의 출수를 조절하거나 수확 손실을 방지하기 위해 생식 주기를 단축할 필요성도 가진다. 벼는 우리나라의 대표적인 여름작물 이면서 품종별 분화가 기후조건을 잘 반영하고 있다. 우리나라의 집중적인 여름장마 뒤, 화창한 여름 및 가을날씨는 벼 낱알의 등숙에 유리한 날씨이므로 이삭 수가 적으나 이삭이 크고, 생육초기 일조가 풍부하여 이삭 수 확보가 유리한 기후지대 또는 산간지에 알맞은 수중형 품종이 집중적으로 육성되어 재배되어 오고 있다. 조생종은 보통 중생종이나 중만생종에 비해 생육 기간이 짧아 타 품종에 비해 일찍 수확하며 대체로 기온이 낮은 산간 지방을 중심으로 재배된다. 조생종 벼는 일반적으로 중생종이나 중만생종 벼에 비해 수량성이 낮다(Choung et al., 2004). 만생종의 경우는 우리나라에서는 현재 권장하거나 재배하는 품종이 거의 없으며, 중생종과 만생종의 중간형인 중만생종을 따로 구분하고 있다. 조생종 벼가 가지는 몇 가지 이점 즉, 냉해에 대한 적응성이나 빠른 수확에 의한 시세 차익과 같은 것들을 제외하면, 일반적으로 농민은 중생종이나 중만생종을 조생종보다 선호하고 있다. 반면 중생종이나 중만생종 벼는 저온에의 내성이 조생종 벼에 비해 약하기 때문에 기온이 낮은 곳에서 재배하는 것이 어렵다. 이러한 특성을 통해 조생종이며 수중형인 벼 품종을 개발하면 각각의 장점을 살린 이로운 품종을 만들 수 있으며 식량문제를 해결할 수 있다. 그러므로 본 실험은 출수기와 수량에 관련된 양적형질에 대한 유전자좌(quantitative trait loci : QTL) 분석을 통해, 조생종이면서 수중형인 벼 품종을 개발하는 것이 목적이다.
재료 및 방법
식물 재료
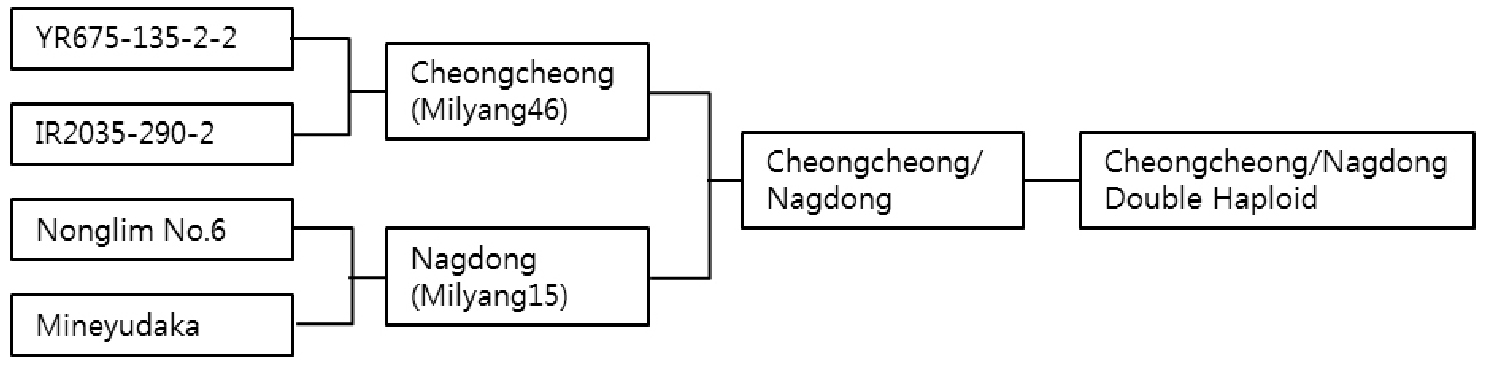
본 연구의 재료로는 청청과 낙동을 교배하여 약배양한(CNDH) F9세대 120 계통을 사용하였다(Fig. 1). 공시된 CNDH 계통은 경북대학교 실습 포장에서 계통별로 재배하여 채종하였다.
재배 및 생육조사
파종은 2017년 4월 28일 수행하였고, 제초제 및 살충제 살포는 병해충 방제 및 포장관리는 농촌진흥청 벼 표준재배법에 준하여 실시하였다(농촌진흥청, 2000). 유전적 농업형질 변이 파악을 위해 생육조사를 시행하였다. 농업적 형질에는 출수기(Heading date : HD), 수수(Panicle number), 수장(Panicle length, cm), 간장(Clum length, cm), 천립중(Thousand grain weight : TGW, g), 수량(Yield : Y) 등이 있다. 먼저 농업적 형질 중에 출수기의 비교 방법을 알아보면 CNDH (Cheongcheong/Nagdong doubled haploid) 집단의 파종일부터 출수기까지의 일수를 계산한다. 그리고 수수는 CNDH 집단의 분얼수를 10 반복하여 측정한다. 수장과 간장 또한 CNDH 집단의 분얼수를 10 반복하여 측정한다. 천립중의 측정은 CNDH 집단의 벼를 수확하여 정조의 천립중을 측정한다. 천립중을 셀 만큼 정조의 수가 부족하면 백립중을 재어서 10을 곱한다. 마지막으로 수량의 측정은 CNDH 집단의 10주 당 정조무게(Ten paddy rice weight : TPW), 수분함량(Moisture : M), 천립중을 조사하여 예상 수량 식에 넣어서 계산한다. 이처럼 생육조사를 위해 CNDH의 간장, 수장, 수수를 계통 당 10 반복하여 측정하였고, CNDH의 이삭이 40~50% 출수한 때의 출수기와 수량특성을 위해 계통별 10주 무게 (10주 당 정조무게), 수분함량, 천립중을 측정하였다. CNDH의 생육양상을 알기 위해 간장, 수장, 수수, 천립중의 도수분포표를 그렸다. CNDH의 10a당 예상 수확량을 알기 위해 수량 data 공식을 이용하였다. 10a당 예상 수확량(kg) = {총무게×(100-조사된 수분함량)}÷(100-15) 이다. 이 식에서 15는 15%의 수분함량을 기준으로 잡았다는 것을 의미한다. 또한 총무게(종자와 종자봉투 포함무게) = 10주 무게 ÷ 벼 1포기 당 주수 이다. 10a 당 예상수확량 자료와 BLB (Bacterial Leaf Blight) data를 토대로 Sigma Plot program (2001 for windows version 7.0)을 이용하여 CNDH의 출수기, 10주 무게, 수분함량, 천립중의 도수분포표를 그렸다.
양적형질 유전자좌(QTL)분석
CNDH 집단의 출수기, 10주 무게, 수분함량, 천립중, 예상수량 QTL 분석은 WinQTL Cartographer 2.5 program을 사용하였고 신뢰도가 높은 QTL을 찾기 위하여 3.0 이상의 LOD (logarithm of odds) 값을 선택하였다. QTL 분석 후 나온 contig 내의 단백질들의 역할을 조사하였다. CNDH 집단의 gene locus 조사에는 Rice Expression Profile Database (RiceXPro)를 이용하였다. 유전자의 기능 조사에는 National Center for Biotechnology Information (NCBI)의 정보를 참고하였다.
결과 및 고찰
생육조사
생육조사 후 2017년 CNDH 계통과 모본, 부본인 청청, 낙동의 간장, 수장, 수수, 천립중, 출수기의 평균과 표준편차를 정리한 표에서 청청, 낙동의 평균값과 CNDH 계통의 평균값이 유사한 것을 확인할 수 있다. 수량 특성을 비교하였을 때는 10주 무게, 수분함량, 천립중은 청청, 낙동의 평균값과 CNDH 계통의 평균값이 유사하였고, 수량은 청청, 낙동의 평균값보다 CNDH 계통의 평균값이 높았다(Table 1). 분포도 내에서 CNDH 계통의 모본, 부본인 청청과 낙동 위치는 각각 검은색과 흰색 화살표로 표시하였고 간장, 수장, 수수, 천립중, 출수기 특성이 모두 대체적으로 정규분포표를 띠는 것을 볼 수 있다. 수량 특성인 10주 무게, 수분함량, 천립중의 도수분포표 또한 네 가지 특성이 모두 대체적으로 정규분포를 띠었다(Fig. 2).
Table 1. The plant traits of 120 DH lines derived from a cross of Cheongcheong and Nagdong.
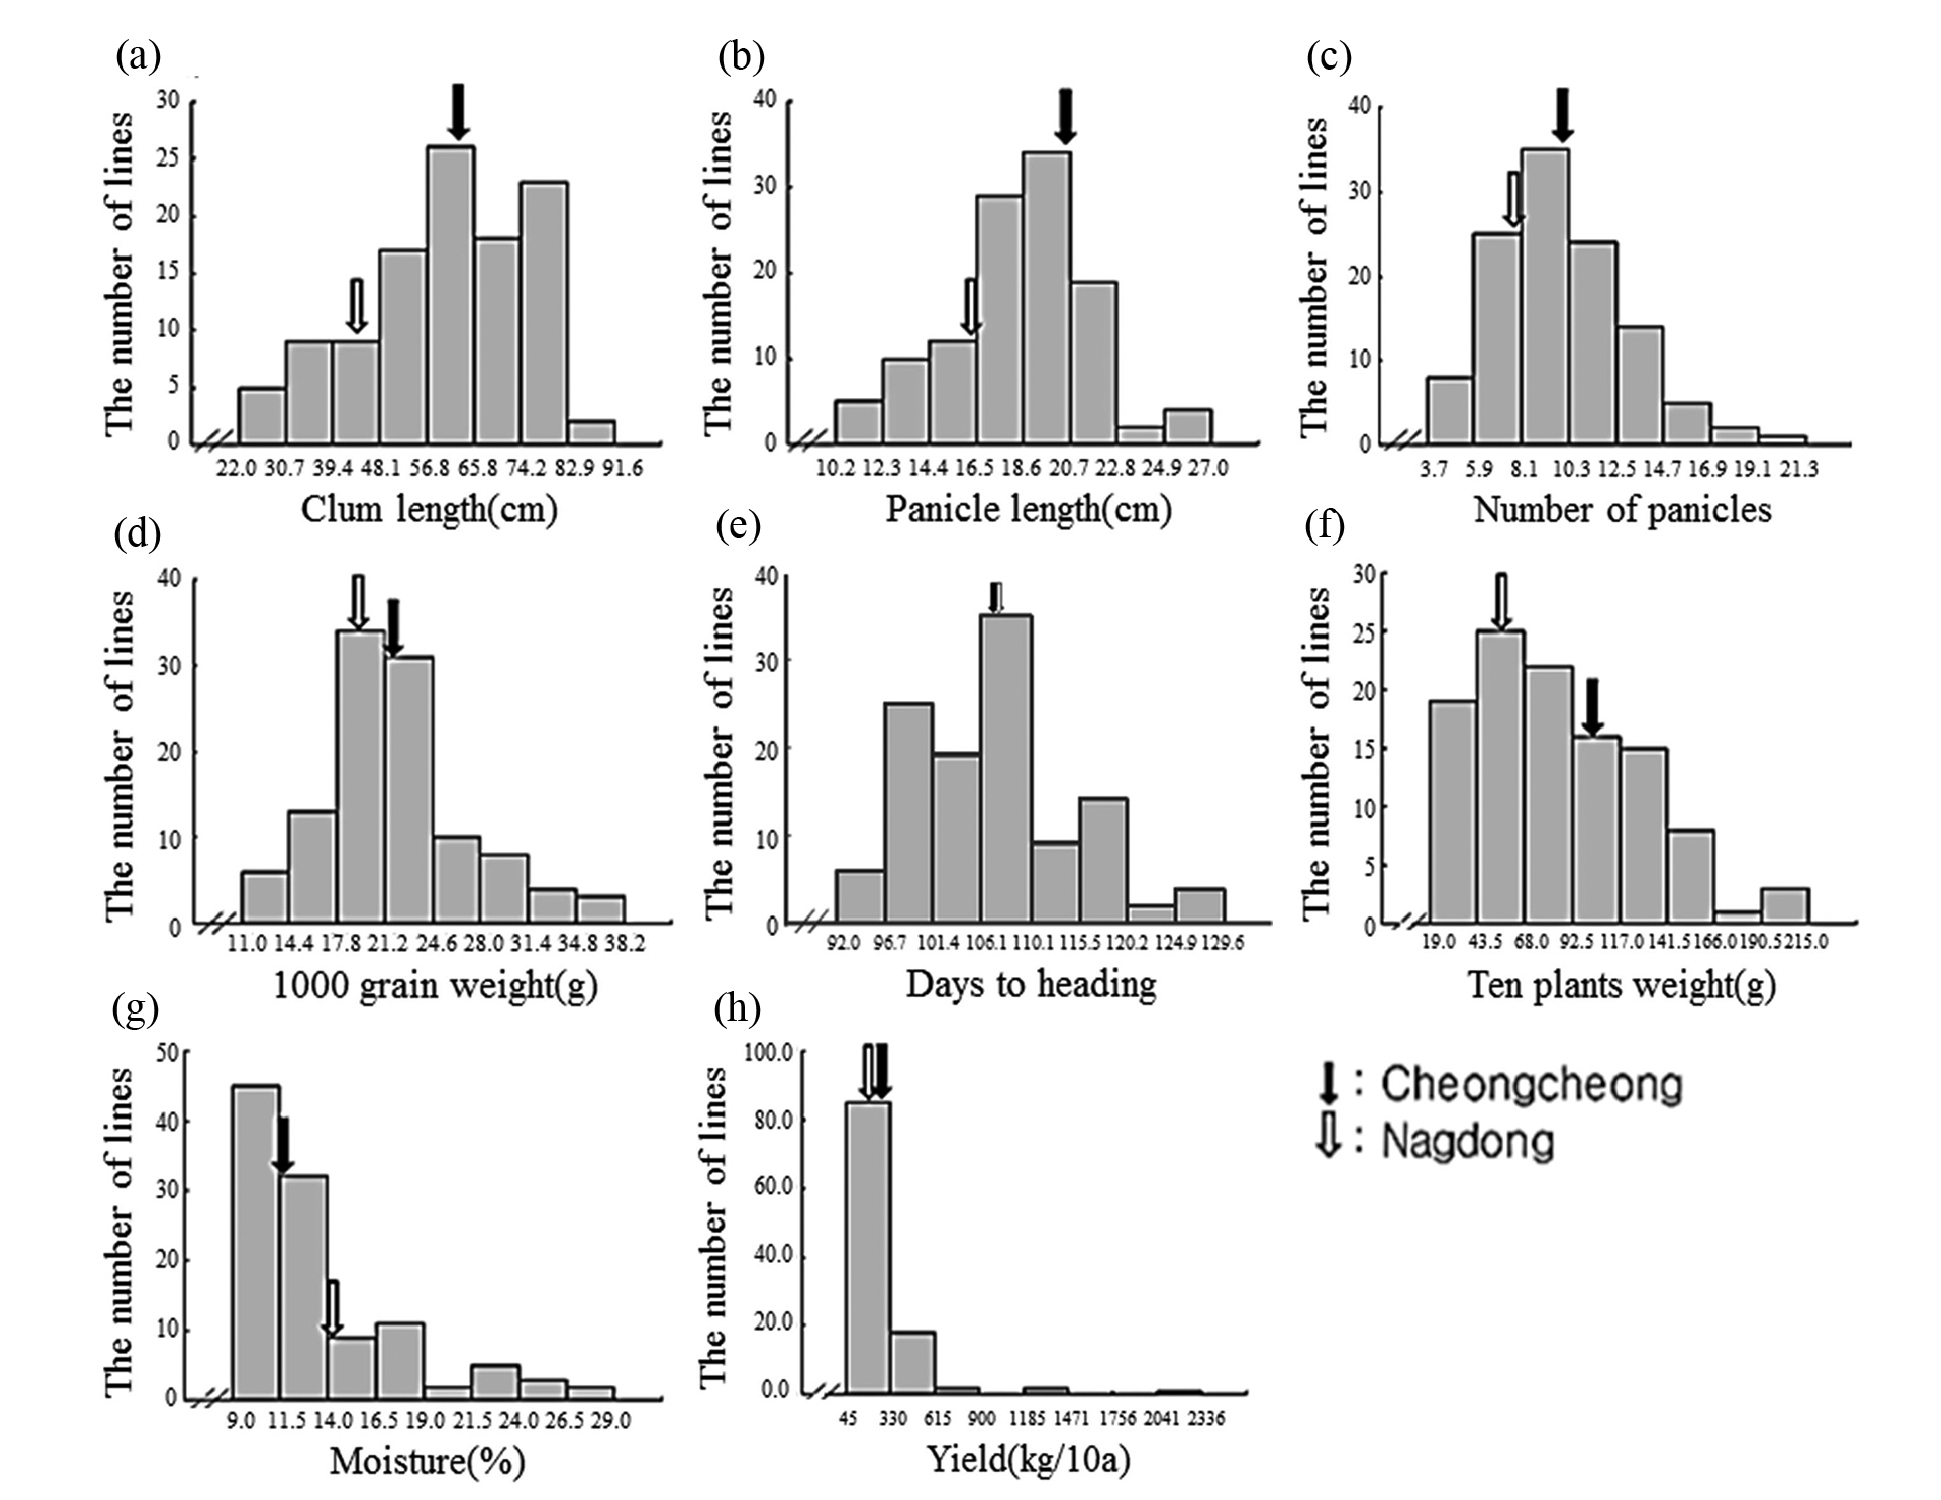
Fig. 2.
The frequency distributions for growth survey in CNDH lines. The black arrow represents Cheongcheong and the white arrow represents Nagdong. (a) Culm length. Cheongcheong : 62.9 cm, Nagdong : 44.6 cm. (b) Panicle length. Cheongcheong : 19.2 cm, Nagdong : 16.1 cm. (c) The number of panicles. Cheongcheong : 10.1, Nagdong : 7.8. (d) 1000 grain weight in CNDH lines. Cheongcheong : 22.0 g, Nagdong : 19.8 g. (e) Days to heading. Cheongcheong : 107.1 days, Nagdong : 107.8 days. (f) Ten plants weight. Cheongcheong : 99.8 g, Nagdong : 54.0 g. (g) Moisture. Cheongcheong : 12.3%, Nagdong : 14.6%. (h) Yield. Cheongcheong : 327.8 kg, Nagdong : 115.8 kg.
QTL 분석
염색체 8번에서 나타난 출수기 QTL 분석 결과, LOD값은 2.85, TR2 (second determination coefficient) 값은 0.24, 상가적효과값(Additive effect)은 -8.86을 나타내었다(Table 2). 벼 물리지도를 이용해 QTL로 잡힌 maker 구간을 contig 분석하여 LOD값과 가장 가까운 sequence 하나를 선발하였다. Sequence내의 유전자들은 3개가 나타났고, 세포 기능과 관련이 있었다. 염색체 2에서 나타난 10주 무게를 QTL 분석한 결과, LOD 값은 5.39, TR2값은 0.35, 상가적효과값은 18.80을 나타내었다(Table 2). 벼 물리지도를 이용해 QTL로 잡힌 maker 구간을 contig 분석하여 LOD값과 가장 가까운 sequence 하나를 선발하였다. Sequence내의 유전자들은 3개가 나타났고, 세포 기능, 식물 방어와 관련이 있었다. 염색체 2에서 나타난 수분함량 QTL 분석 결과는 2개가 나타났다. 각각, LOD 값은 3.08, 3.92, TR2값은 0.32, 0.31, 상가적효과값은 1.83, 2.07을 나타내었다(Table 2). 수분함량 QTL로 잡힌 첫 번째 maker 구간을 벼 물리지도를 이용해 contig 분석하여 LOD값과 가장 가까운 sequence 하나를 선발하였다. Sequence내의 유전자들은 3개가 나타났고, 세포 기능, 호르몬 signaling과 관련이 있었다. 특히 그 중 하나는 Rcd1 단백질로 벼에서 스트레스와 호르몬과 발달 반응의 중요한 조절 인자로 보고되어있다(Jaspers, P. et al., 2009). 다음으로 수분함량 QTL로 잡힌 두 번째 maker 구간을 벼 물리지도를 이용해 contig 분석하여 LOD값과 가장 가까운 sequence 하나를 선발하였다. Sequence내의 유전자들은 12개가 나타났고, 세포 기능과 산화 환원 signaling, 호르몬 signaling과 관련이 있었다. 그 중 OsERF3은 벼에서 에틸렌 합성 및 쌀 가뭄 내성에 있어 전사를 조절한다고 보고되어있다(Wan L. et al., 2011). 염색체 7번에서 나타난 수분함량 QTL 분석 결과, LOD 값은 3.0, TR2값은 0.40, 상가적효과값은 -2.59를 나타내었다(Table 2). 벼 물리지도를 이용해 QTL로 잡힌 maker 구간을 contig 분석하여 LOD값과 가장 가까운 sequence 하나를 선발하였다. Sequence내의 유전자들은 7개가 나타났고, 세포기능, 식물 방어와 산화 환원 signaling과 관련이 있었다. 염색체 2번에서 나타난 천립중 QTL 분석 결과로, LOD 값은 4.80, TR2값은 0.28, 상가적효과값은 3.76 를 나타내었다(Table 2). 벼 물리지도를 이용해 QTL로 잡힌 maker 구간을 contig 분석하여 LOD값과 가장 가까운 sequence 하나를 선발하였다. sequence내의 유전자들은 5개가 나타났고, 산화 환원 signaling, 호르몬 signaling과 관련이 있었다. 그 중 하나는 MtN3 단백질로 벼에서 식물 성장, 발달 및 환경 스트레스에 대한 반응에서 여러 기능에 관여한다고 보고되어있다(Yuan et al., 2014). 염색체 3번에서 나타난 천립중 QTL 분석 결과 LOD 값은 3.22, TR2값은 0.30, 상가적효과값은 -3.82를 나타내었다(Table 2). 벼 물리지도를 이용해 QTL로 잡힌 maker 구간을 contig 분석하여 LOD값과 가장 가까운 sequence 하나를 선발하였다. Sequence내의 유전자들은 14개가 나타났고, 세포 기능, 호르몬 signaling과 관련이 있었다. 염색체 10번에서 나타난 천립중 QTL 분석 결과 2개가 발견되었다. 각각 LOD 값은 3.4, 3.09, TR2값은 0.26, 0.25, 상가적효과값은 -2.97, -2.93을 나타내었다(Table 2). 천립중 QTL로 잡힌 첫 번째 maker 구간을 벼 물리지도를 이용하여 contig 분석하여 LOD값과 가장 가까운 sequence하나를 선발한 후, sequence내의 유전자 위치를 나타내었다. 천립중 QTL로 잡힌 첫 번째 maker 구간을 벼 물리지도를 이용해 contig 분석하여 LOD값과 가장 가까운 sequence 하나를 선발하였다. Sequence내의 유전자들은 3개가 나타났고, 세포 기능, 산화 환원 signaling과 관련이 있었다. 3개의 유전자 중 하나는 DHHC형 Zn finger (아연집게)로 DHHC형 아연 집게 단백질 유전자가 과다 발현되었을 때 벼에서 분얼이 약 40%, 곡물수량(grain yield)은 10%로 증가했다고 보고되어있다(Zhou et al., 2016). 다음 천립중 QTL로 잡힌 두 번째 maker 구간을 벼 물리지도를 이용해 contig 분석하여 LOD값과 가장 가까운 sequence 하나를 선발하였다. Sequence내의 유전자들은 4개 나타났고, 세포 기능, 산화 환원 signaling과 관련이 있었다. 염색체 7번에서 나타난 수량 QTL 분석 결과, LOD 값은 3.7, TR2값은 0.19, 상가적효과값은 113.73를 나타내었다(Table 2). 벼 물리지도를 이용해 QTL로 잡힌 maker 구간을 contig 분석하여 LOD값과 가장 가까운 sequence 하나를 선발하였다. sequence내의 유전자들은 4개가 나타났고, 세포 기능과 관련이 있었다. 그 중 하나는 OsNAC3 단백질로 이 단백질이 벼 뿌리직경을 증가시켜 가뭄스트레스에서 오랫동안 견디게 하여 알곡 수확량의 감소를 최소화 한다고 보고되어있다(Ooka et al., 2003). QTL 분석 결과와 QTL분석으로 잡힌 출수기, 10주 무게, 수분함량, 수량, 천립중 maker구간의 염색체 위치를 정리하여 그림으로 나타내었다(Fig. 3 and Fig. 4). 출수기 관련 QTL분석에서 Lu et al. (1997)은 염색체 1번, 8번에 1개 10번에 2개, Yano et al. (1997)은 6번에 2개, 7번에 2개 8번에 1개가 확인되었다고 하였다. 본 연구에서는 출수기 관련 1개의 QTL이 염색체 8번에 위치하고 있는 것을 확인하였다. 동일한 염색체에 위치하는 QTL이 있으나 염색체 상의 위치는 모두 다르게 나타났다. 수량 관련 QTL 분석에서도 Kang (1996)은 8번과 9번에서, Xiao et al. (1996)은 8번과 12번에서 각각 발견하였는데 본 연구에서는 수량관련 1개의 QTL이 염색체 7번에 위치하고 있었다. QTL 분석결과가 다르게 나타나는 것은 아마 각각의 실험에서 사용되는 집단의 재료에 차이가 있으며 지역 및 환경의 차이에 따라서 농업 형질의 특성이 다르기 때문일 것으로 추측된다.
Table 2. QTL information on QHD, QTPW, QM, QTGW, QY.
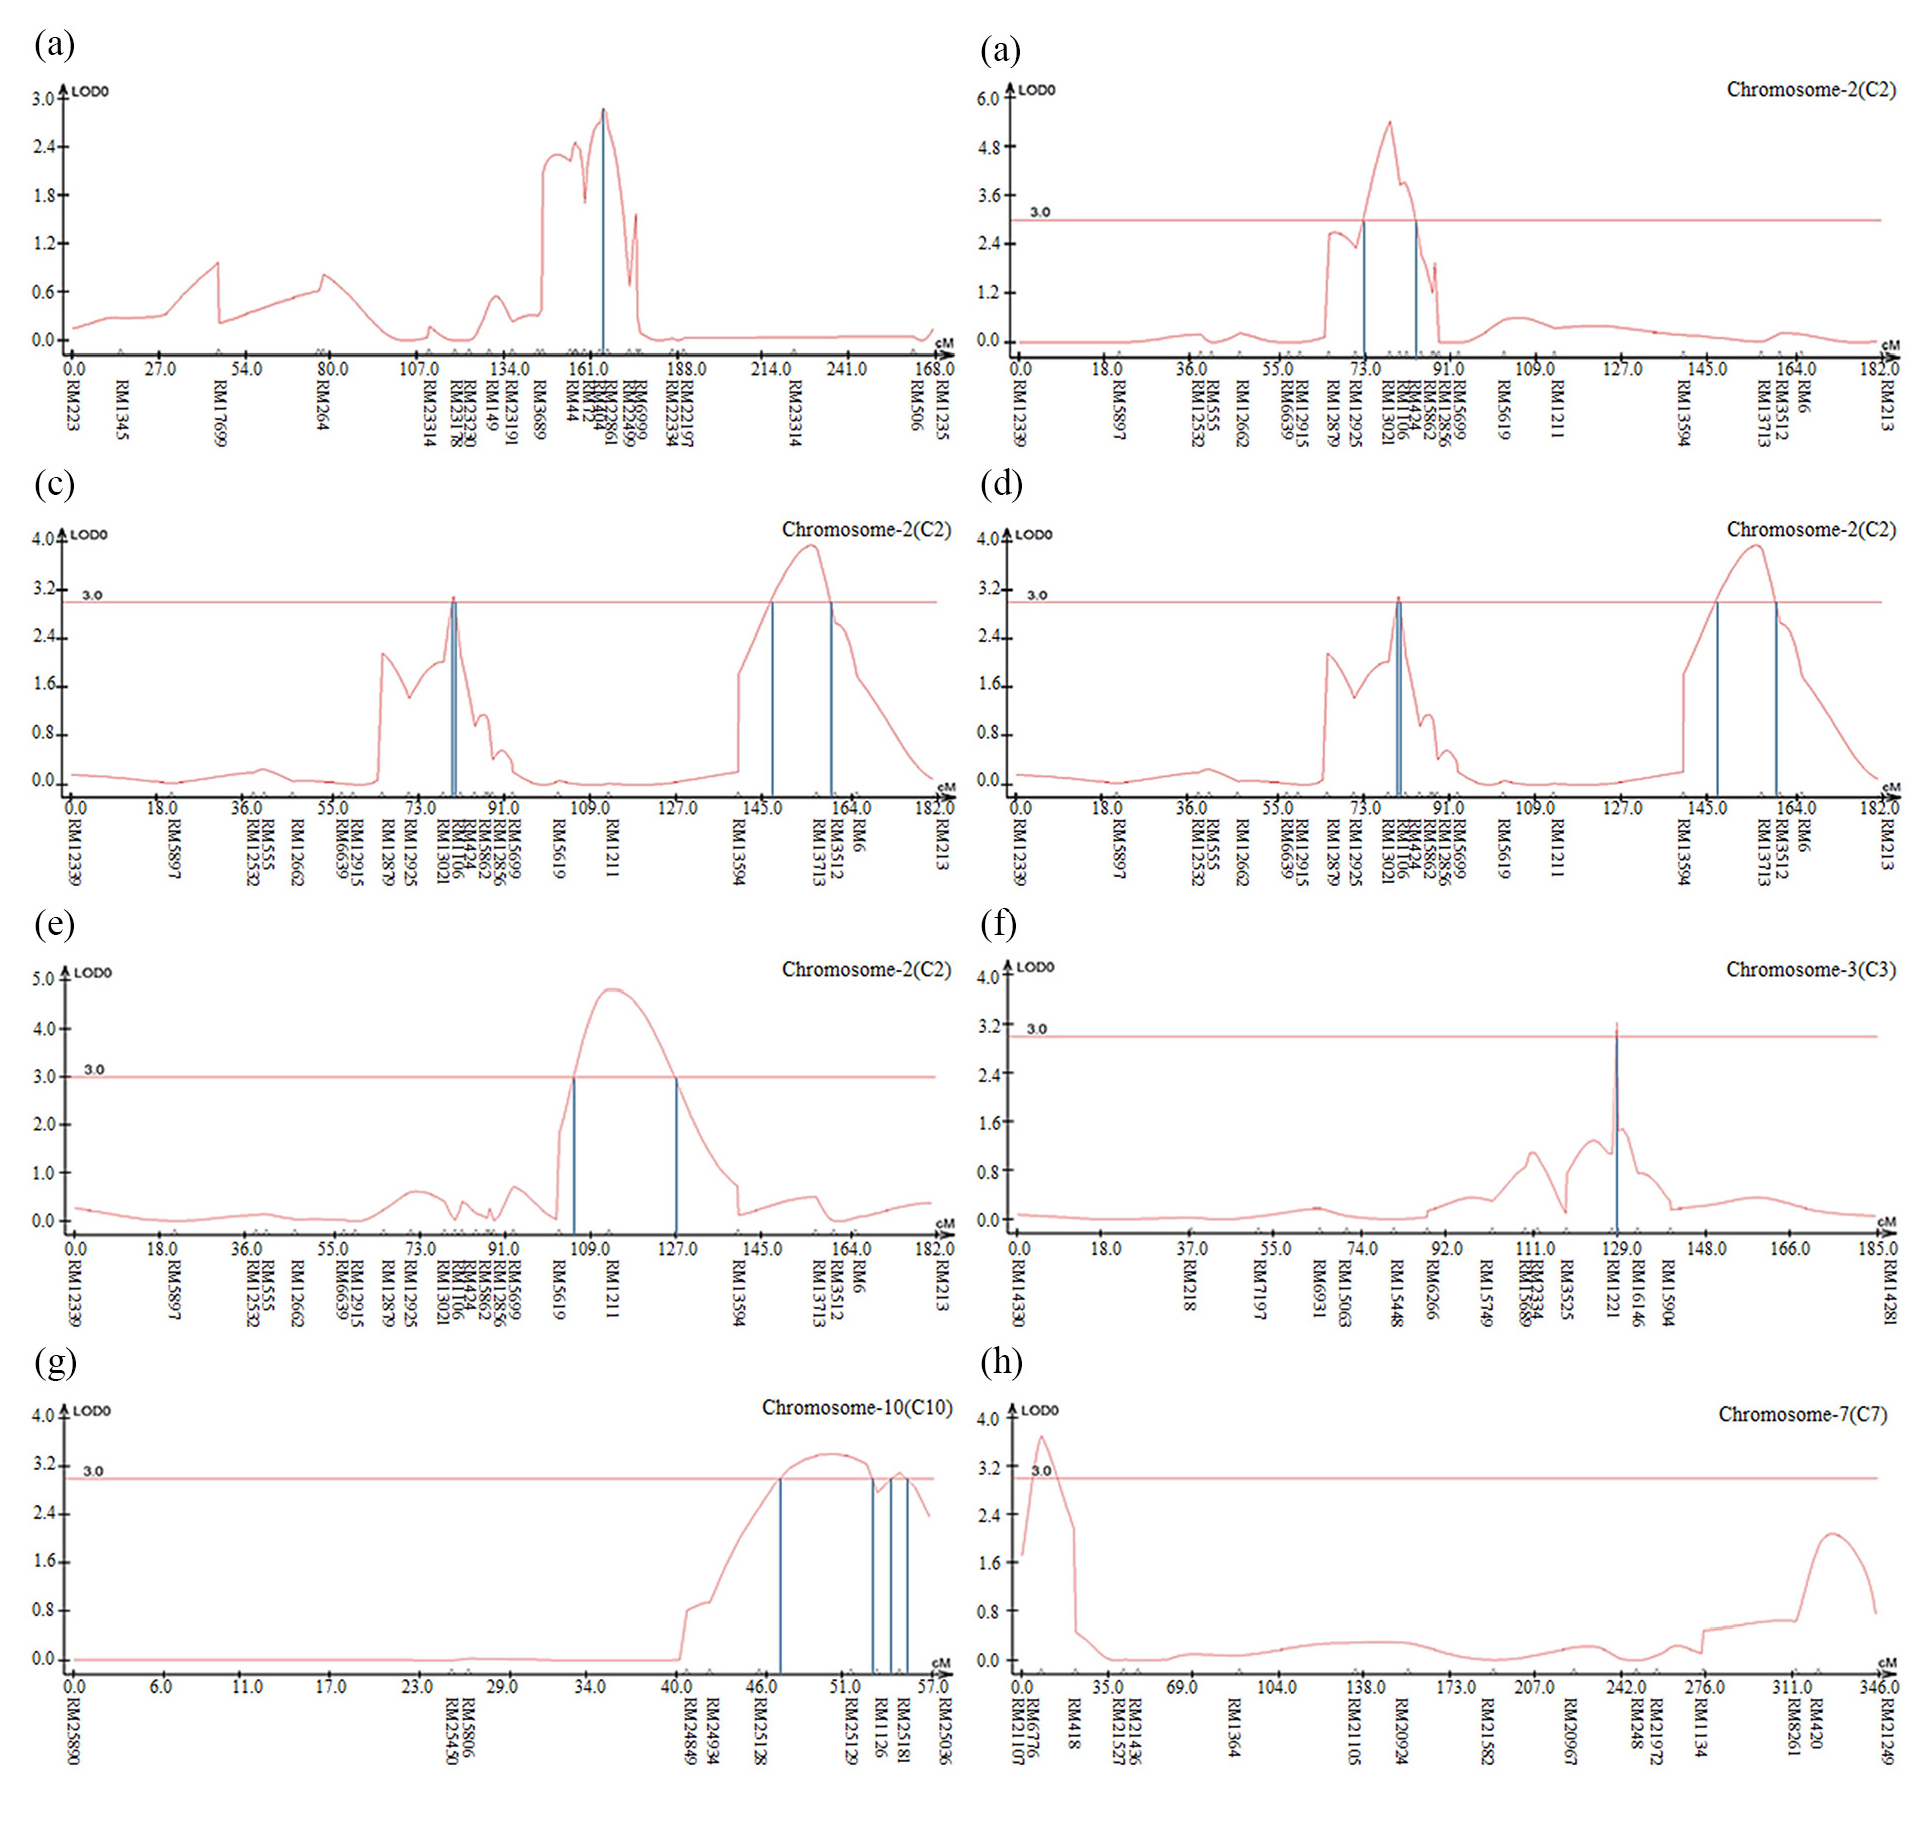
Fig. 3.
The QTL analysis results were associated with rice traits in CNDH lines. (a): QTL of heading date appeared on chromosome 8. The LOD value was 2.85. (b): QTL of 10 plants weight appeared on chromosome 2. The LOD value was 5.39. (c): QTL of moisture appeared on chromosome 2. There were two QTL analysis results. The LOD values were 3.08 and 3.92, respectively. (d): QTL of moisture appeared on chromosome 7. The LOD value was 3.0. (e): QTL of 1000 grain weight appeared on chromosome 2. The LOD value was 4.80. (f): QTL of 1000 grain weight appeared on chromosome 3. The LOD value was 3.22. (g): QTL of 1000 grain weight appeared on chromosome 10. There were two QTL analysis results. The LOD values were 3.4 and 3.09, respectively. (h): QTL of yield appeared on chromosome 10. The LOD value was 3.7.
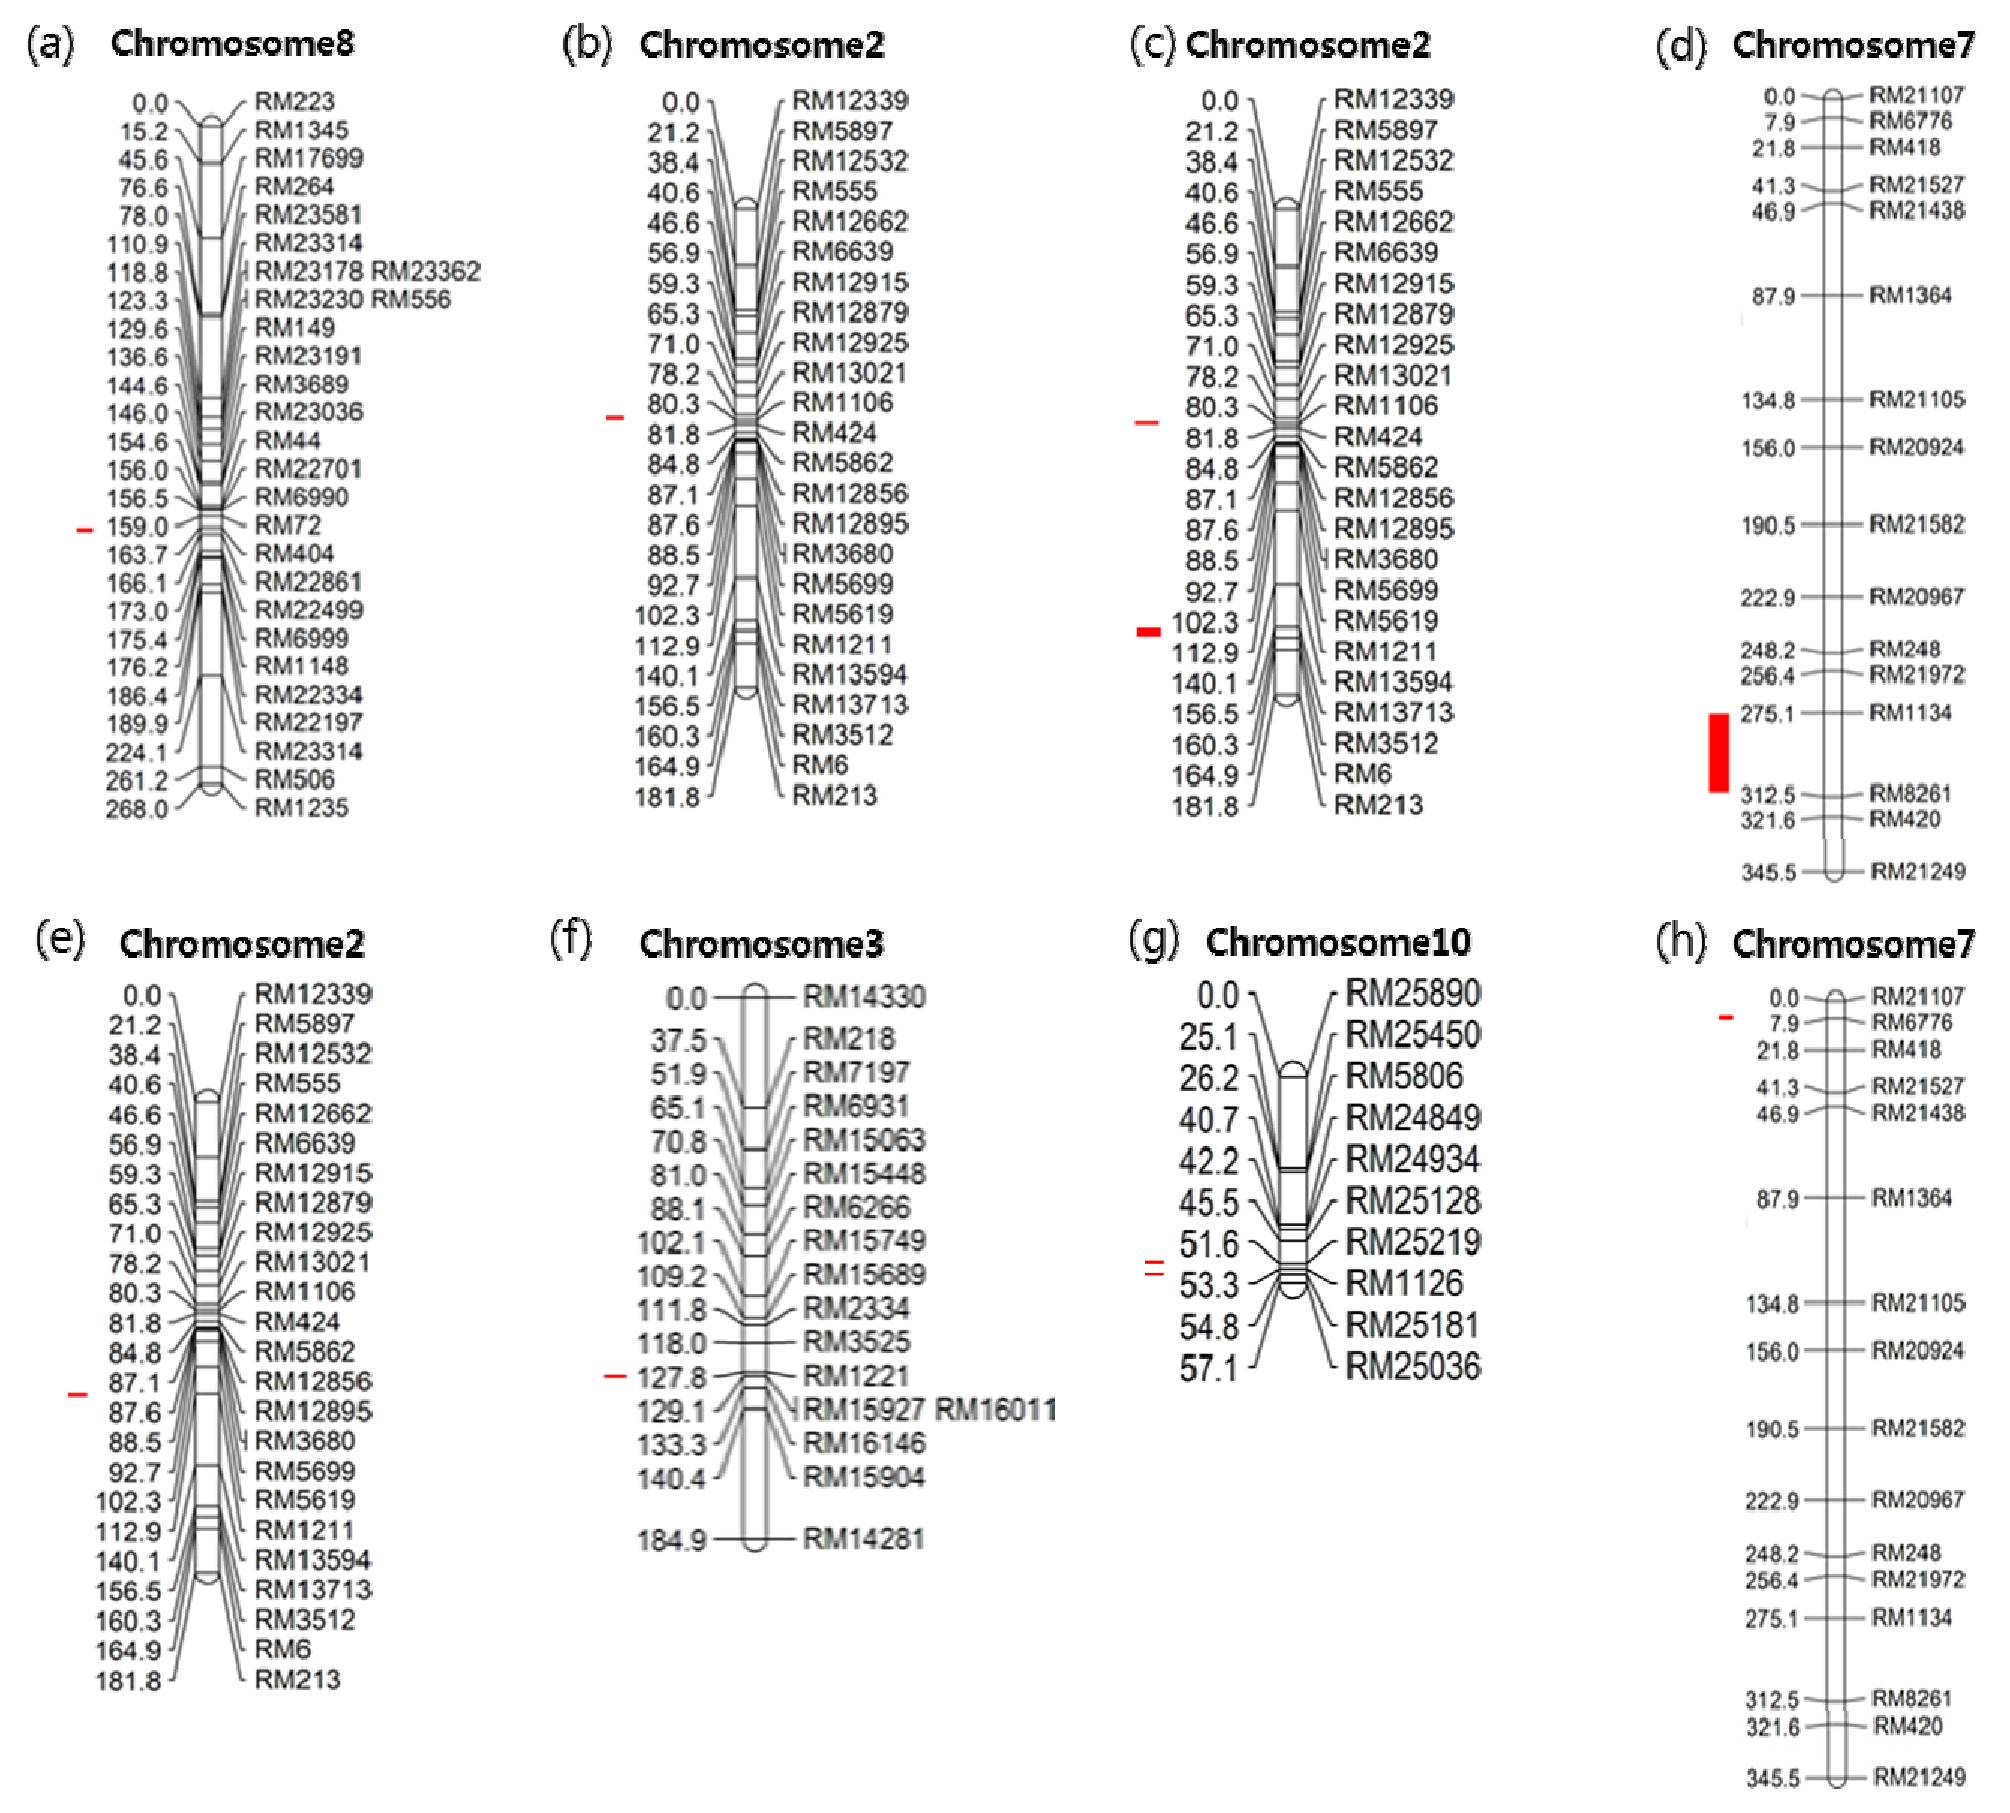
Fig. 4.
The chromosomal location of QTLs associated with rice traits in CNDH lines. (a): QTL of heading date appeared on chromosome 8. The region extended from RM404 to RM22861. (b): QTL of 10 plants weight appeared on chromosome 2. The region extended from RM13021 to RM1106. (c): QTL of moisture appeared on chromosome 2. The first region extended from RM1106 to RM424. The second region extended from RM13713. (d): QTL of moisture appeared on chromosome 7. The region extended from RM1134 to RM8261. (e): QTL of 1000 grain weight appeared on chromosome 2. The region extended from RM1211. (f): QTL of 1000 grain weight appeared on chromosome 3. The region extended from RM15927. (g): QTL of 1000 grain weight appeared on chromosome 10. The first region extended from RM25219. The second region extended from RM25181. (h): QTL of yield appeared on chromosome 10. The region extended from RM6776.
적 요
본 연구는 2017년 CNDH 계통을 이용하여 출수기와 수량을 QTL 조사하여 다음과 같은 결과를 가졌다.
1. 도수분포표에서 QHD, QTPW, QM, QTGW, QY는 정규분포를 이루고 있었다.
2. 출수기 관련 QTLs은 총 1개가 잡혔고, 수량관련 QTLs은 총 9개가 잡혔다. QHD에서는 LOD 2.85가 가장 컸고, QTPW에서는 5.39, QM에서는 3.92, QTGW에서는 4.80, QY에서는 3.7이 가장 컸다.
3. 유전자 분석을 통해, 2, 3, 7, 8, 10번 염색체에서 총58개의 후보유전자를 찾았다. 이 중 수량요소인 QM에서 Rcd1 protein, OsERF3 유전자, QTGW에서 MtN3, Zinc finger protein 유전자, QY에서 OsNAC3 protein 유전자를 발견하였다.
4. 본 연구를 통해 발견된 CNDH 계통 내의 수분함량, 천립중, 수량에 관련된 유전자의 존재여부를 찾아낸다면 조생종, 수중형에 가까운 품종을 개발하는 데 기초자료로 이용될 수 있을 것이라 판단된다.
Supplemental Figure
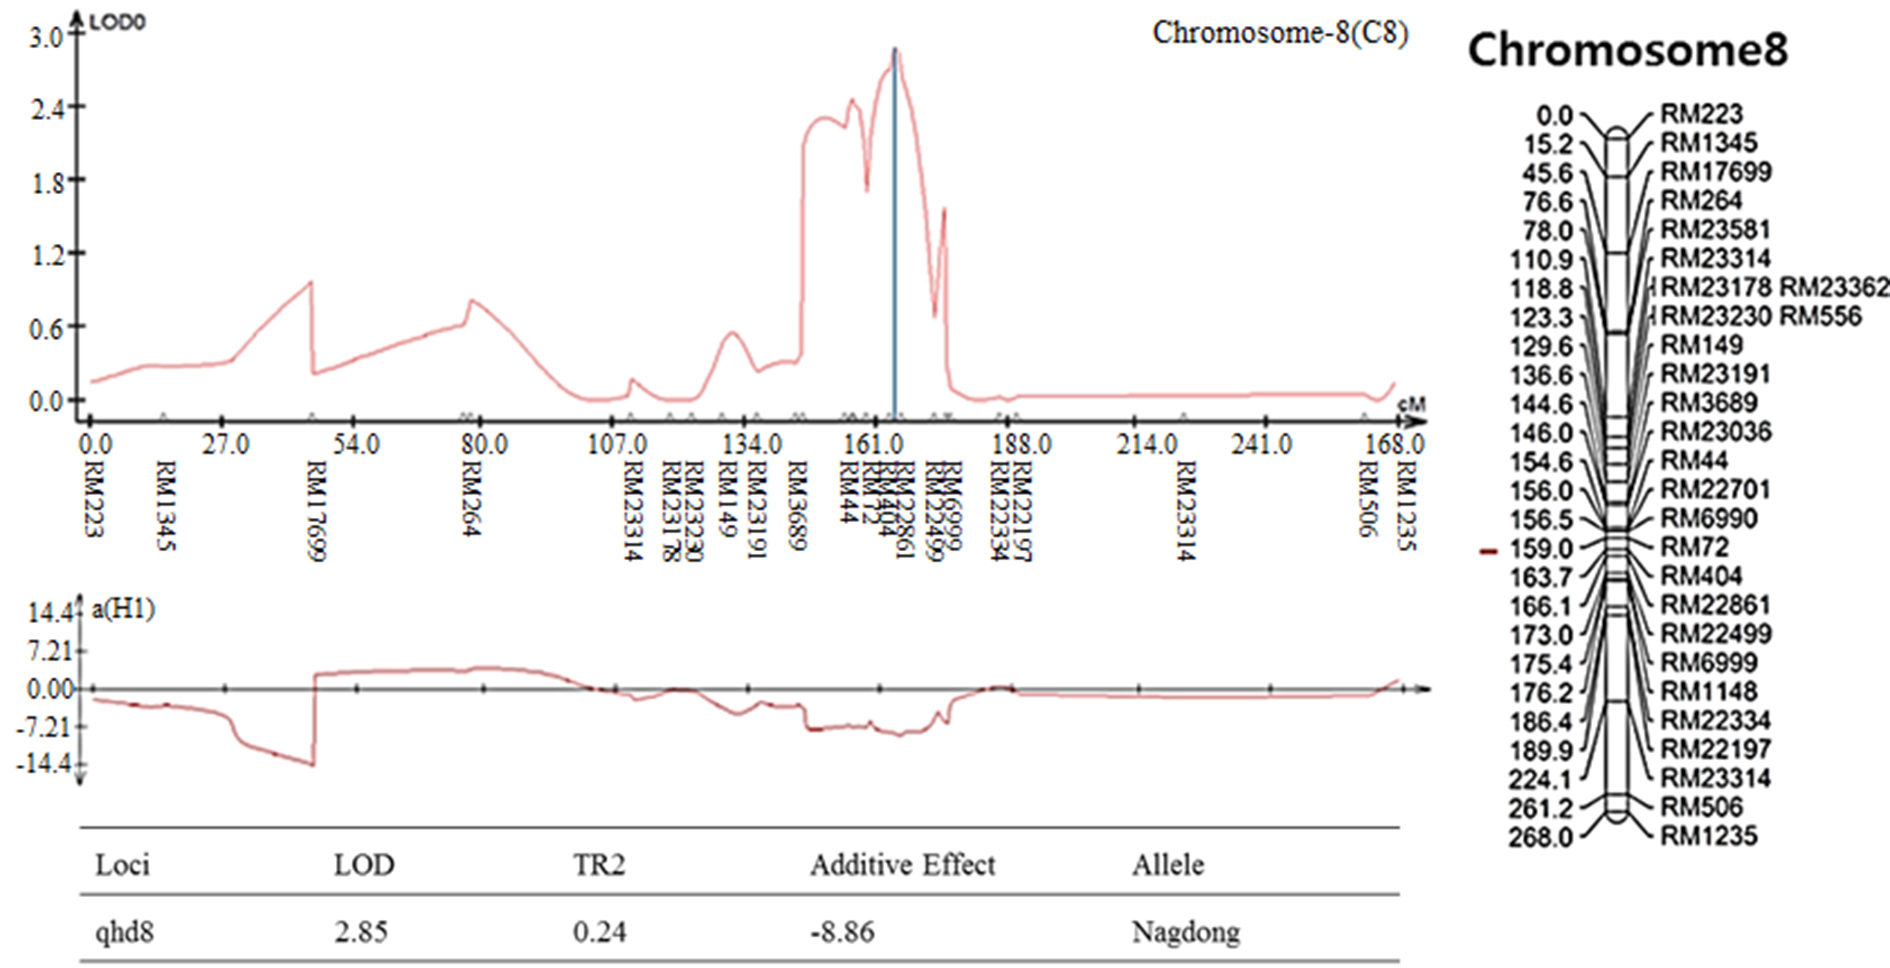
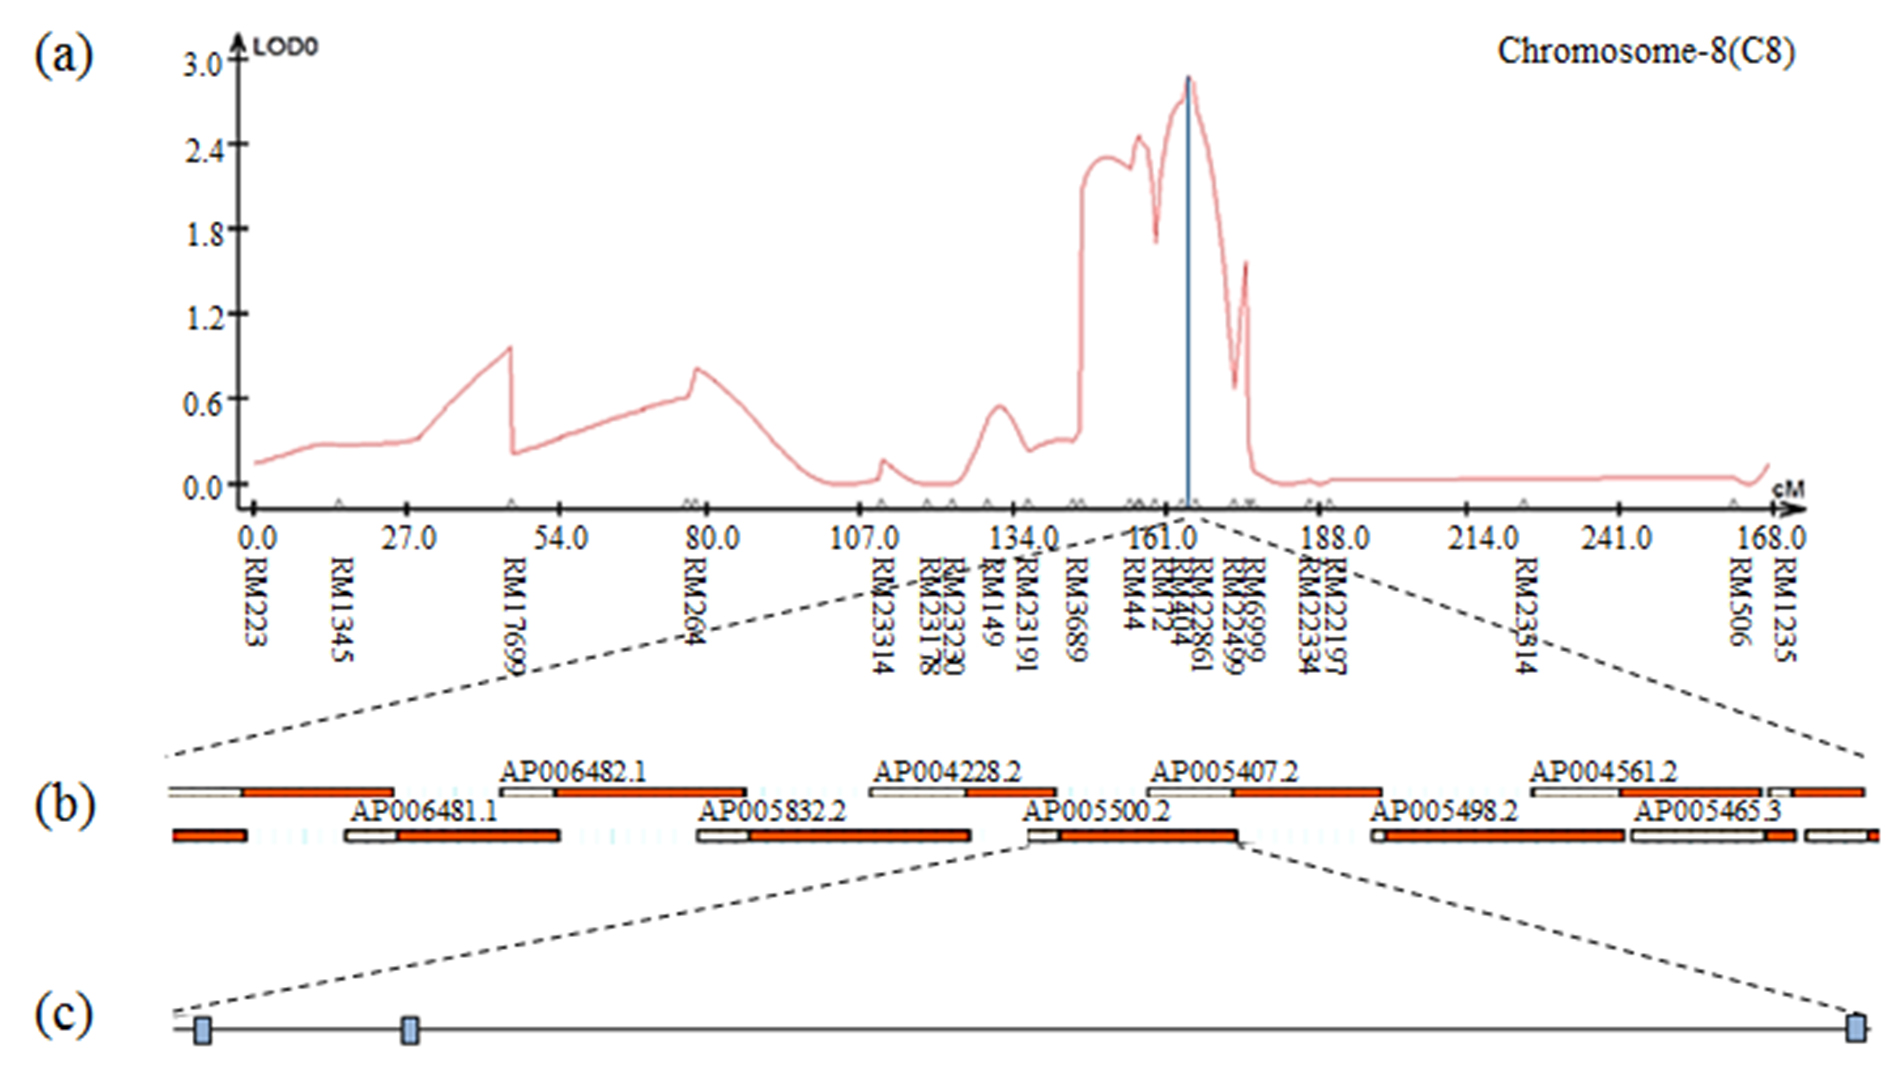
Fig. S2.
The result of contig analysis of the genomic region related to heading date using the physical map of rice. (a) The chromosomal location of QTL associated with heading date in CNDH lines. (b) The region extended from RM404 to RM22861. (c) AP005500.2 included three ORF involved in cell function.
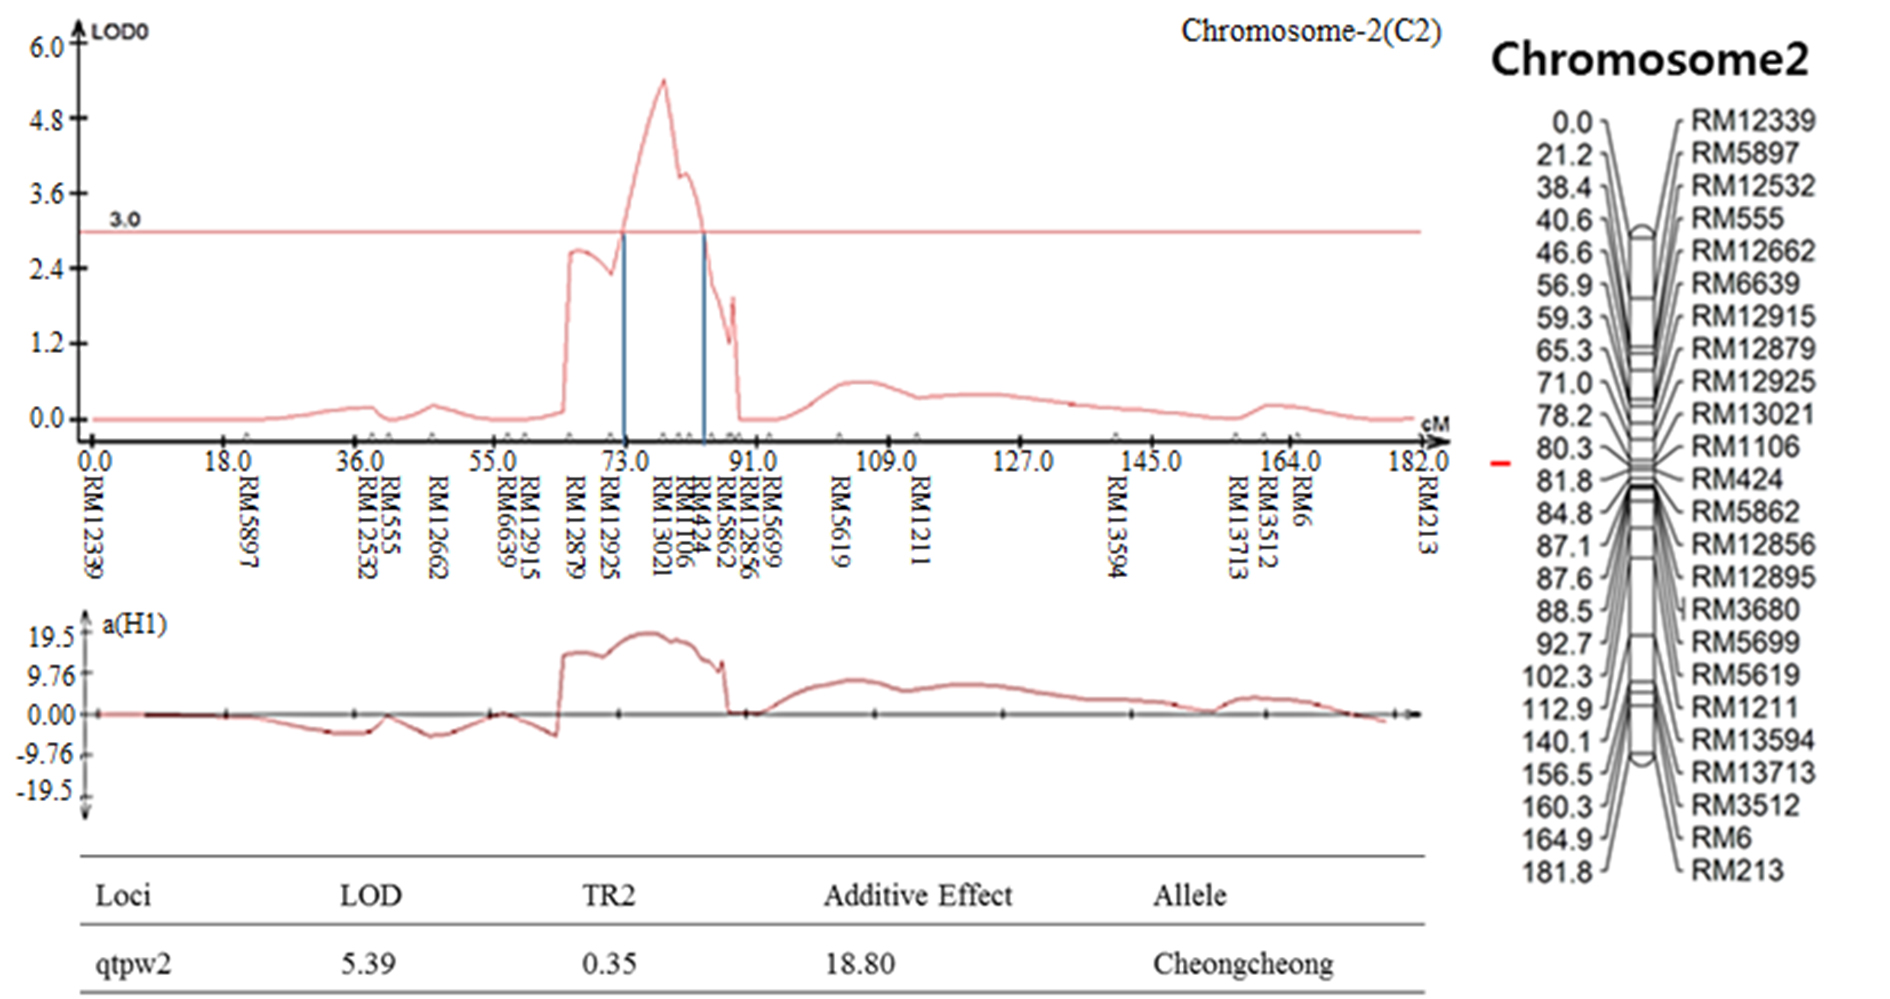
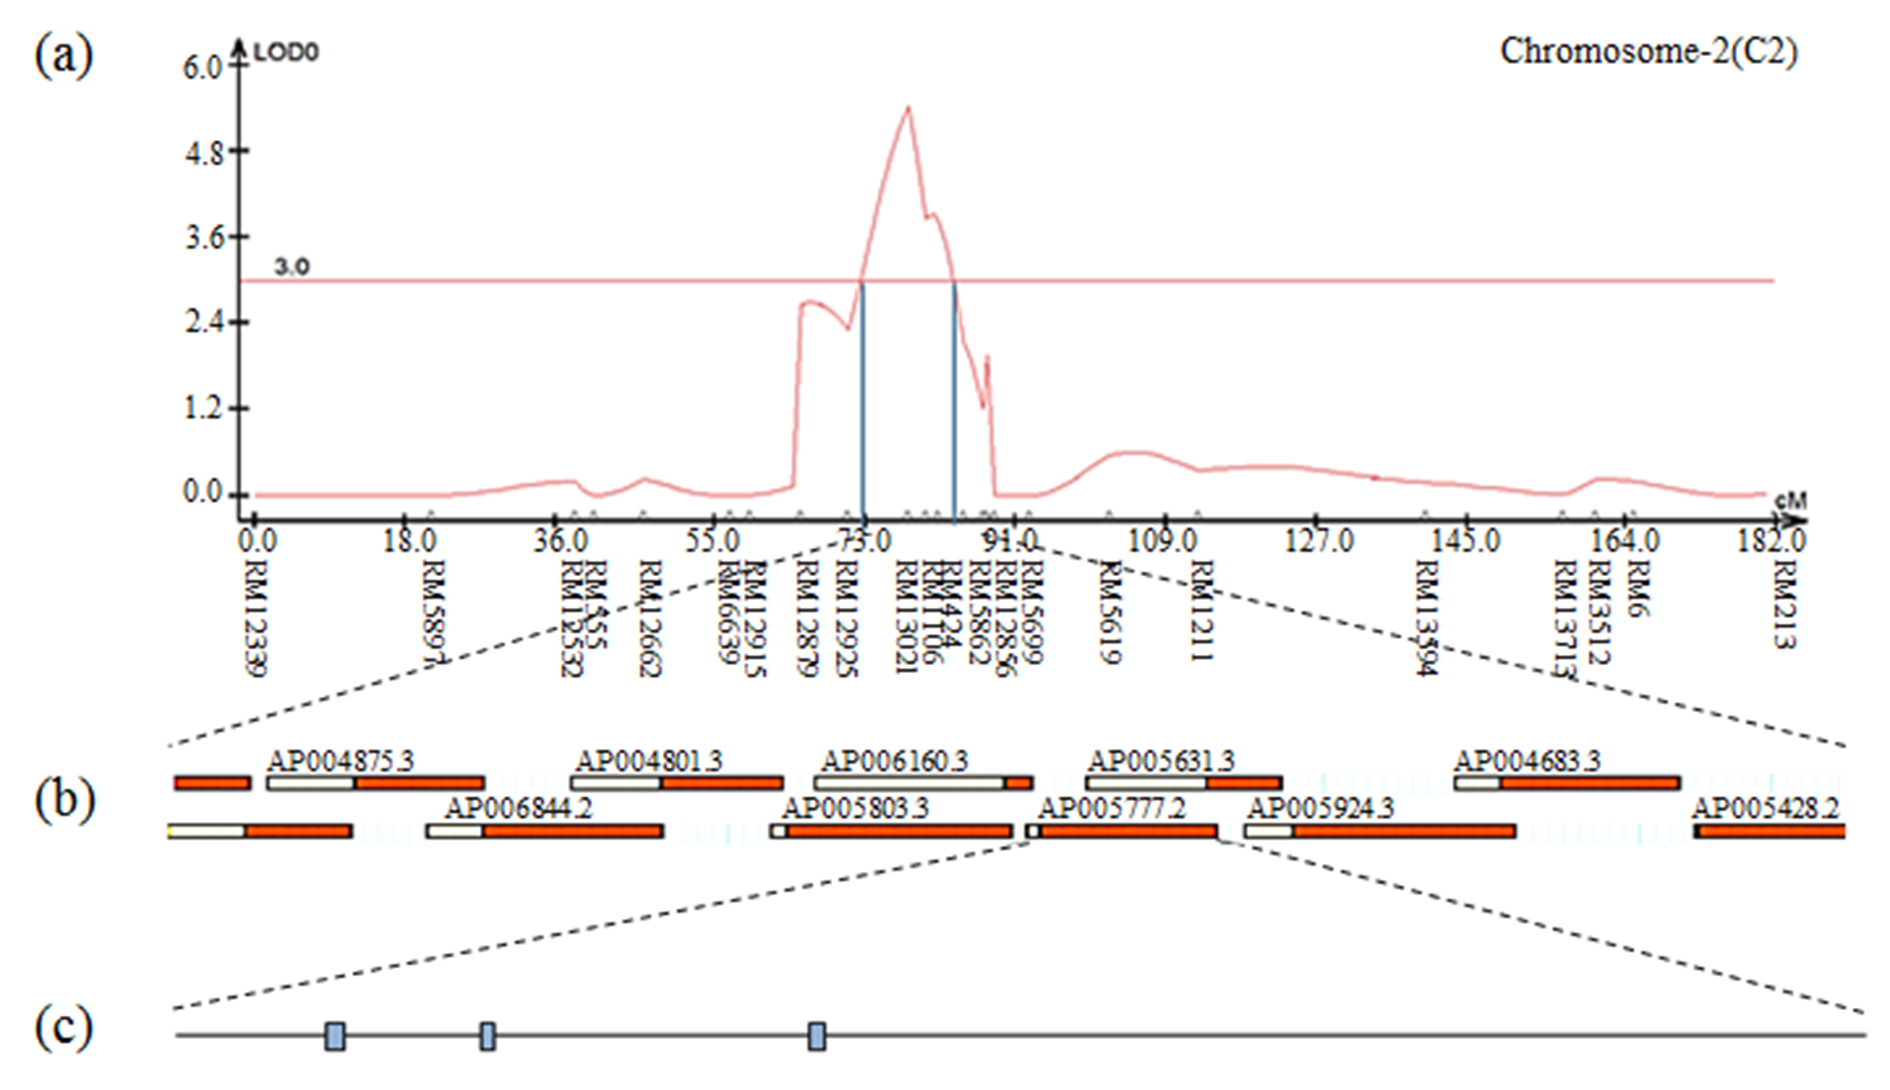
Fig. S4.
The result of contig analysis of the genomic region related to 10 plants weight using the physical map of rice. (a) The chromosomal location of QTL associated with 10 plants weight in CNDH lines. (b) The region extended from RM13021 to RM1106. (c) Three ORFs in AP005777.2 are involved in cell function and plant defense.
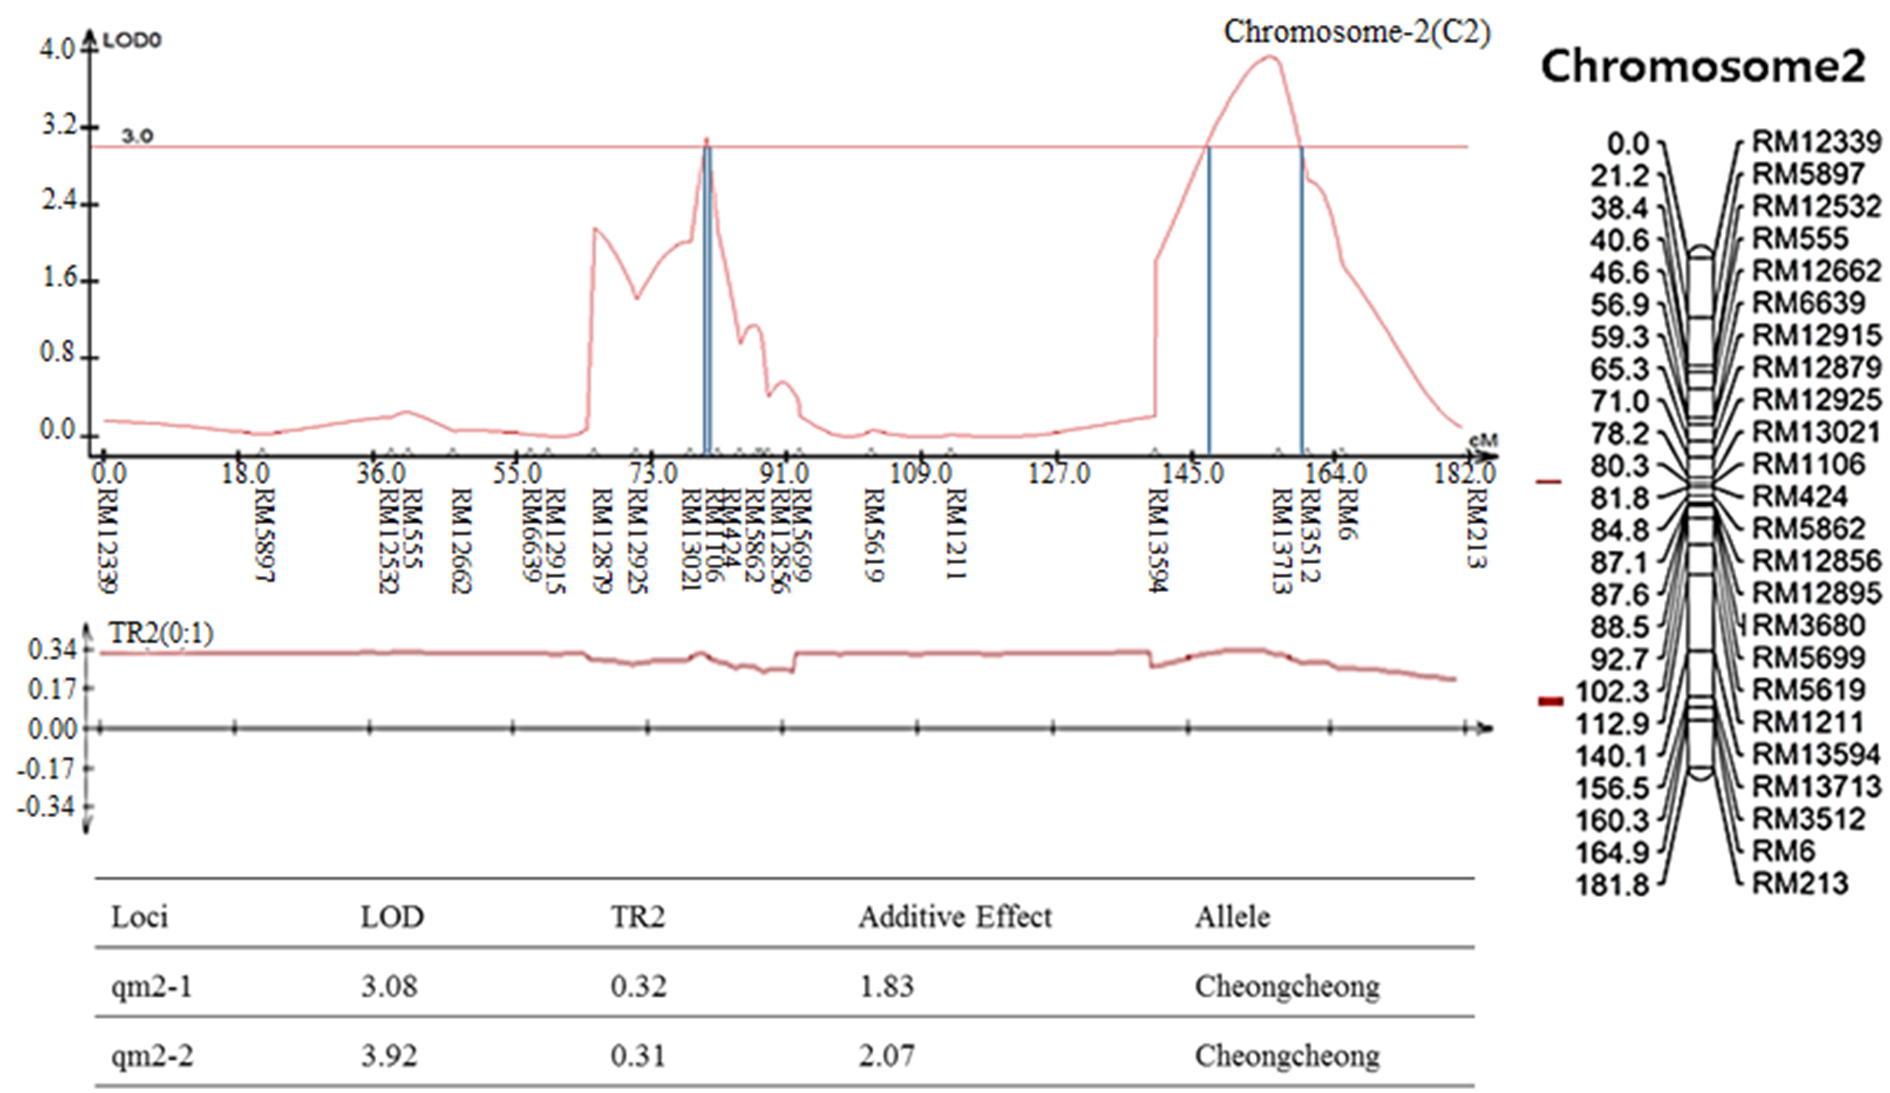
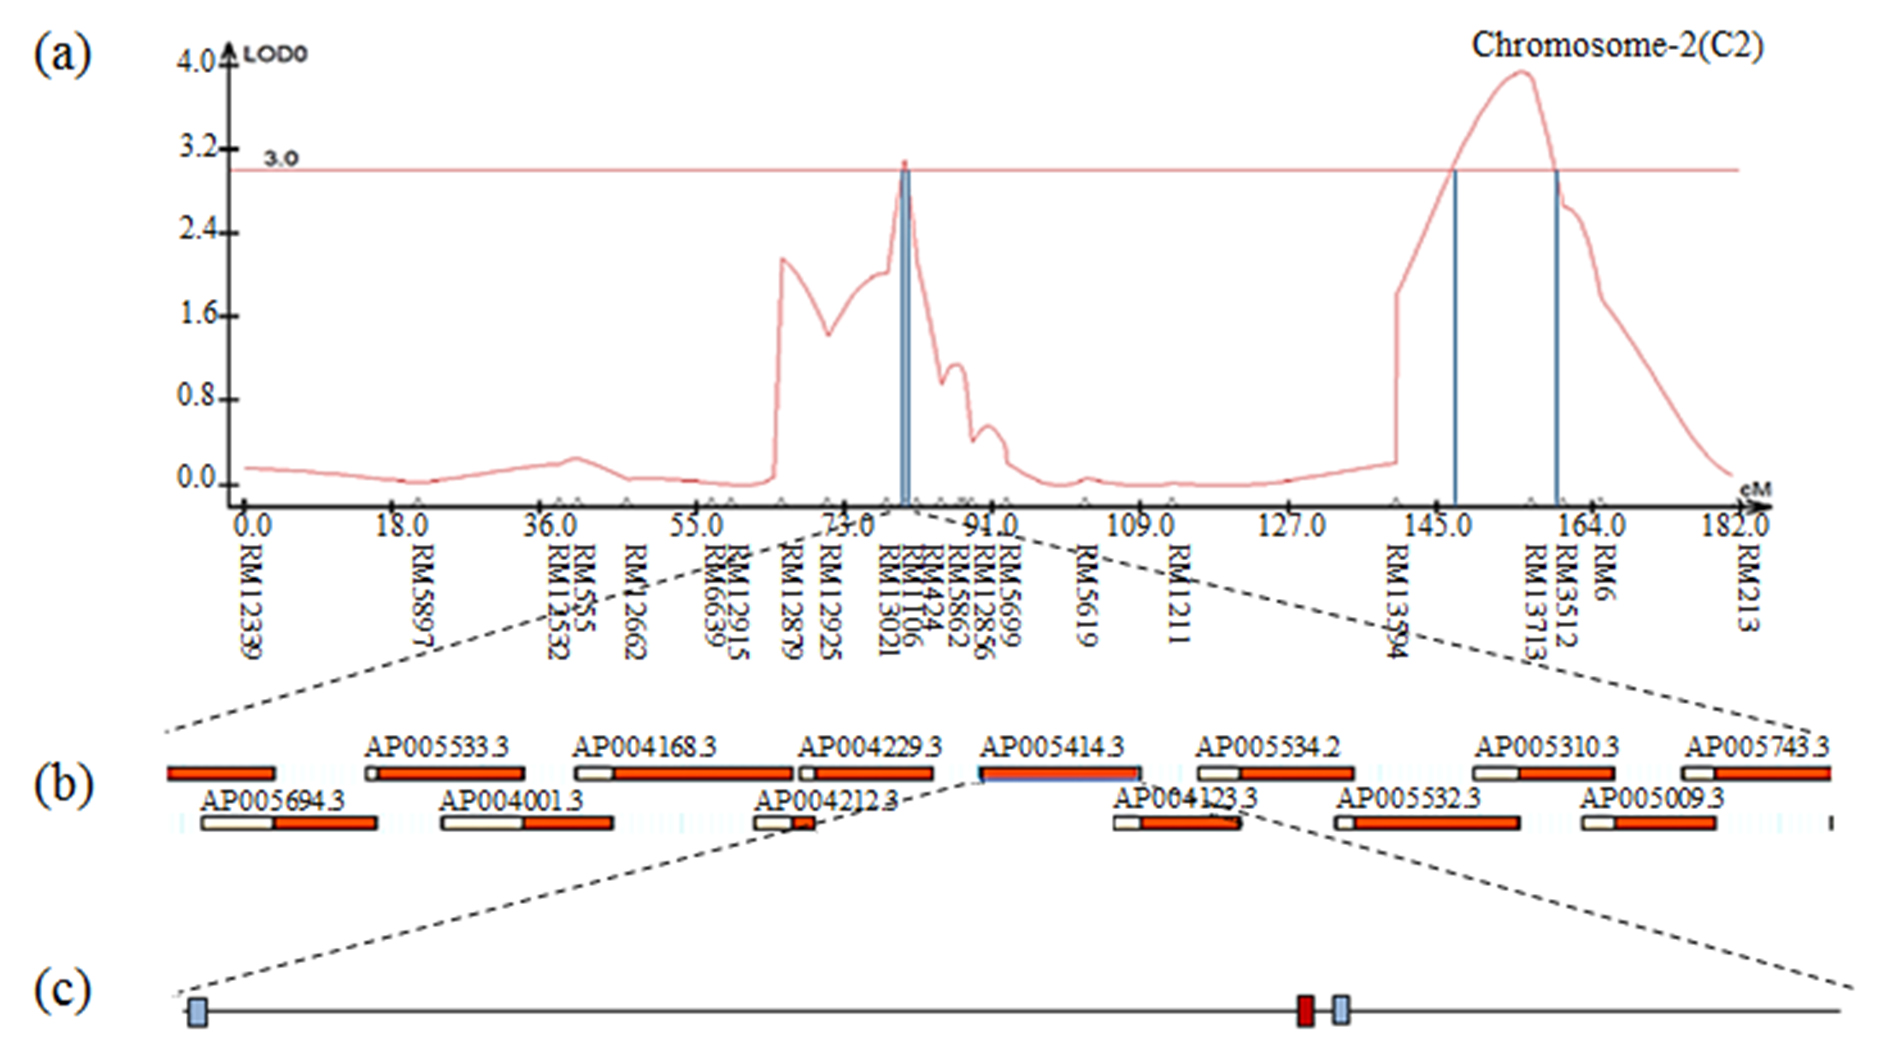
Fig. S6.
The result of contig analysis of the genomic region related to moisture using the physical map of rice. (a) The chromosomal location of QTL associated with moisture in CNDH lines. (b) The region ranged from RM1106 to RM424. (c) Three ORFs in AP005414.3 are involved in cell function and hormone signaling. The red ORF indicates the Rcd1 protein.
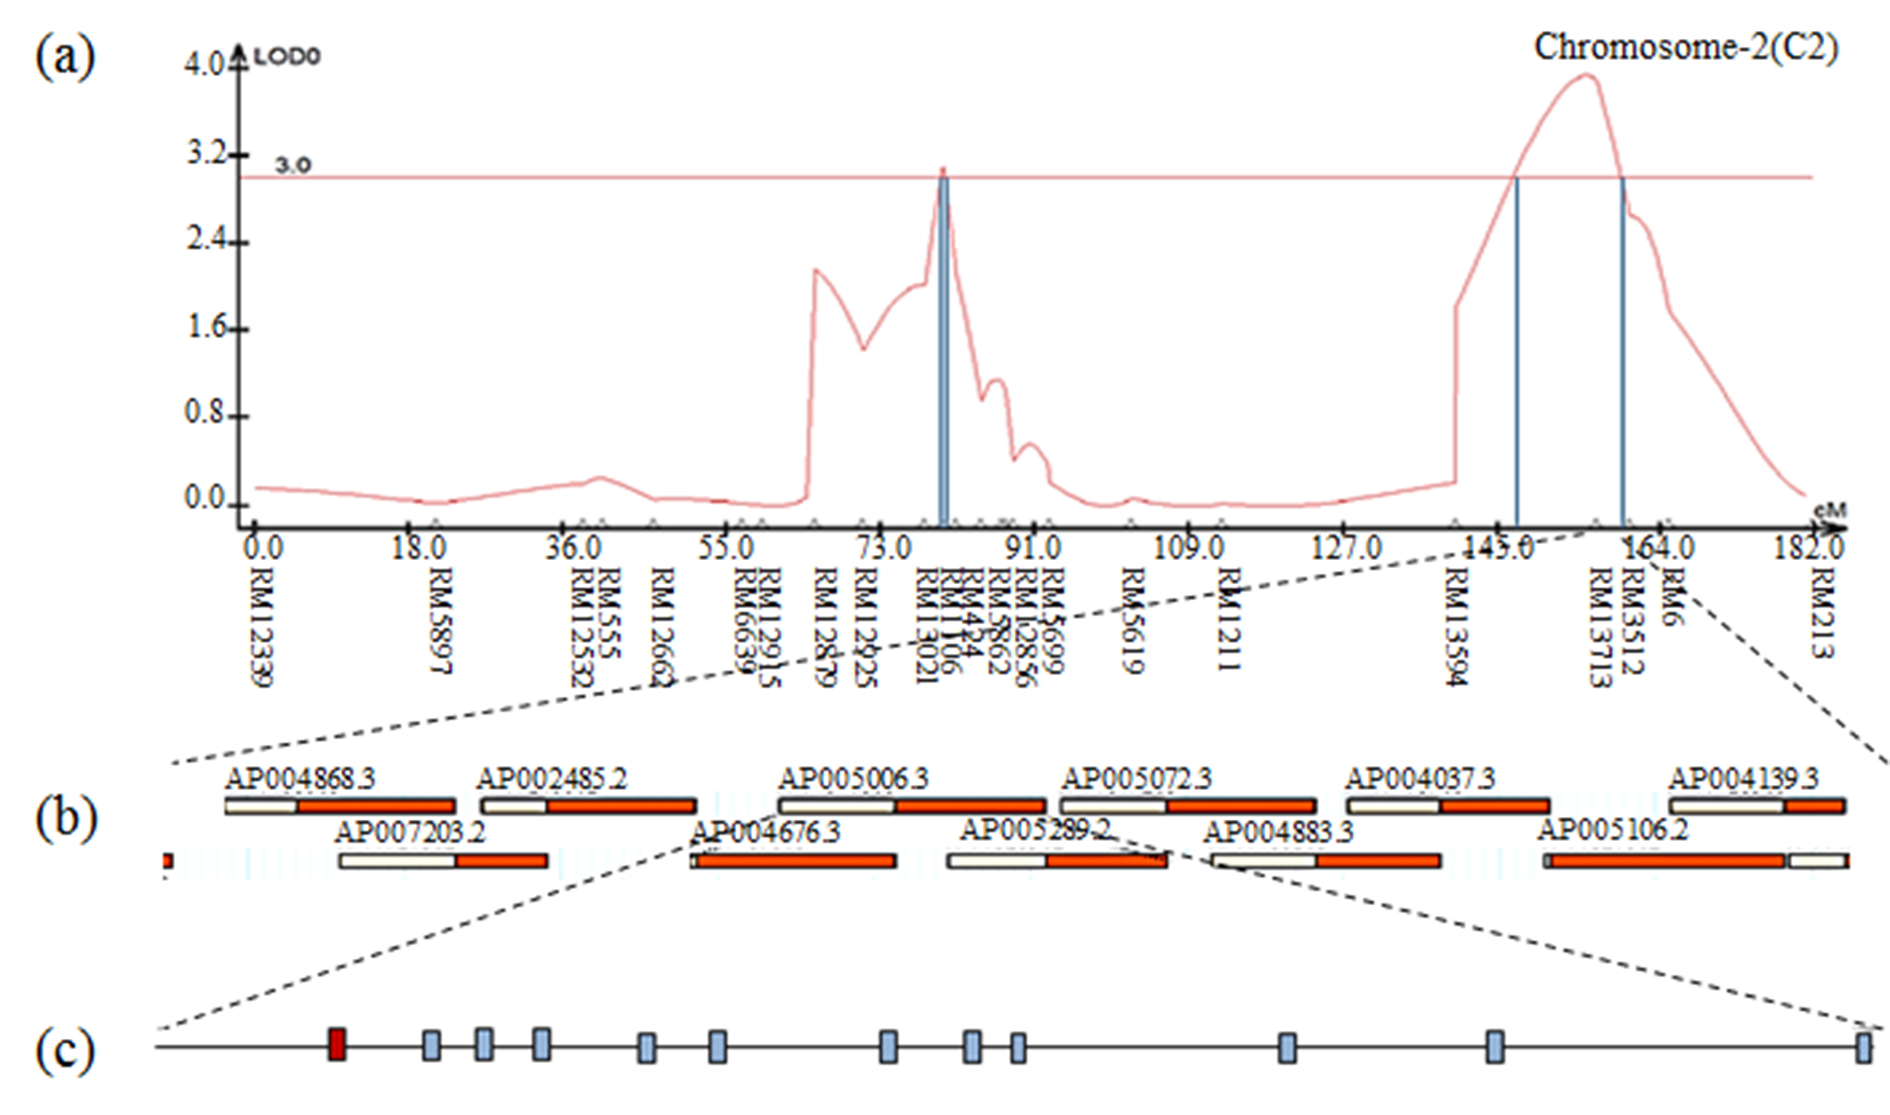
Fig. S7.
The result of contig analysis of the genomic region related to moisture using the physical map of rice. (a) The chromosomal location of QTL associated with moisture in CNDH lines. (b) The region ranged from RM13713. (c) Twelve ORFs in AP005006.3 are involved in cell function, redox signaling, and hormone signaling. The red ORF indicates OsERF3.
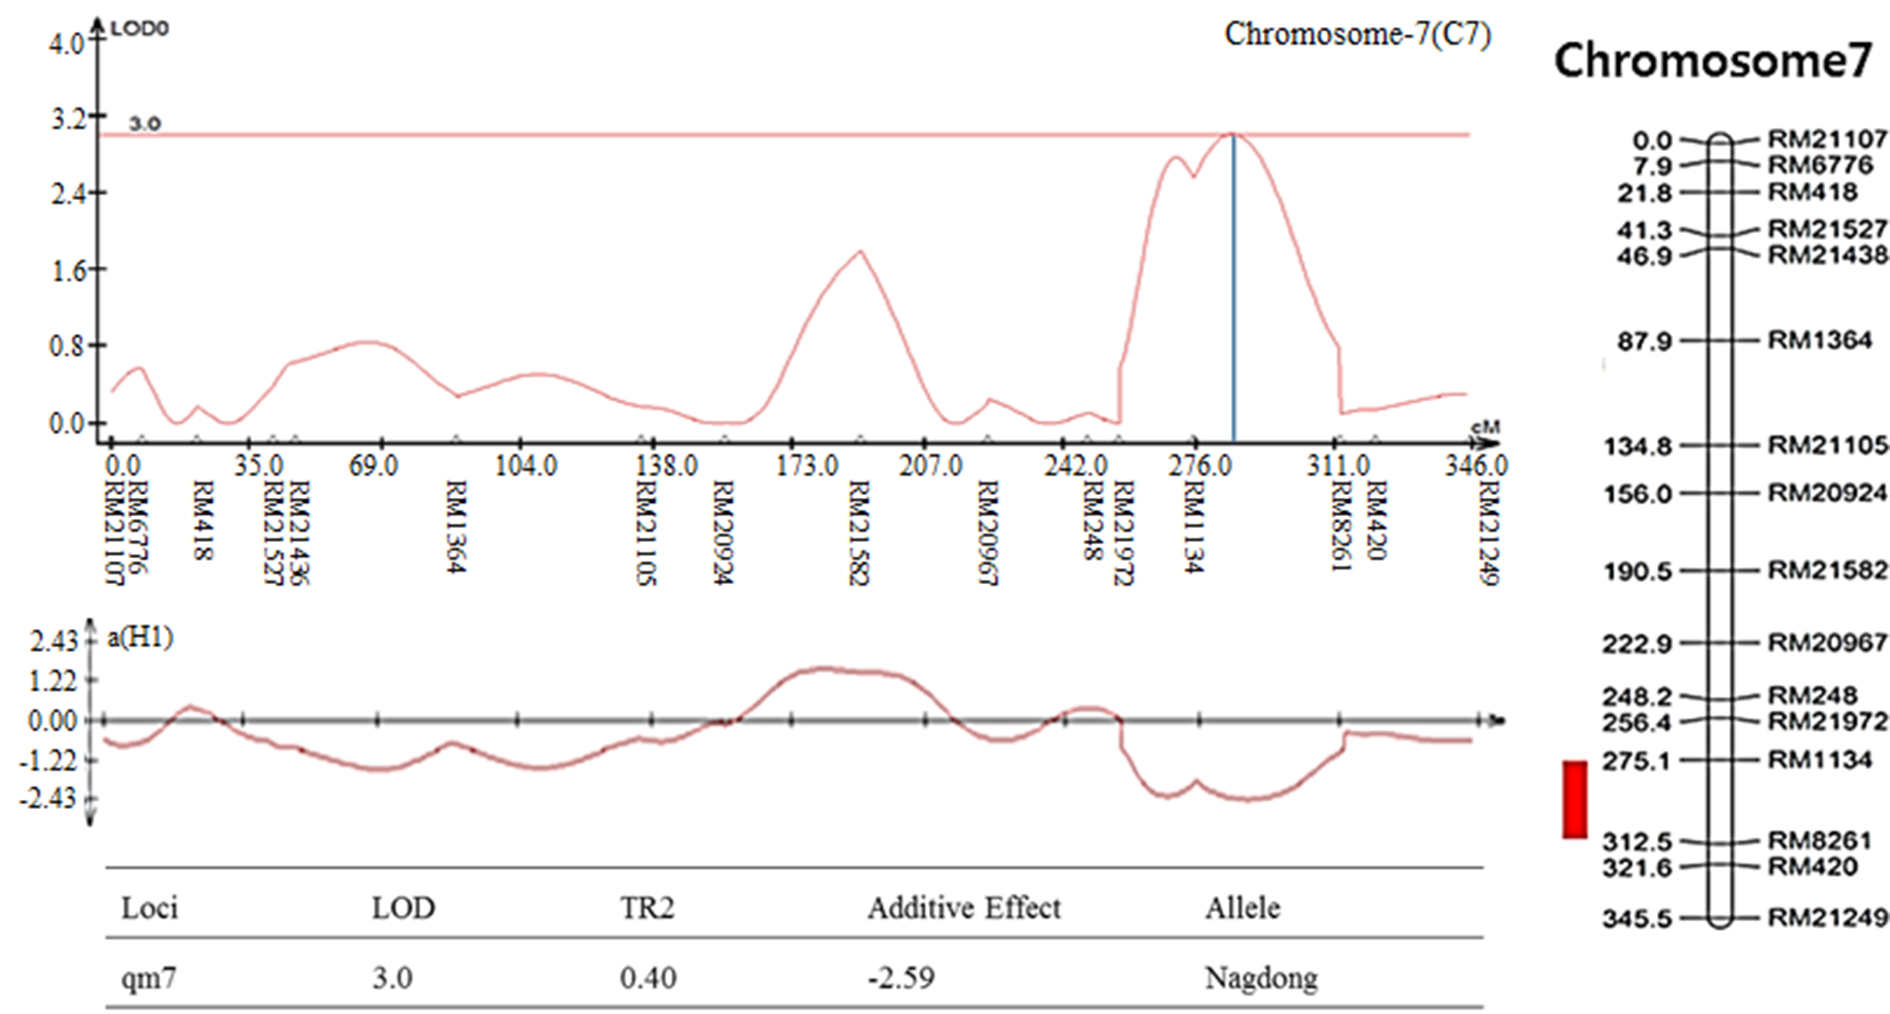
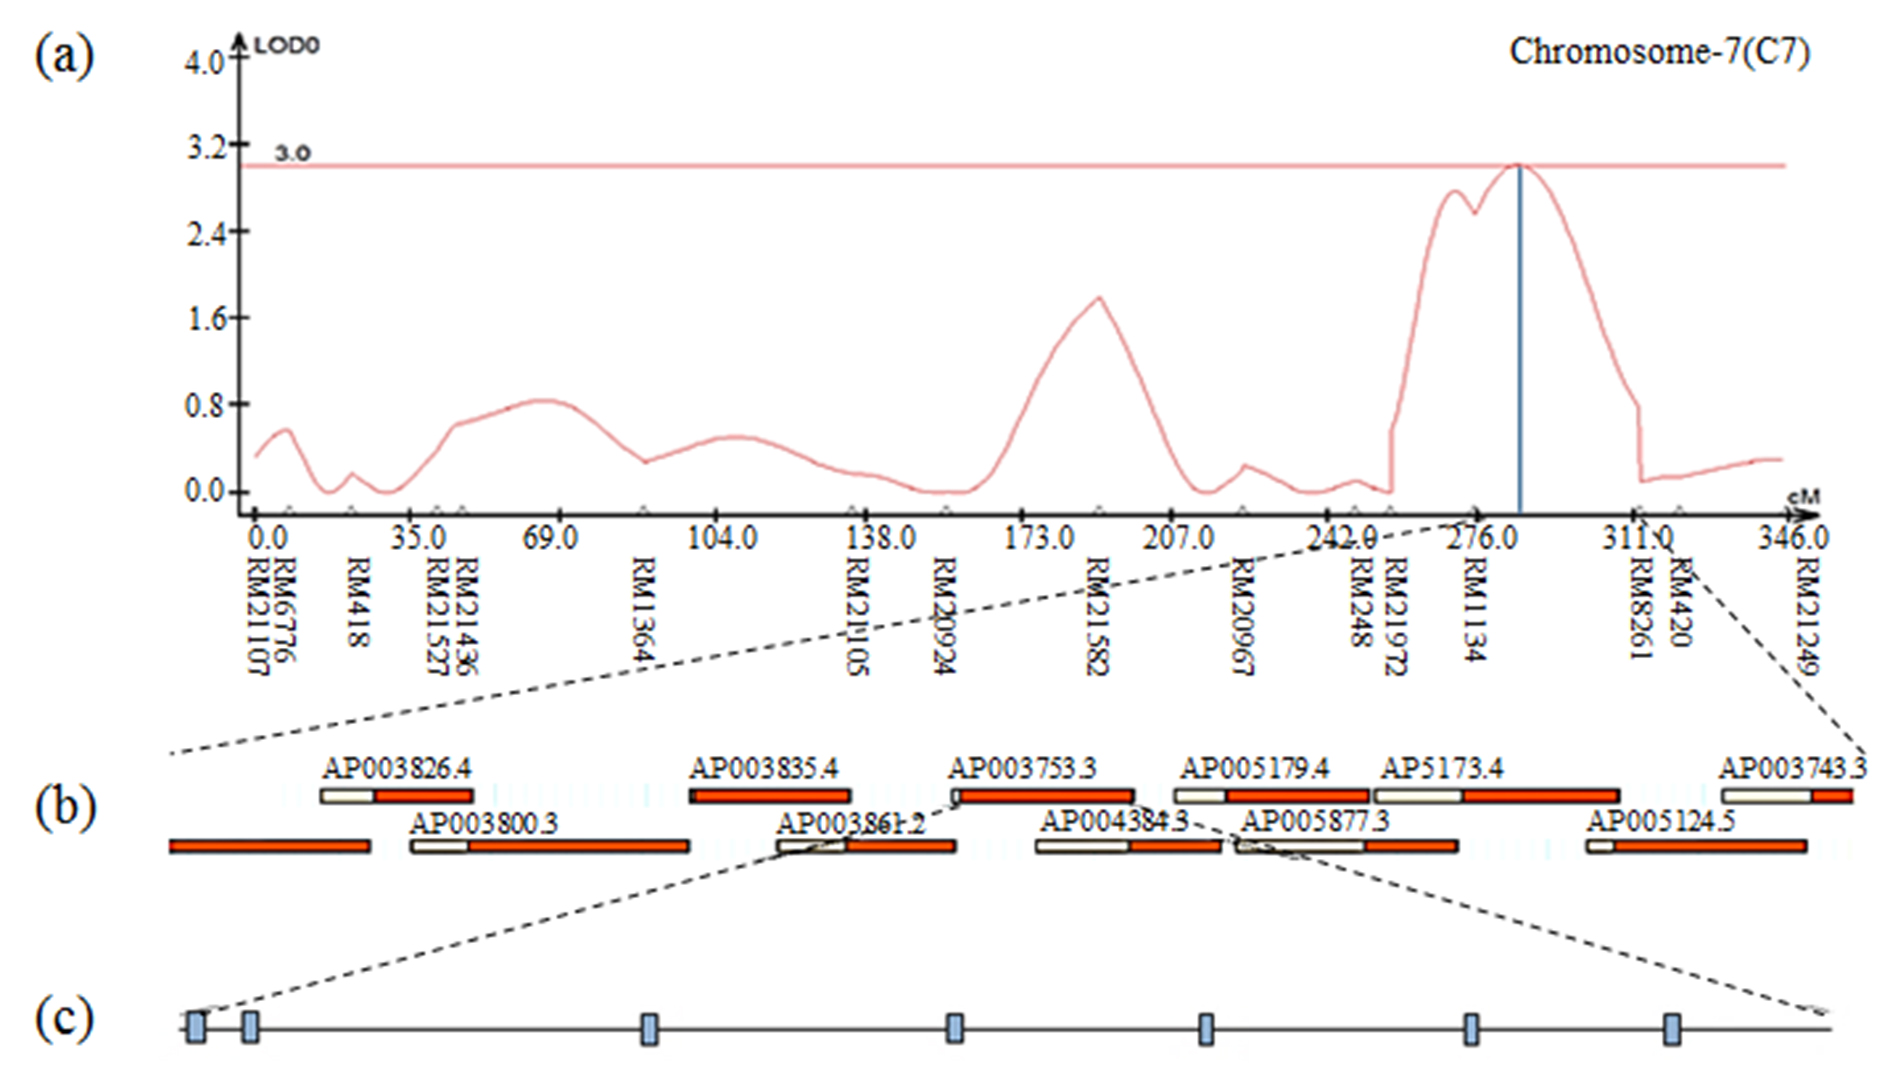
Fig. S9.
The result of contig analysis of the genomic region related to moisture using the physical map of rice. (a) The chromosomal location of QTL associated with moisture in CNDH lines. (b) The region extended from RM1134 to RM8261. (c) Seven ORFs in AP003753.3 are involved in cell function, plant defense, and redox signaling.
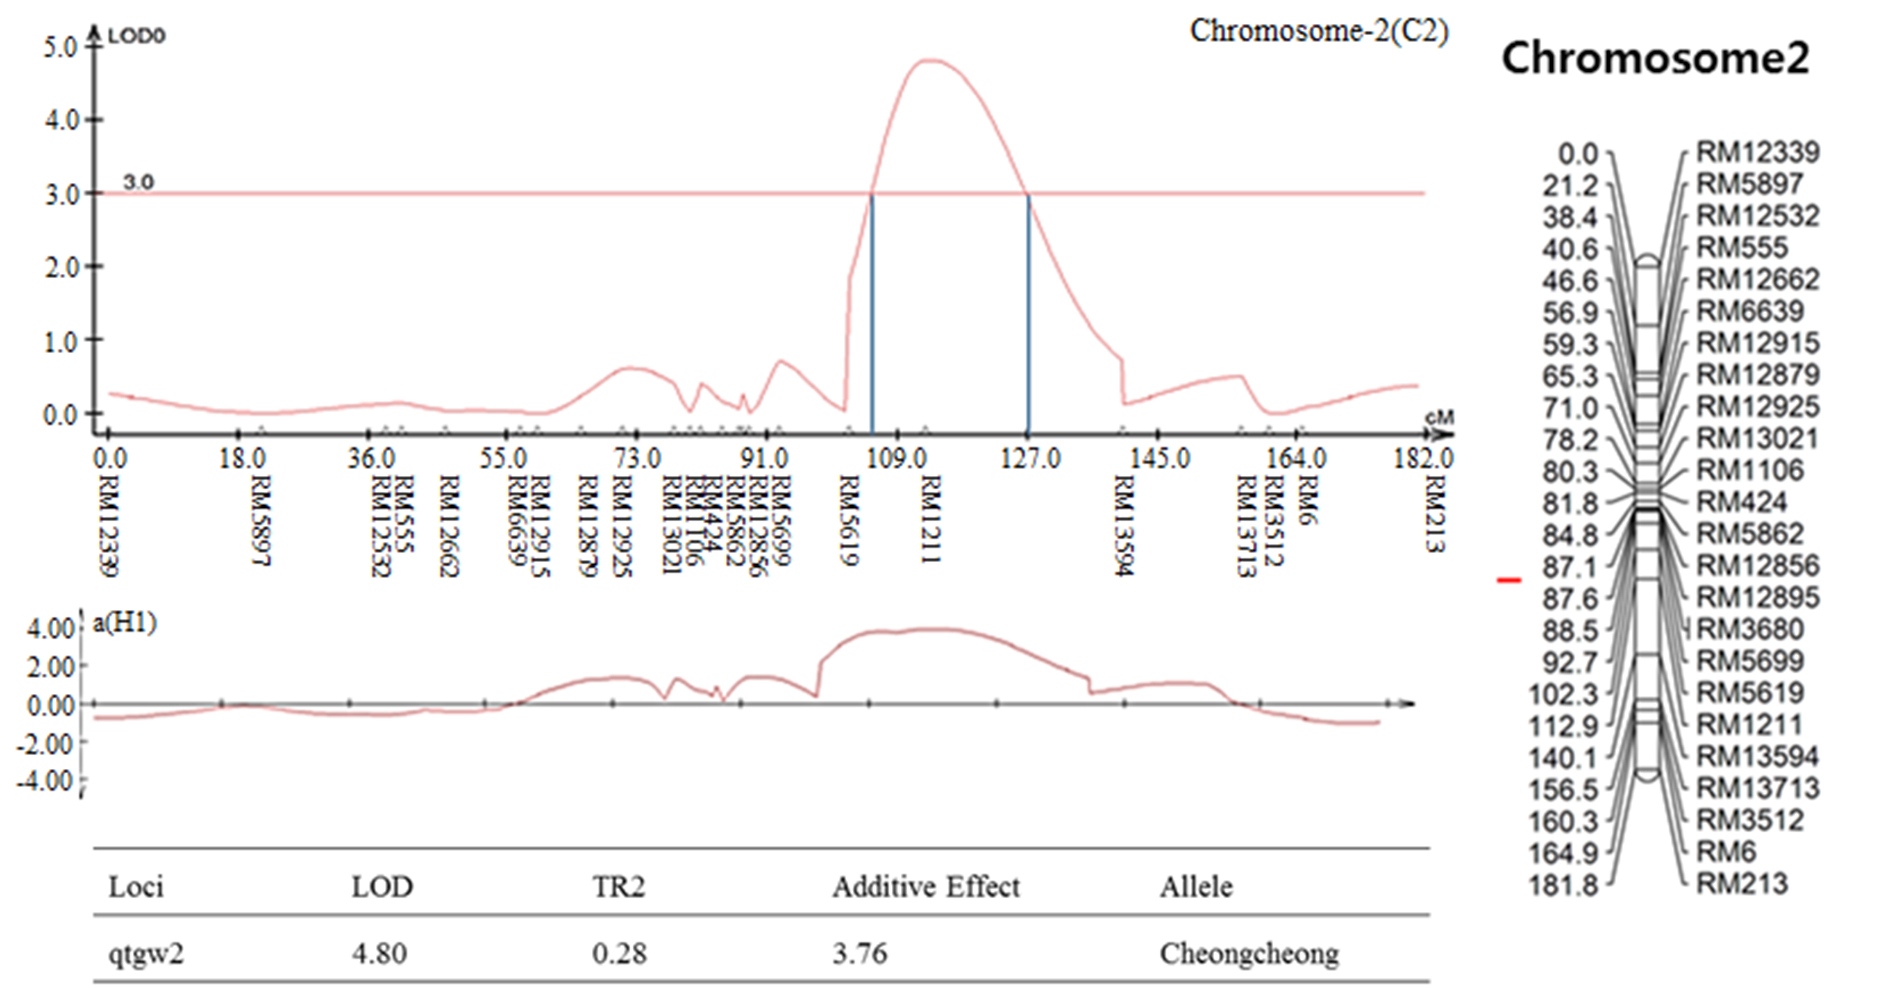
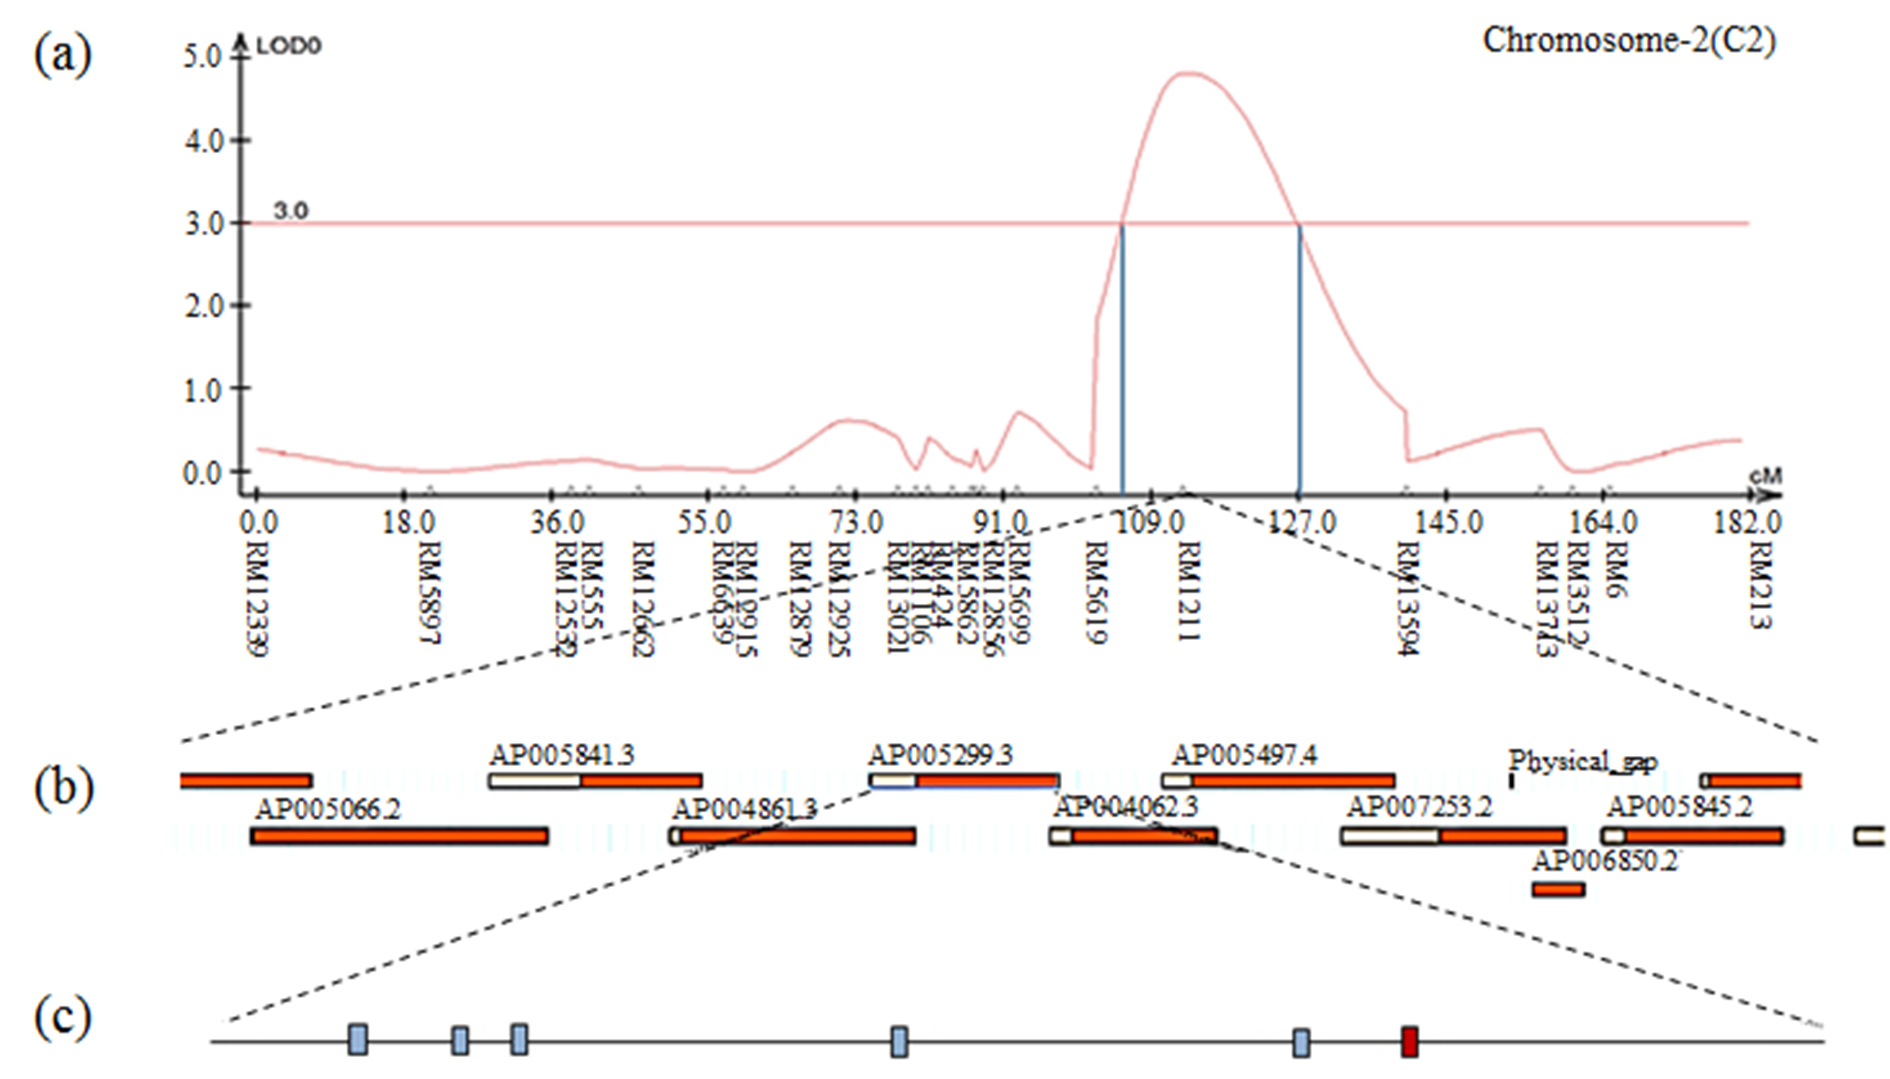
Fig. S11.
The result of contig analysis of the genomic region related to 1000 grain weight using the physical map of rice. (a) The chromosomal location of QTL associated with 1000 grain weight in CNDH lines. (b) The region extended from RM1211. (c) Five ORFs are involved in redox signaling and hormone signaling. The red box indicates the position of the MtN3 protein.
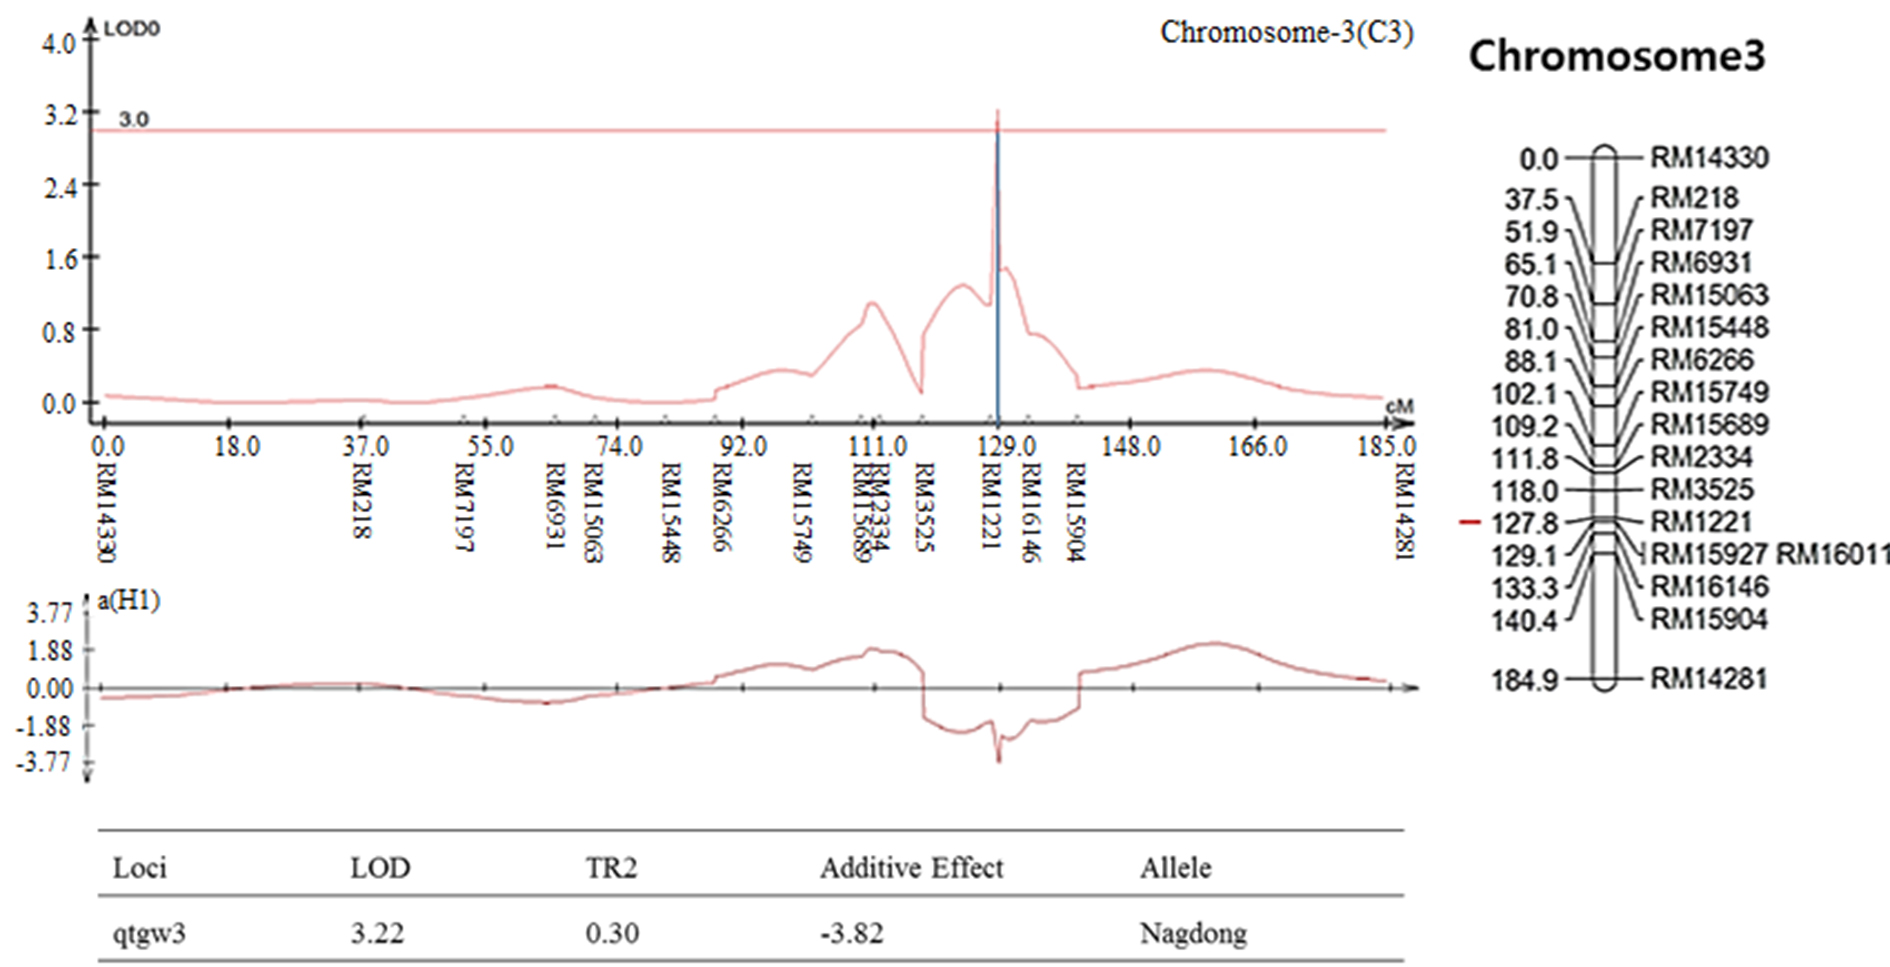
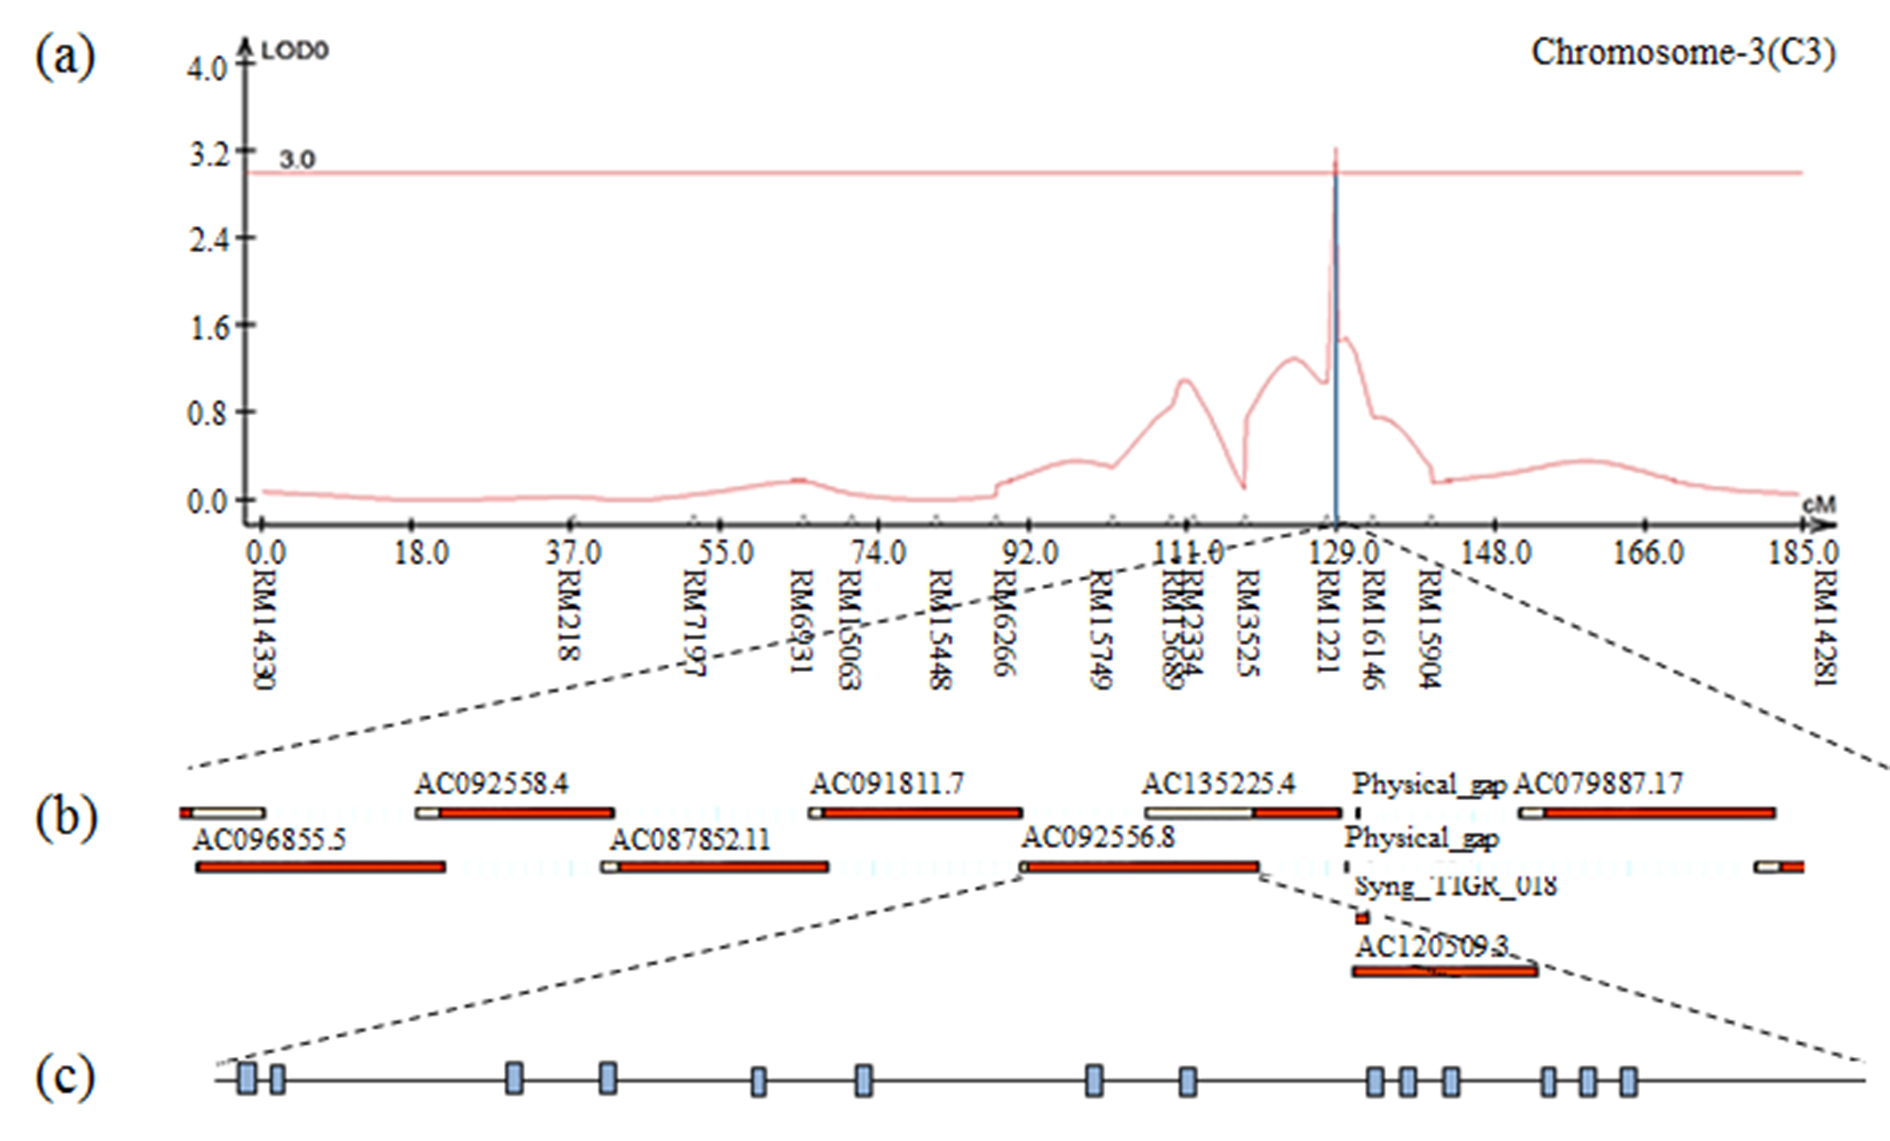
Fig. S13.
The result of contig analysis of the genomic region related to 1000 grain weight using the physical map of rice. (a) The chromosomal location of QTL associated with 1000 grain weight in CNDH lines. (b) The region extended from RM15927. (c) Fourteen ORFs in AC092556.8 are involved in cell function and hormone signaling.
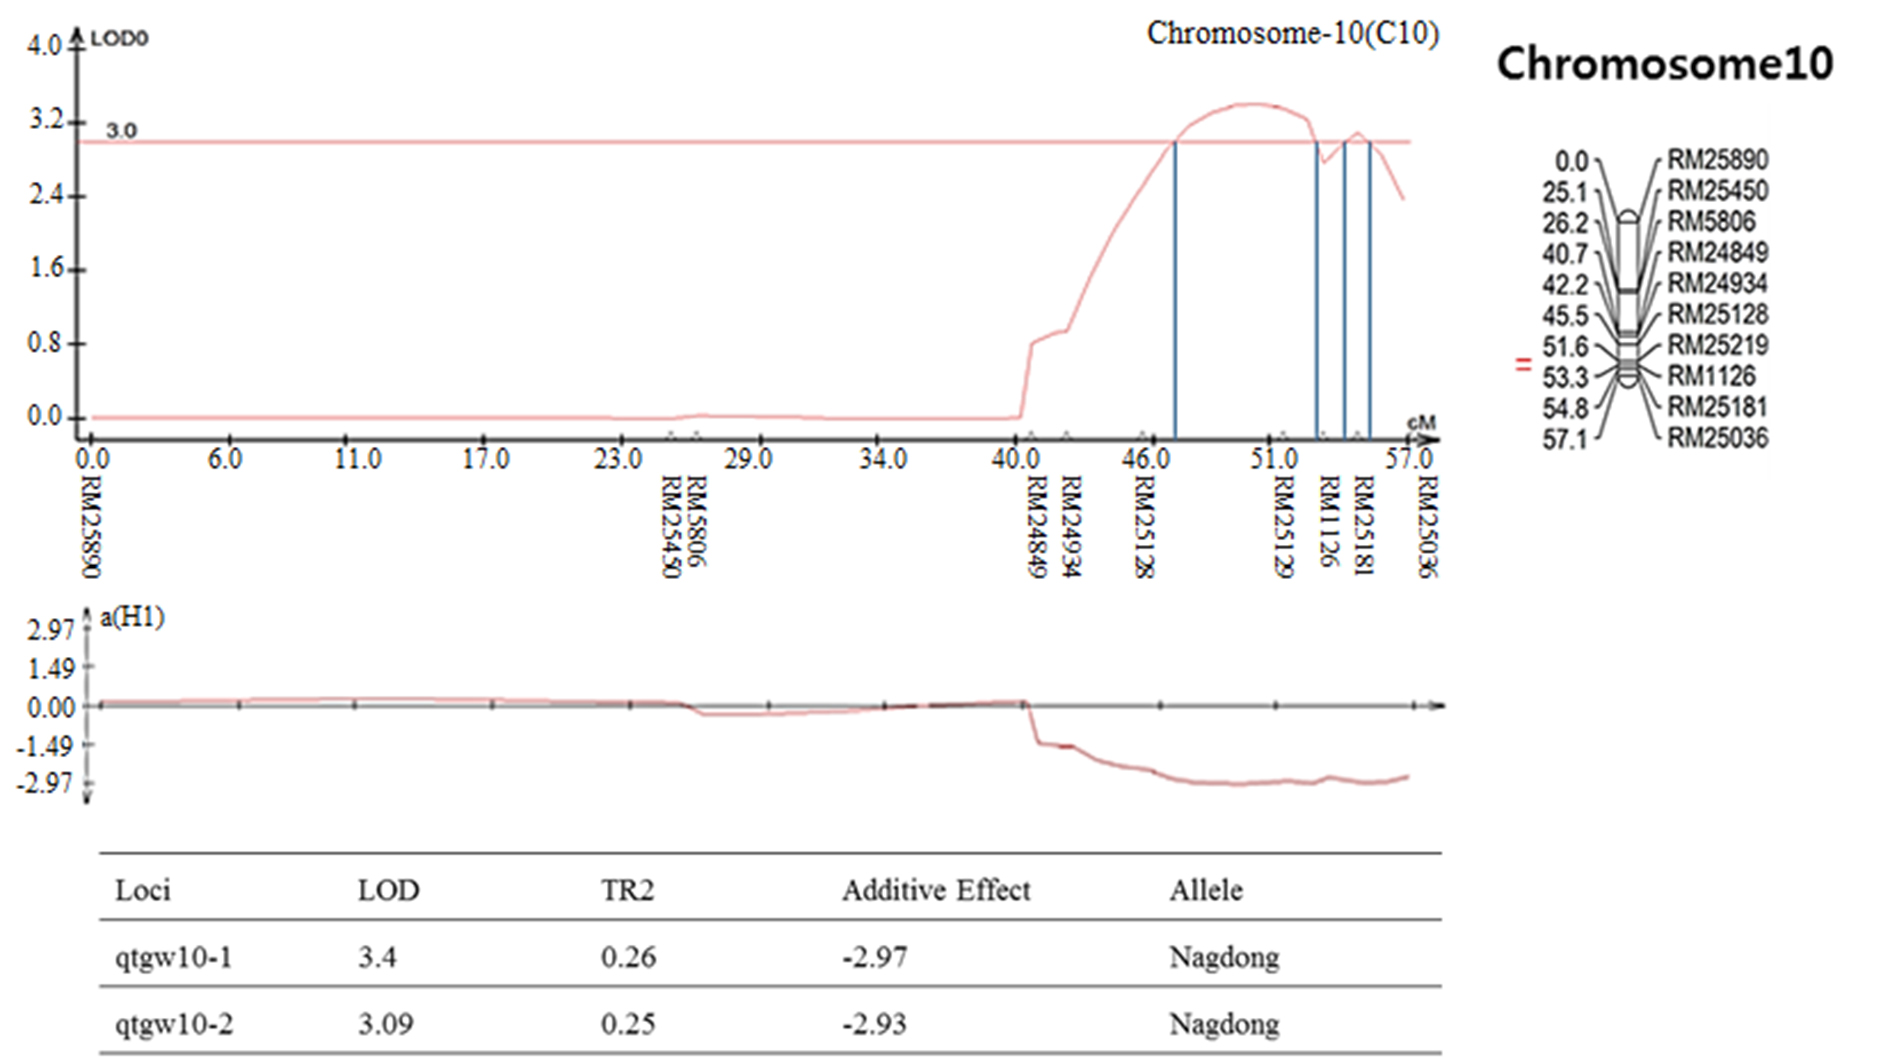
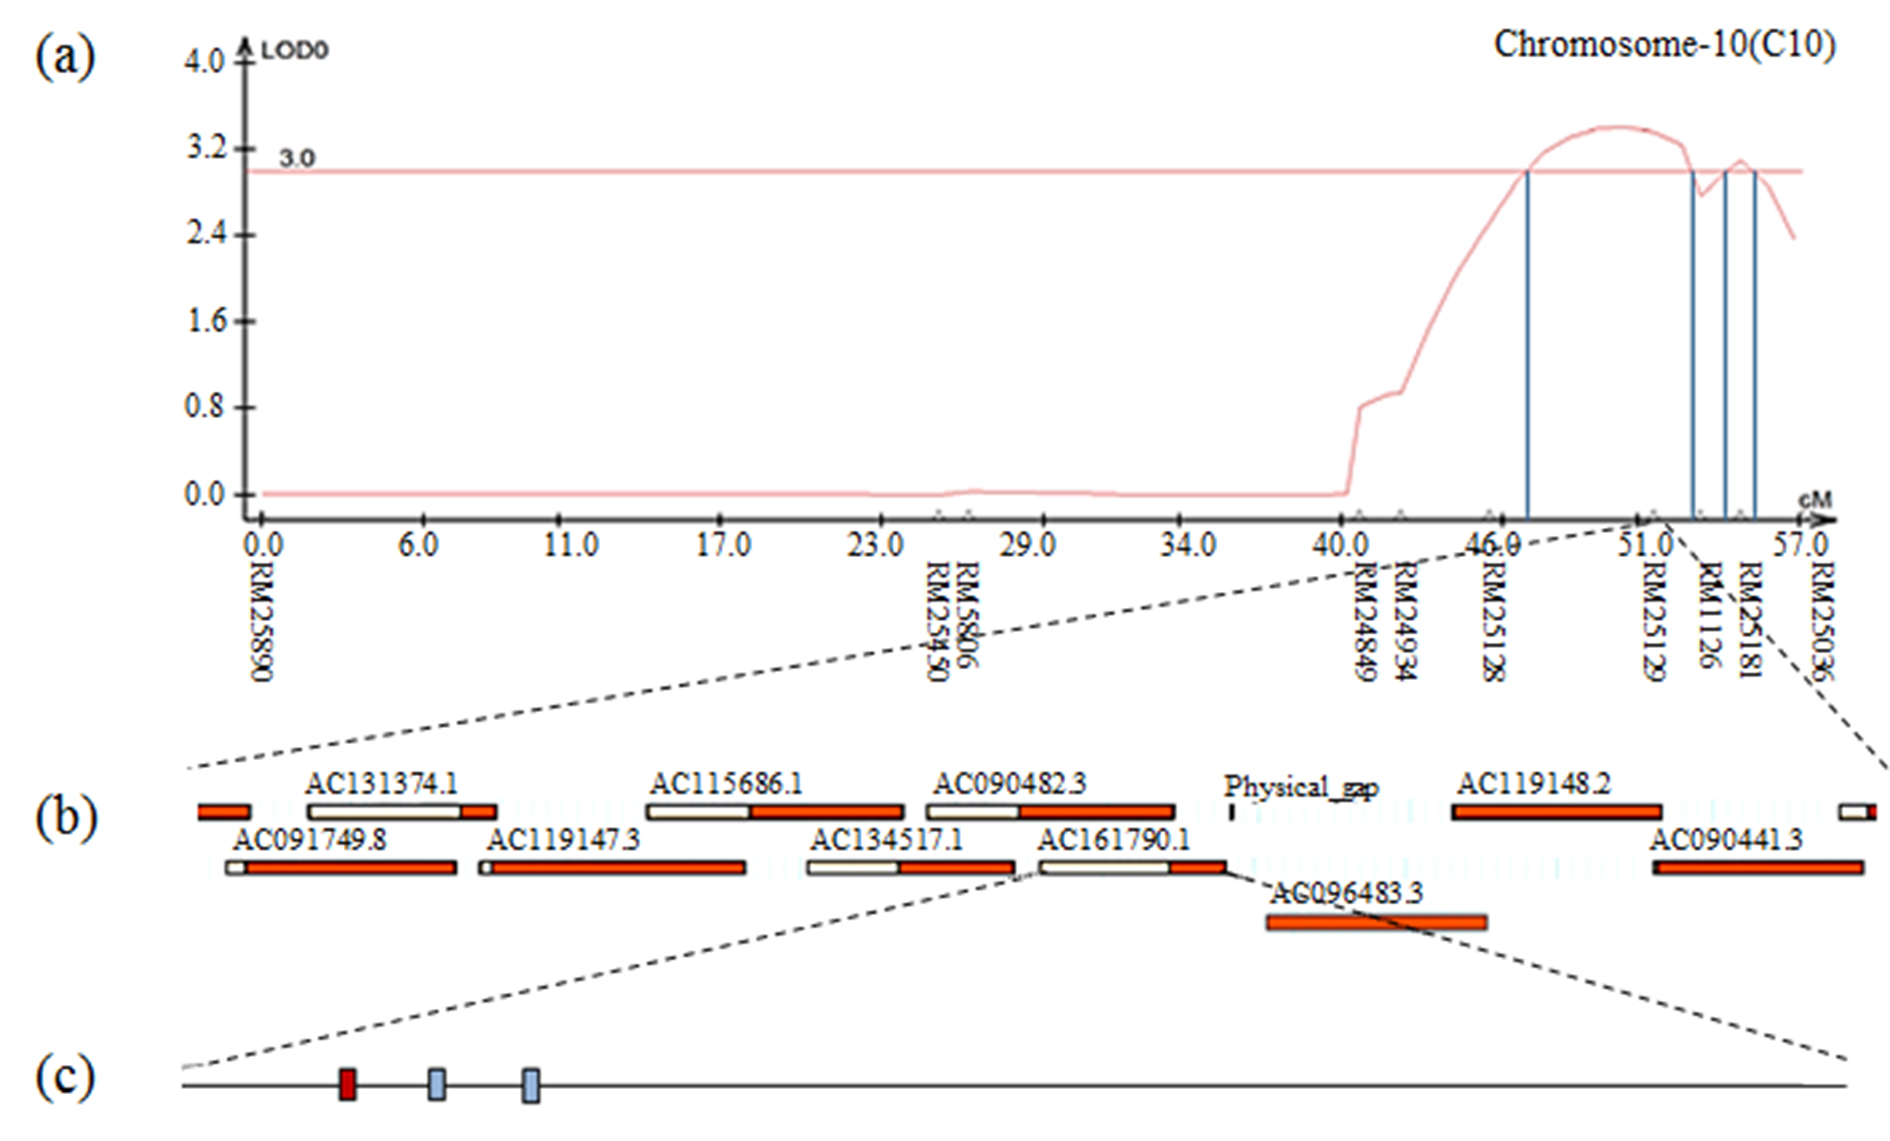
Fig. S15.
The result of contig analysis of the genomic region related to 1000 grain weight using the physical map of rice. (a) The chromosomal location of QTL associated with 1000 grain weight in CNDH lines. (b) The region extended from RM25219. (c) Three ORFs in AC161790.1 are involved in cell function and redox signaling. The red box indicates DHHC-type zinc finger.
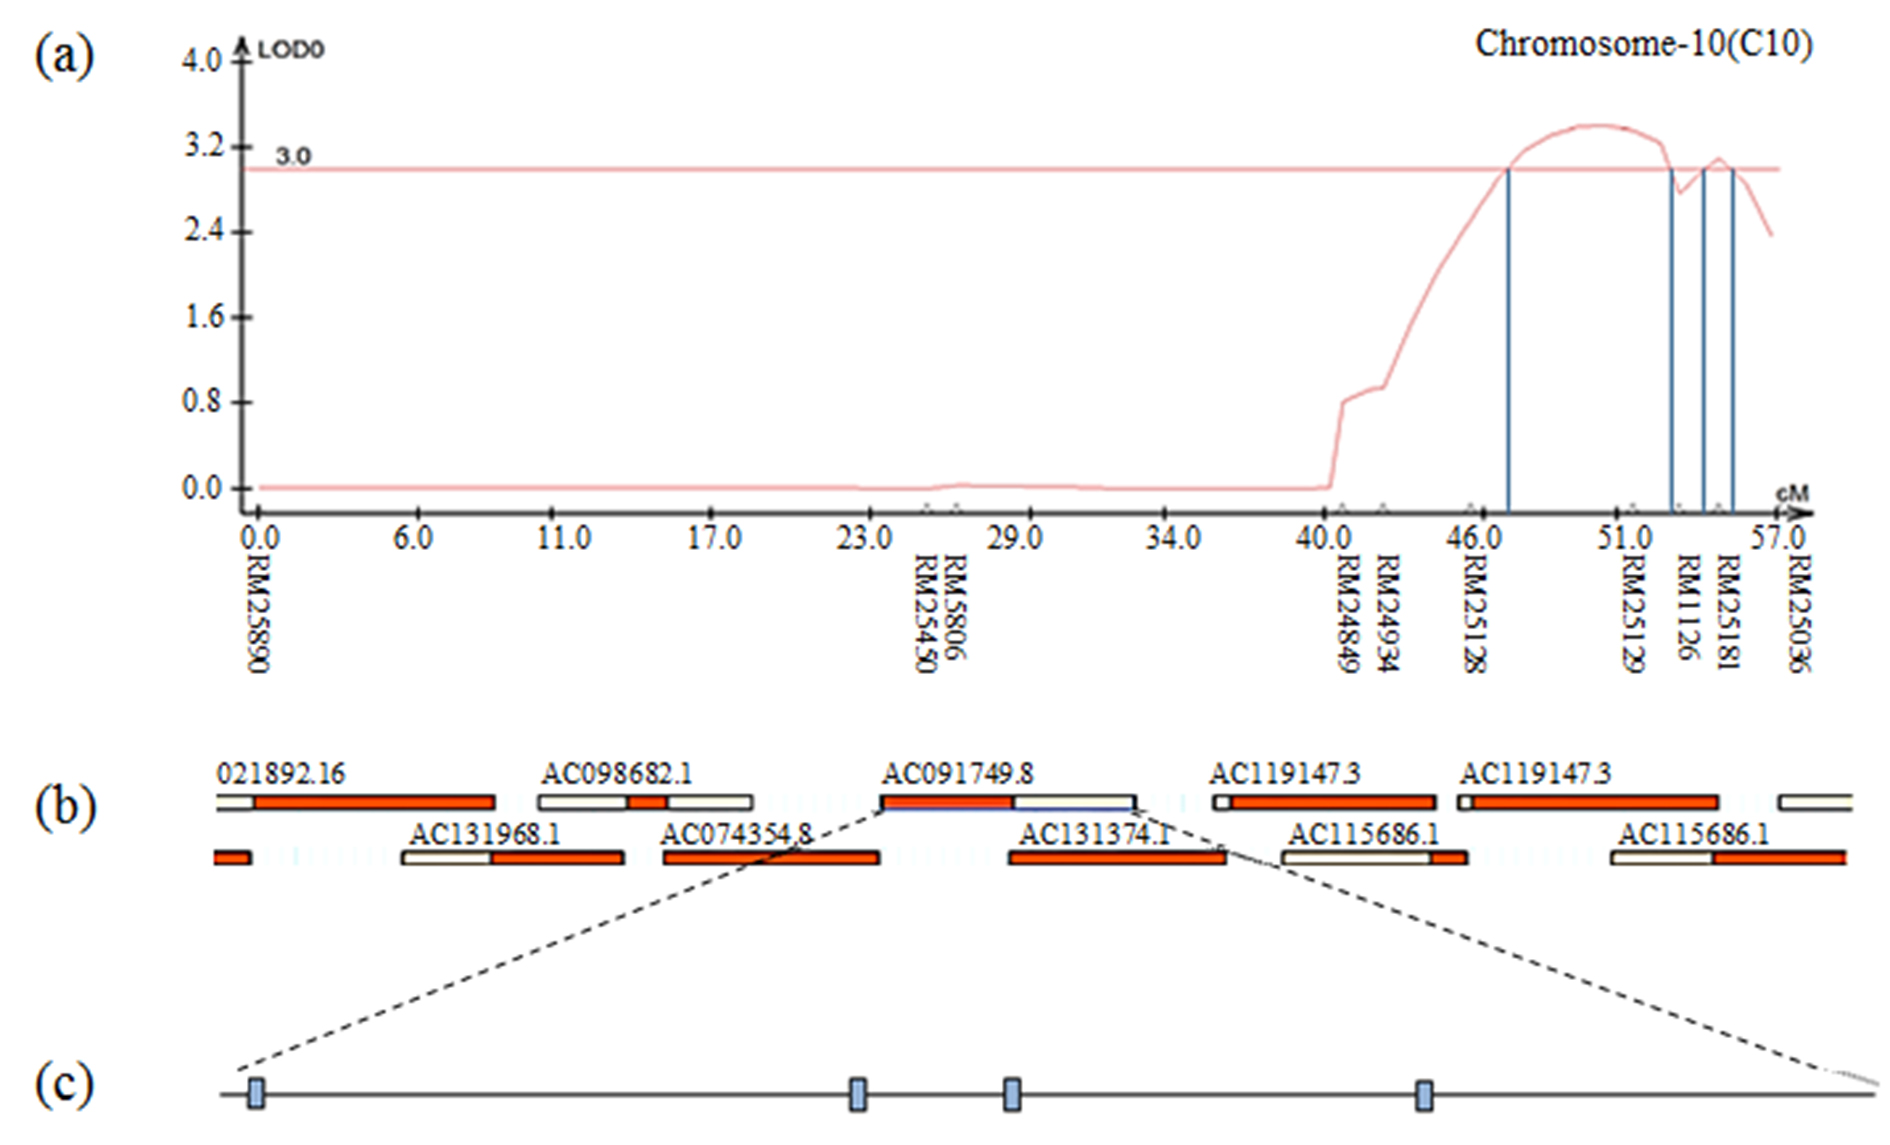
Fig. S16.
The result of contig analysis of the genomic region related to 1000 grain weight using physical map of rice. (a) The chromosomal location of QTL associated with 1000 grain weight in CNDH lines. (b) The region extended from RM25181. (c) Four of ORFs in AC090486.3 are involved in cell function and redox signaling.
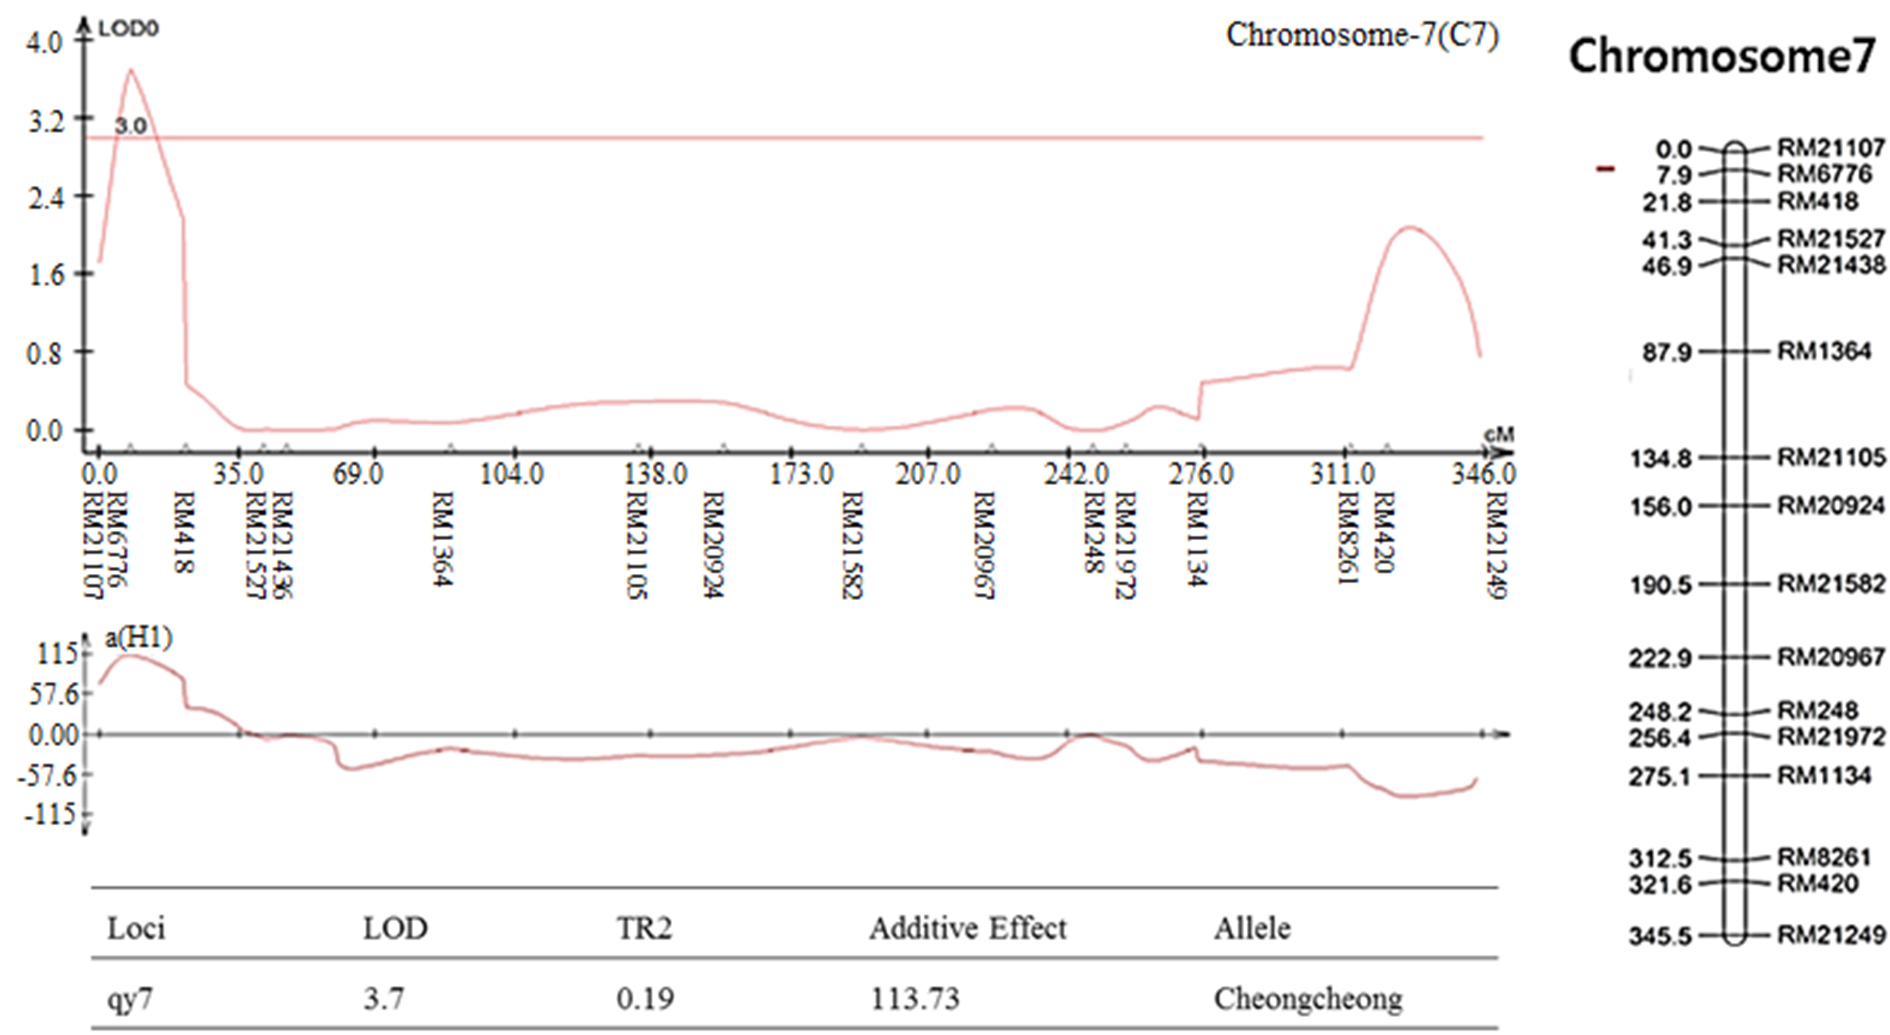
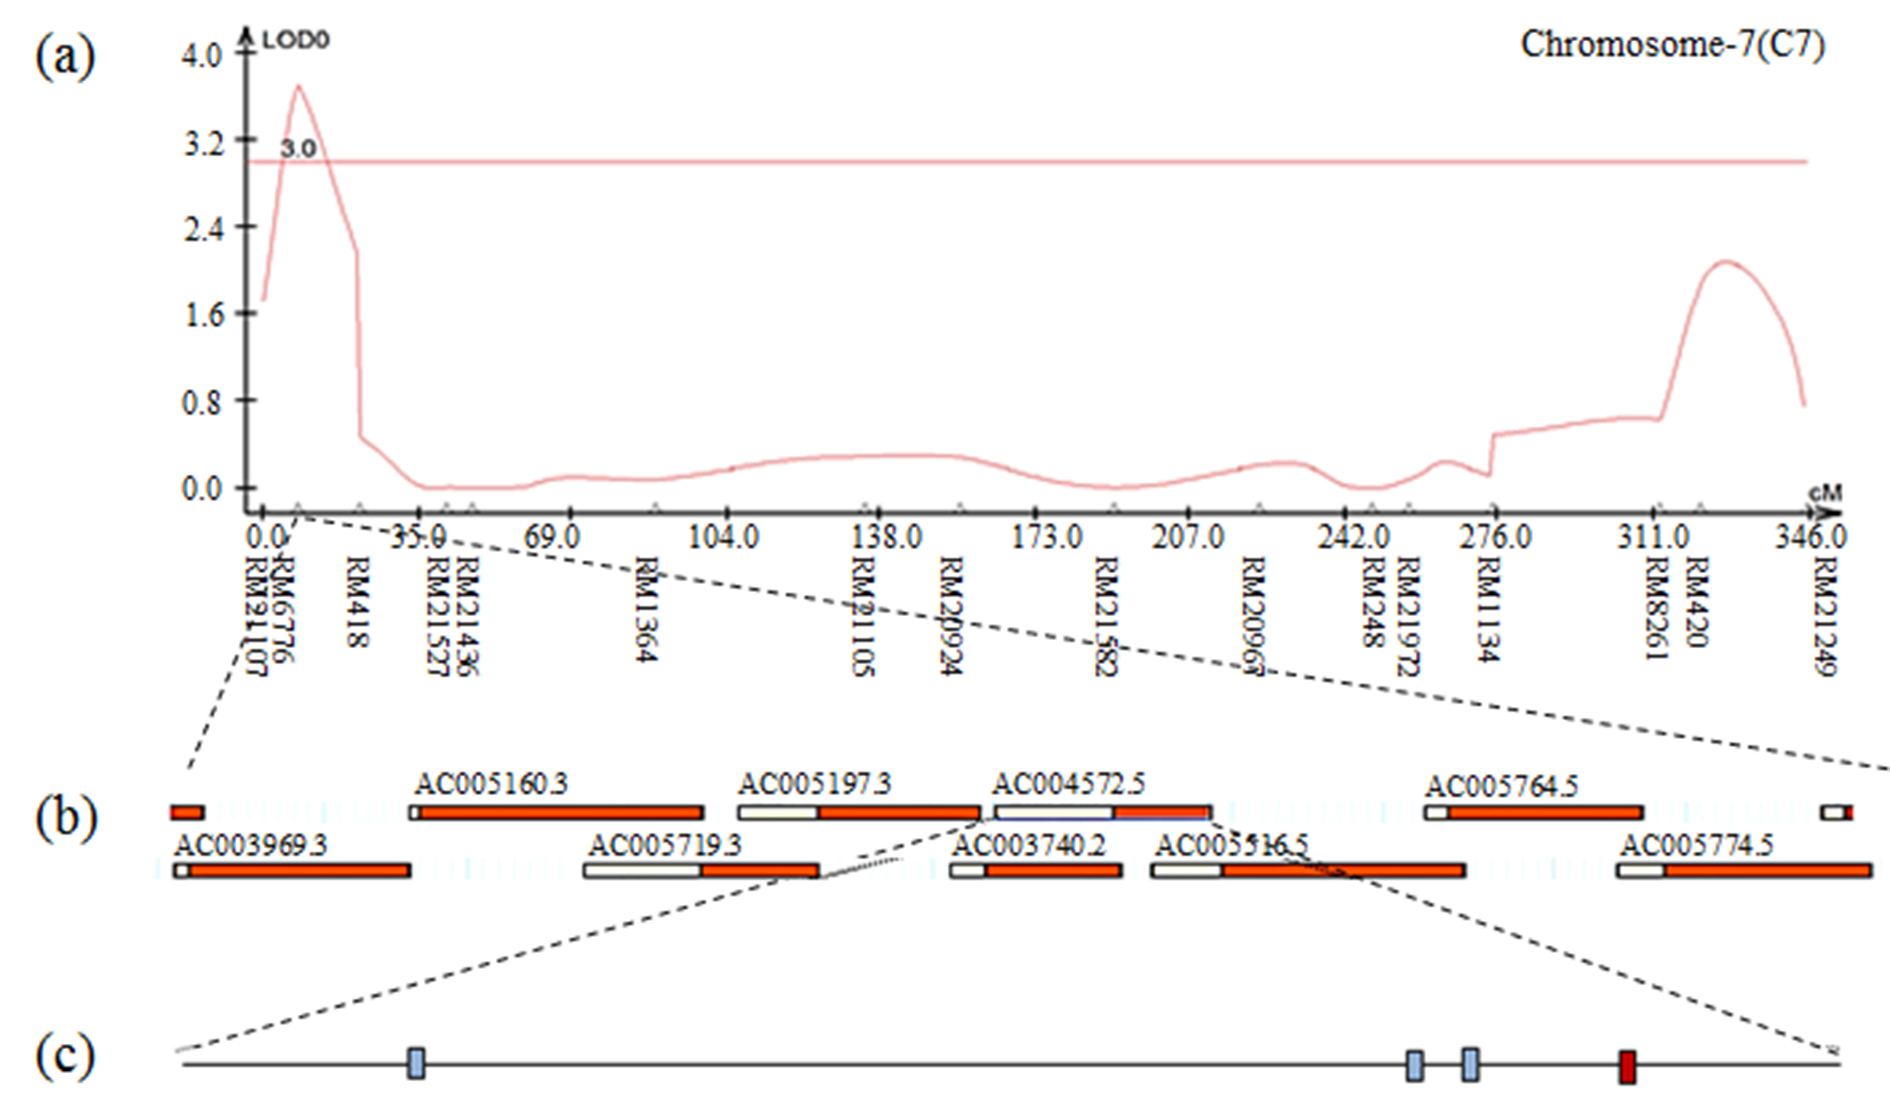
Fig. S18.
The result of contig analysis of the genomic region related to yield using the physical map of rice. (a) The chromosomal location of QTL associated with yield in CNDH lines. (b) The region extended from RM6776. (c) Four ORFs in AP004572.5 are involved in cell function. The red box indicates the OsNAC3 protein.
